Introduction
Current earth surface sediment yield, mainly assessed from solid and dissolved fluxes in rivers, is highly dependent on human activities whose impact is difficult to quantify compared with that of natural factors, particularly climate (e.g. Judson and Ritter, 1964; Douglas, 1967; Milliman and Syvitski, 1992; Ludwig and Probst, 1998). There are three main questions regarding human impact on sediment yield (Hooke, 2000; Ruddiman, 2003; Wilkinson, 2005). (1) When did it start? (2) How did it evolve? (3) What was its intensity? These questions can be investigated by assessing pre-human and syn-human sediment yields, through studying sedimentary archives stored in favourable basins, par-ticularly lakes (e.g. Campy et al., 1994; Macaire et al., 1997; Dearing and Jones, 2003). Many studies have shown a trend of increasing sediment yield over several thousand years in popu-lated areas (e.g. Zolitschka, 1998; Bichet et al., 1999; Dearing and Jones, 2003). These studies mainly concern solid sediment yield deduced from quantification of detrital sediment stores. Dissolved yield has been more rarely quantified (Einsele and Hinderer, 1998; Gay and Macaire, 1999), although chemical erosion has been found to be of major importance in some lithological or biocli-matic environments (Meybeck, 1987; Berner and Berner, 1987). There is very little infor mation about chemical sediment flux as compared to the detrital fraction because the precipitated fraction
of lake sediments is often difficult to differentiate and quantify. In a catchment of given physiography, the ratio of dissolved versus solid yield depends considerably on runoff and thus on vegetation related to climate and recently to human activities (Walling and Webb, 1986).
An overall increasing sediment yield over the last few thou-sand years, with some intermittent periods of lower yields, is generally interpreted as the result of human activities (e.g. Zolitschka, 1998; Hooke, 2000; Edwards and Whittington, 2001). This interpretation is based on various proxies of anthropogenic impact. The most usual human-activity proxy is the palynological
Quantitative analysis of climate versus
human impact on sediment yield since
the Lateglacial: The Sarliève palaeolake
catchment (France)
Jean-Jacques Macaire,
1Agathe Fourmont,
1Jacqueline Argant,
2Jean-Gabriel
Bréhéret,
1Florent Hinschberger
1and Frédéric Trément
3Abstract
Minimum rates of solid (SSY) and dissolved (DSY) sediment yield (SY) were evaluated in t/km2 per yr from sediments stored in the Sarliève palaeolake (French Massif Central) for seven phases of the Lateglacial and Holocene up to the seventeenth century. The catchment (29 km2), mainly formed of limestones and marls, is located in an area rich in archaeological sites in the Massif Central. The respective impacts of human activities and climate on SY were compared by quantification of human settlements through archaeological survey and palynological data. During the Lateglacial and early Holocene up to about 7500 yr cal. BP, variations in SSY and DSY rates were mainly related to climate change with higher rates during colder periods (Younger Dryas and Preboreal) and lower rates during warmer periods (Bölling-Alleröd and Boreal). However, CF1 tephra fallout induced a sharp increase in SY during the Alleröd. During the middle and late Holocene after 7500 yr cal. BP, SSY and DSY greatly increased (by factors of 6.5 and 2.8, respectively), particularly during the Final Neolithic at about 5300 yr cal. BP when the climate became cooler and more humid. After this date, at least 75% of the SSY increase and more than 90% of the DSY increase resulted from human activities, but SSY rates showed little variation during Protohistoric and Historic Times up to the seventeenth century. SSY and DSY rates and DSY/SSY ratio indicate that catchment soils began to form during the Lateglacial and Preboreal, thickened considerably during the Boreal and Atlantic, finally thinning (rejuvenation) mainly as the result of human-induced erosion during the sub-Boreal and sub-Atlantic. Increased mechanical erosion during the late Holocene also induced an increase in chemical erosion.
Keywords
archaeological survey, climate-change impact, French Massif Central, Holocene, land-use impact, Lateglacial, palaeolake, soil erosion, solid and dissolved sediment yield
20(4) 497–516 © The Author(s) 2010 Reprints and permission:
sagepub.co.uk/journalsPermissions.nav DOI: 10.1177/0959683609355181 http://hol.sagepub.com
1 Université François-Rabelais de Tours, CNRS/INSU, Université d’Orléans, UMR-CNRS 6113 ISTO, France
2Université Claude Bernard Lyon I, UMR 6636, France 3Université de Clermont-Ferrand, EA 1001, France
Received 12 April 2009; revised manuscript accepted 24 October 2009
Corresponding author:
Jean-Jacques Macaire, Université François-Rabelais de Tours, CNRS/ INSU, Université d’Orléans, UMR 6113 ISTO, Faculté des Sciences et Techniques, Avenue Monge, 37200 Tours, France
record which provides indirect information (deforestation, cereal cultivation, pasture, etc.) from vegetation. Evidence of early human presence is generally provided directly by artefacts, building structures, etc., but data are often very sparse and were not deter-mined in a systematic manner, and so make it impossible to quan-tify the density of human occupation and compare it with sediment yields at different periods.
The aim of this work was thus: (1) to quantify sediment yield (SY) from lacustrine sediment stores for different periods before and during human impact since the Lateglacial, distinguishing rates of solid sediment yield (SSY) from dissolved sediment yield (DSY), (2) to compare these rates with quantitative data of human settlement (age, density and location of archaeological sites) from detailed and systematic archaeological surveys in the lake catch-ment; intensity and type of human activities were evaluated from analysis of pollen grains in lacustrine sediments, and (3) finally to evaluate the land surface lowering by catchment-soil erosion which contributed to the sediment yield.
The studied area is a small lacustrine catchment in the centre of France. Lacustrine deposits, stored since the Lateglacial, have been the subject of detailed sedimentological, palaeohydrological and geophysical studies (Bréhéret et al., 2003, 2008; Fourmont, 2005; Fourmont et al., 2006, 2009; Hinschberger et al., 2006). This catchment, located in a major site of French history (‘oppidum de Gergovie’), contains considerable evidence of human settlement since the Neolithic and has been the subject of systematic archaeo-logical surveys (Trément et al., 2005, 2006, 2007a, b).
The Sarliève palaeolake and
its catchment: geological
setting, sedimentological and
palaeohydrological evolution
Here, and in the following sections, all ages are given in calibrated years BP. Calibration of radiocarbon ages is based on the
INTCAL04 data set. The ‘Marais de Sarliève’ is an ancient lake (surface area: 5 km2 maximum, altitude: approximately 345 m),
formed a little before 13 700 yr cal. BP (Fourmont et al., 2006). It is located in the Auvergne region, 10 km southwest of Clermont-Ferrand in the Limagne rift (x = 663 780 m; y = 2 082 180 m in the Lambert Conformal Conic system; Figure 1A). The origin of the lacustrine depression is probably tectonic (Ballut, 2000; Trément et al., 2007b; Fourmont et al., 2009); it can only be drained by evaporation or via the outlet located at the northeastern end of the catchment (Figure 1B). The depression filled with sediments until it was drained by humans during the seventeenth century (Fournier, 1996); it is bordered on the north and east by alluvial terraces. The catchment (total surface area: 29 km2) is
mainly composed of Oligocene marls and limestones, partly dolo-mitic and sometimes gypsum-rich, with small outcrops of basaltic rocks on the surrounding hills up to 745 m (Jeambrun et al., 1973). Bed-rock is generally covered with superficial formations derived from Oligocene carbonated rock (Figure 1B). This area is cur-rently characterized by a strong continental climate: mean annual rainfall is less than 600 mm and mean annual temperature is approximately 11°C (min 4°C, max 21°C) (Kessler and Chambraud, 1986).
Lacustrine sediments, studied through deep pits and core drill-ings, consist of delta and basin deposits (Bréhéret et al., 2003, 2008; Fourmont et al., 2006, 2009). Delta deposits, 4–5 m thick (D1 to D7, Figure 2A), are located in the median part of the depression and comprise several units. From base to top these are: D1, beige to greenish carbonated clayey-silts (CS); T1, black pyroclastic sands; D2, several metres-thick deltaic sands com-posed of alternating layers of dark tephric sand and light-coloured more carbonated sandy-silt; D3, sandy colluvium topped by a palaeosoil; D4, ochre sands; D5, homogeneous greenish calcitic CS including a thin, pale pink tephra T2; D6, charcoal-rich black calcitic CS; D7, greenish-grey to brown calcitic CS. Basin depos-its, 5–6 m thick, observed in the north and south lobes of the depression (B1 to B6, Figure 2A, B), are made up of clayey-silty Paris Clermont-Ferrand Loire riv er Thiers Puy de Dôme 1465m Puy de Sancy 1885m Issoire 15 km 1 km A71 A72 Sarliève paleolake sediments Surficial formations Bed-rock formations Alluvial terrace Basalt-rich slope sediments Carbonate-rich slope sediments Miocene basalts N Miocene detrital sediments Oligocene volcano-sedimentary formations Oligocene limestones and marls Elevation (metres) I, II: cross-sections (see Fig. 2)
Sarliève paleolake catchment
A
Puy d'Anzelle lake outlet Sarliève paleolake Gergovie Plateau Artière riv. Auzon riv. Puy de Bane 528 m 345 m 745 m 400 I II 400 400 400 500 500 600 600 700 542 mB
Elevation (m) Delta area Basin area Basin area Fluvial terrace Basin area S23 S11 S26 S10 S1 B1 B3 B6 D6 D8 D7 B5 B4 B2 B1 B1 P P C C C D1 D1 D6 D8 D7 T1 T1 D2 D2 D3 D3 D4-T2-D5 D4-T2-D5 B2 B3 B4 B5 B6 B1 B2 B3 B4 B5 B6 S9 S8 S7 S5 S6 S4 S3 S2 SP4 SP3 SP1 S14 S9 S27 S15 344 342 340 338 344 346 348 350 342 340 338 400 m 400 m soil formation soil formation soil formation
C - Late Glacial up to 13.7 kyrs cal BP
Outlet
344
342
340
338
m Northern basin Delta Southern basin
D - At ca. 13.7 kyrs cal BP
Outlet 344 ? ? 342 340 338
m Northern basin Delta Southern basin
E - Ca. 13.7 kyrs cal BP - ca. 11.5 kyrs cal BP
maximum water level probable usual water level
Outlet
344
342
340 338
m Northern basin Delta Southern basin
F - Ca. 11.5 kyrs cal BP - ca. 9.8 kyrs cal BP
Outlet
344
342
340 338
m Northern basin Delta Southern basin
G - Ca. 9.8 kyrs cal BP - ca 7.5 kyrs cal BP
Outlet
344
342
340 338
m Northern basin Delta Southern basin
H - Ca 7.5 kyrs cal BP - ca 5.3 kyrs cal BP
Outlet
344
342
340 338
m Northern basin Delta Southern basin
I - Ca 5.3 kyrs cal BP - ca 2.3 kyrs cal BP
Outlet
344
342
340 338
m Northern basin Delta Southern basin
J - Ca 1.8 kyr cal BP - ca 0.3 kyr cal BP
Outlet
344
342
340 338
m Northern basin Delta Southern basin
A - Cross-section I
B - Cross-section II
N-NW S-SE
SW NE
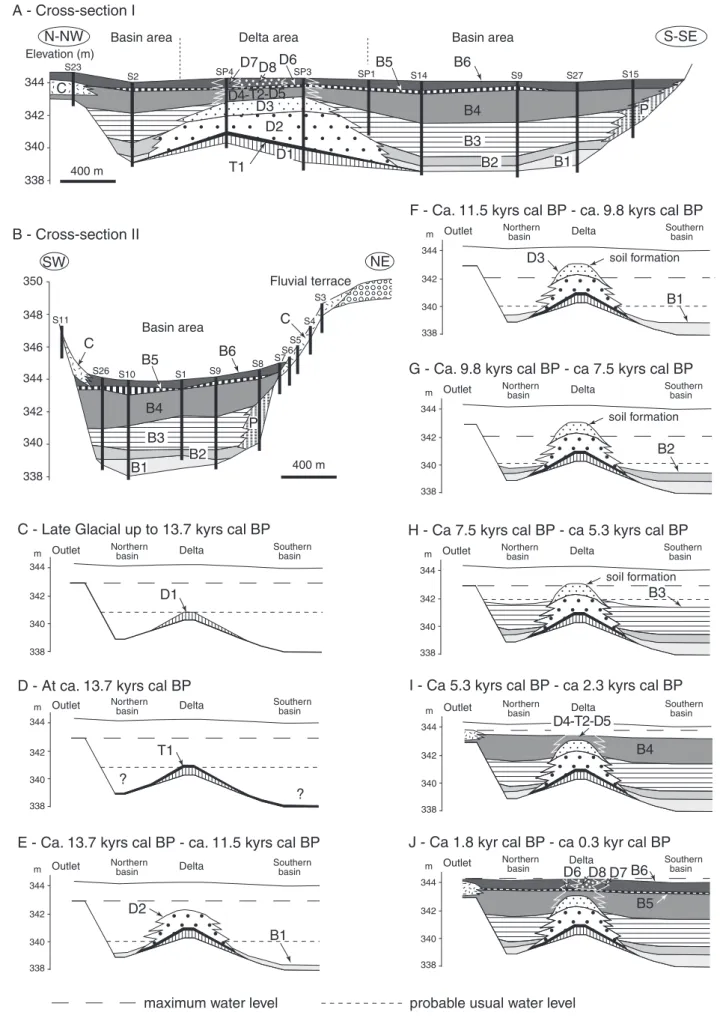
Figure 2. Cross-sections through sediments (A, B) and pattern of Sarliève palaeolake evolution since the Lateglacial up to the seventeenth
century (C to J) (from Fourmont et al., 2009). Location of I and II cross-sections, see Figures 1 and 4B. S2, S9, core drilling; SP3, SP4, pit section; D1 to D7, delta deposits (T1 and T2, tephras); B1 to B6, distal basin deposits; P, proximal basin deposits; C, colluvium
sediments, generally carbonate-rich, showing from base to top: B1 unit, quartz-rich compact yellowish to greenish clayey-silts (CS), characterized by the presence of zeolites; B2, grey to blue clayey-silts mainly composed of authigenic dolomite; B3, alterna-tion of dark calcitic CS (cm-thick layers) with bundles of dolo-mitic and aragonitic laminae; B4, homogeneous greenish calcitic CS; B5, charcoal-rich black calcitic CS; B6, greenish-grey to brown calcitic CS. The lower part of proximal basin deposits con-tains a dark sandy layer incorporating reworked pyroclastic parti-cles (similar to T1 and D2).
The following palaeohydrological and sedimentological scheme of the lake’s evolution (Fourmont et al., 2009) has been drawn up from distribution and comparison of sedimentary facies, 14C datings,
tephra ages and detailed mineralogical and geochemical analysis. During the Lateglacial up to c. 13 700 yr cal. BP (mainly Bölling), D1 unit sediments, containing c. 30% travertine-like precipitated material, were deposited in the delta area; no evi-dence of coeval sediments was found in basins. Water level was low, with a maximum depth of c. 5 m (Figure 2C). At c. 13 700 yr cal. BP, at around the beginning of the Alleröd, direct CF1 tephra (Vernet and Raynal, 2000) was deposited (T1 unit, Figure 2D). While it probably covered the whole catchment area, CF1 tephra has only been observed in delta sediments where it was buried under the D2 unit deposited in a fan-type delta during the period 13 700 yr cal. BP–11 500 yr cal. BP (Alleröd and Younger Dryas) (Figure 2E). The D2 unit, exclusively detrital in origin, includes layers of tephra reworked from catchment slopes, sug-gesting a rise in water level during flood event(s) to more than c. 342 m, which probably led to a short-lived opening of the lacustrine depression. However, during the same period, from 13 700 yr cal. BP up to c. 9800 yr cal. BP, authigenic zeolites and quartz formed in the distal basin B1 unit, partly because of alteration of CF1 tephra, and indicating endorheic conditions with a generally low water level and reduced detrital input (c. 60% of B1 sediments) (Figure 3).
After c. 11 500 yr cal. BP (early Holocene), colluvium (D3 unit) was deposited on the emerged delta area (Figure 2F). Soil formed at the top of D3, probably during the early and middle Holocene until the end of the Atlantic period (Figure 2G, H). During this period (9800 yr cal. BP until 7500 yr cal. BP) authigenic dolomite-rich sediments (B2 unit) formed in the basins, indicating perennial endorheic conditions. The bio-chemical dolomite content increased in the B2 sediments from 30% (bottom) to 60% (top), indicating maximum restriction at around 8000 yr cal. BP (Figure 3). The water level did not reach the top of D3, and the water was probably quite shallow (less than 1–2 m deep).
During the middle Holocene, from c. 7500 yr cal. BP until c. 5300 yr cal. BP (Atlantic period), when the delta area was never flooded (Figure 2H), unit B3 was deposited in the basins. Interbedding of laminated biochemical sediments (BL facies) with detrital sediments (homogeneous clayey-silts: HCS facies) indi-cates variations in palaeohydrology and related depositional con-ditions. Bréhéret et al. (2008) identify three phases of BL–HCS facies sedimentation: (1) dolomite authigenesis in BL under restricted conditions similar to B2; (2) aragonite genesis in BL, indicative of Ca2+-rich freshwater inputs when facies are
com-posed of 20% to 60% biochemical phases (Figure 3) and deposited while lake waters were salty; and (3) HCS facies, where bio-chemical phases constituted less than 10%, indicating increased
detrital input during periods with low water level and salty water, ending with the input of fresh water. This trend could be related to repeated time-limited fluctuations of the water level which was generally below the top of D3 palaeosoil, i.e. c. 342/343 m. The duration of one BL + HCS deposition sequence has been evaluated at 150 yr on average in B3 and 470 yr at the maximum between 7100 ± 150 yr cal. BP and 7260 ± 160 yr cal. BP. However, the gradual thickening of detrital HCS facies towards the top of B3 indicates the increasing input of fresh water and the possible tem-porary opening of the system.
The sediment geometry shows that the water level was high during the late Holocene from 5.3 ka cal. BP: B4 to B6 units accu-mulated when the lake extended, covering the delta area and border deposits (Figure 2I, J). Water-level altitude must have been at least 343 m at the beginning of the sub-Boreal, and 344/345 m in the seventeenth century. Apart from the D4 sandy transgressive facies and local D8 sandy-gravelly deltaic facies, the upper sediments of the whole delta (D5 to D7 units) and basin (B4 to B6 units) have a homogeneous composition. They contain more than 80% detrital materials, and biochemical calcite is always < 20% (Fourmont et al., 2009; Figure 3). The waters were probably continuously fresh, implying a perennial body of water in the lake, total opening of the depression and continuous water supply from the catchment. However, archaeological data (Gallo-Roman settlements, cemetery and drainage networks in the palaeolake basins) show that the lake dried up between the third century bc and secondcentury ad
Lacustrine sediment oxides (as % of the bulk) Sediment units Detrital oxides hiatus CaO prec SiO2 + Al2O3 prec Age
(in yrs cal BP)
B1
B2
B3
B4
B5
B6
0 0 20 40 60 80 100 2000 4000 6000 8000 10000 12000 MgO precFigure 3. Evolution of contents in detrital and precipitated fractions
in Sarliève palaeolake basin sediments (core S17). CaOprec, MgOprec and SiO2 + Al2O3prec, precipitated CaO, MgO and SiO2 + Al2O3 in percents of lacustrine bulk sediments (from Fourmont et al., 2009). SiO2 + Al2O3 were precipitated from CF1 tephra weathering
because of human activities (Trément et al., 2007b). Moreover, ‘catastrophic’ flood(s) occurred between the fourth and seventeenth centuries ad, causing sandy-gravelly fan delta deposition (D8 unit),
and resulting in the water level rising above 346/347 m. Finally, the lake was drained during the seventeenth century (Fournier, 1996), and since then the water has run in artificial channels.
Methods
Evaluation of catchment physiographical
characteristics and calculation of sediment
yield rates
Some parameters of relief and lithology were analysed using GIS. Slope gradient and true surface area of the catchment were calcu-lated from DEM using Arcview 8.2 software and digitizing eleva-tion contour lines of Institut Géographique Naeleva-tional (IGN) 2531E and 2532E 1/25 000 maps. Surface areas of main types of rocks were assessed by digitizing XXV-31 ‘Clermont-Ferrand’ 1/50 000 geological map (Jeambrun et al., 1973).
Sediment yielded by catchment was calculated in t/km2 per yr
from stored lacustrine sediment mass. Volumes of main sedimen-tary units (delta sediments: units D1 to D8, and T1 tephra; basin sediments: units B1 to B6) were calculated from their thickness and extent using different methods. Facies and thickness of sedi-ments were observed directly (1) from 13 pit sections of 8 m × 8 m, carried out up to a depth of 3.3 m by the Institut National de Recherches Archéologiques Préventives (INRAP) for an archaeo-logical survey of the construction site of the ‘Grande Halle d’Auvergne’, located near by the delta area, and (2) from 31 core drillings retrieved with a percussion sampler (Eijkelkamp) by the geological laboratory of Tours (UMR CNRS 6113 ISTO) in north-ern and southnorth-ern distal basins (Figure 4B). Sediment thickness and extent were determined using 56 geotechnical tests (static pene-trometry using 100KN penetrometer) carried out by Fondasol-Auvergne: penetrometric data mainly identified hard substratum (resistance to penetration R > 6 Mpa), and with regard to lacus-trine sediments, clayey silty (B1 to B6, D1, D4 to D7 units: R < 2 MPa), sandy-silty (T1, D2 and D3 units: 2 < R < 6 MPa) and gravelly-sandy (D8 unit: R > 6 Mpa) bodies, according to data of Antoine and Fabre (1980).
In the northern and southern basins about 50 km of electro-magnetic profiling was performed using an average recording distance of 7 m along the profiles, a lateral spacing of 20 m to 100 m, an EM 31 instrument, and the slingram method (Mc Neil, 1980) (Figure 4C). Electrical conductivity of surficial deposits up to about 6 m depth was calibrated with lithological facies observed from core drillings. Sixteen electrical soundings were also performed. Based on the geophysical survey, the total thick-ness of lacustrine sediments in basins and the thickthick-ness and extent of sediment units mainly composed of precipitated (B1 to B3) and detrital material (B4 to B6) were determined (Hinschberger et al., 2006). Spatial analysis of these data (eleva-tion of bottom and top, and 3D extent of units) were performed using SIG (Arcview 8.2; Fourmont, 2005). Interpolation by krig-ing was used to delineate the shape of lacustrine sediment units, based on which sediment volumes were calculated. It was not possible to distinguish the limit between T1 (tephra) and D2 (tephra-rich delta sediments) units, as their grain sizes are similar. Likewise, clayey-silty D6-B5 (charcoal-rich black calcitic CS)
and D7-B6 (greenish-grey to brown calcitic CS) units could not be distinguished (Figure 2).
The apparent volumetric mass (dry weight divided by the wet volume, in t/m3) of the basin-unit sediments was calculated by
weighing sediments after given volumes of sediments were dried at 40°C for 48 h. We decided that the apparent volumetric mass of lower sandy delta units, which could not be measured, was 1.5 t/m3,
based on data of Macaire et al. (2006). The sediment mass for each unit was calculated by multiplying the unit’s volume with the experimentally derived volumetric mass. From these data we cal-culated the mass of material (detrital and precipitated) forming each lithological unit, using the data of Fourmont et al. (2009). For B3 unit, composed of alternating precipitated material-rich laminae (BL) and detrital material-rich layers (HCS), the whole sediment mass was calculated from the volumetric mass of BL and HCS facies weighted by their relative thickness in the unit. The evolution of the mass of precipitated material compared to detrital material from bottom to top in B3 was deduced from evolution of the thickness of BL compared with HCS facies.
Age and period of formation of each lithological unit were calculated based on the chronological model of Fourmont et al. (2009), that is based on 18 calibrated 14C ages of seeds, charcoal
and bulk sediment organic matter, performed by the CDR (Centre de Datation par le Radiocarbone, Lyon 1 University), completed with information from pollen zones, tephrochronology and archaeological data. The base of D1 was arbitrarily chosen as the beginning of the Bölling (15 000 yr cal. BP). Deposition of D3 colluvium was attributed to the Preboreal (duration: 1100 yr), and palaeosoil formation on this colluvium to the Boreal and Atlantic (duration: about 5100 yr).
Sediment source area for calculation of the sediment yield was determined for each unit as the difference between the total catch-ment area and the unit surface area in the lacustrine area. Sediment yield rates were estimated in t/km2 per yr by dividing
the each unit’s sediment mass by the surface of sediment source and the time period of formation of the unit. Total sediment yield (TSY) was calculated, as well as solid (SSY) and dissolved (DSY) sediment yields. It was possible to distinguish between detrital and precipitated material in sediments thanks to geo-chemical, XRD, SEM and EDS analyses. Mineral study suggests that, except in B1, silicates (quartz, feldspars, zeolites and clay minerals) are mainly detrital, and carbonates (calcite, dolomite and aragonite) are both detrital and in situ precipitated (biochem-ical). For each unit, the mass of precipitated MgO and CaO car-bonates have been quantified (details in Fourmont et al., 2009), (1) from MgO and precipitated dolomite contents in sediments determined from geochemical analyse and SEM observation, respectively, (2) by comparing CaO contents in sediment and catchment soils for each period. From this investigation, the uncertainty in determination of SSY and DSY values can be evaluated to ± 20%.
Pollen study
Pollen analysis (pollens data used for the chronological model of Fourmont et al., 2009) was carried out on samples collected by increments of 3 cm in P core performed with Russian core sampler in the northern basin (Figure 4B). After eliminating carbonate and siliceous components of sediments, pollen grains were concentrated with ‘Thoulet’ solution (d = 2) (Goeury and de Beaulieu, 1979).
A minimum of 300 pollen grains were identified and counted in each sample. To make it easier to interpret pollen, taxa were sepa-rated into two classes: those characteristic of wetland (area in direct contact with the Sarlieve palaeolake), and those characteris-tic of the catchment. The abundance of pollen grains was calcu-lated as a percentage of each class and analysed separately. Chenopodiaceae, which are not strictly related to either class, and Tertiary taxa were calculated as a percentage of the whole pollen grains. Data on non-pollinic microfossils studied on P core were taken from Argant and Lopez Saez (2004).
Historical study and archaeological survey
The history of human settlement was investigated through exhaus-tive bibliographical study of the nine districts in the catchment. Five systematic archaeological field surveys, with intervals of 10 m and sampling of the whole archaeological material on each site, were performed between 2001 and 2003, in accessible areas with no buildings, representing 40% of the whole catchment area (Trément et al., 2007b; Figure 4A). Four spatial archaeological units were identified for different periods: (1) site, which has a
L’Artière L’Auz on Plateau de Gergovie 350-400 400-450 450-500 500-550 550-600 600-650 650-700 700-750 Elevation < 350 D A O F. T rÈment Sarliève paleolake Puy de Bane “G ra nd e ras e” < 100 100 - 150 150 - 200 200 - 250 non-destructive core drilling
(S) (UMR CNRS 6113)
archaeological survey area
Gachon core (1963) P core for palynology
catchment limits elevation curves (m) cross-sections (see Fig.2A, B)
pit section for archaeological survey (INRAP)
static penetrometry survey by Fondasol
N
0 km 1N
N
A75 D212 D137 A75 D212 D137B
A
C
350 m 350 m 370 m 390 m 370 m 350 m 350 m 370 m 390 m 370 m S23 S15 S11 S3 catchment limit A75 highw ay 0 km 1 0 km 1 electrical soundings electromagnetic profiles (EM31) limit of electromagnetic prospecting survey Conductivity (mS/m): PFigure 4. Location of surveys. (A) Archaeological survey area in whole catchment; (B) location of core drillings, pit section for archaeological
concentration of artefacts providing evidence of human activity at a precise place, (2) probable site, which has insufficient evidence, (3) isolated artefact, for a notable artefact, and (4) off-site pottery, representing a ‘background noise’ of scattered and often sub-rounded abundant artfacts resulting from farming-related soil enrichment. Statistical analyses of the sites interpreted as settle-ments were carried out for each period: number, distribution by elevation and total surface area. In addition, the 13 pit sections carried out by INRAP before the construction of the Grande Halle d’Auvergne (Vernet et al., 2005) were studied; they cover a sur-face area of 90 ha in the palaeolake delta zone at its eastern and western borders where there is a large site (7500 m2) (Figure 4B).
Results
Catchment physiography
Catchment slope gradients vary from about 0° in the Sarliève depression to 49° on the eastern side of the ‘Plateau de Gergovie’ (Figure 5A). Slope gradients are lower than 2° on 40% of the catch-ment area and above 8° on about 20%. Percentages of main rock-outcrop surfaces are shown in Figure 5B: carbonated rocks cover about 75% of the catchment in low to medium slope gradient areas.
Sediment yield (SY)
Rates of total (TSY), solid (SSY) and dissolved (DSY) sediment yields, and data for their calculation are shown in Figure 6A,B,C and in Tables 1 and 2, respectively. During the Lateglacial and Holocene, SSY and DSY varied from 6 to 203 t/km2 per yr and from 4 to 44
t/km2 per yr,respectively. Nine sediment yield phases (SYp1 to SYp9)
were identified. During the Bölling and at the beginning of the Alleröd (SYp1), SSY (19 t/km2 per yr) and DSY (8 t/km2 per yr) rates were
low. During the second part of the Alleröd and the younger Dryas (SYp2), SSY (65 t/km2 per yr) and DSY (31 t/km2 per yr) increased
significantly. During the Preboreal and at the beginning of the Bölling (SYp3), SSY decreased slightly (52 to 46 t/km2 per yr), while DSY did
not vary. The lowest SY rates appeared during the Bölling and at the beginning of the Atlantic (SYp4): SSY decreased from 11 to 6 t/km2
per yr, while DSY increased from 4 to 9 t/km2 per yr. During the
Atlantic and at the beginning of the sub-Boreal (SYp5), there was considerable variation between SSY and DSY rates (24 to 55 t/km2 per
yr and 37 to 6 t/km2 per yr, respectively): SSY and DSY increased
alternately during this period, with a general pattern of SSY increase and DSY decrease. During the sub-Boreal and at the beginning of the sub-Atlantic (SYp6), SSY increased considerably (161 t/km2 per yr),
and DSY rose to 40 t/km2 per yr. The SY rate for the period between
2300 and 1800 yr cal. BP (SYp7) could not be calculated as there were no stored sediments due to lake-water drainage at this time. SY rates were highest during the sub-Atlantic from 1800 to 300 yr cal. BP (SYp8), up to 203 t/km2 per yr between 1600 and 300 yr cal. BP
(SYp8b) for SSY, and 44 t/km2 per yr for DSY. SY could not be
evalu-ated for the period after 300 yr cal. BP because of the lake drying up. SSY was generally greater than DSY, except at the end of SYp4 and the beginning of SYp5. The DSY/SSY ratio (Figure 6D) remained close to 0.5 with a slight increase (0.42 to 0.67) between SYp1 and SYp3. This ratio increased sharply to 1.54 during SYp4 (beginning of the Atlantic), then decreased with variations to 0.11 at the end of SYp5. After that, the DSY/SSY ratio did not vary significantly, remaining around 0.25 during SYp6 and SYp8.
Palynology
Palynological data obtained from study of the P core concern B3 to B6 lithological units (Atlantic to late sub-Atlantic). The taxa, described in detail in Argant and Lopez Saez (2004), are presented in this paper in two environments: catchment and wetland (Figure 7). This made it possible to investigate the relationship between SY rates and plant cover during anthropogenic impact periods (Ep5 to Ep8). These elements further Gachon’s data (1963) on vegetation in the Sarliève area for the whole Holocene and are in line with Prat’s data (2006) for the sub-Boreal and sub-Atlantic.
Catchment plant cover (Figure 7A) was dominated by forest (50–85% of arboreal pollen) up to the end of the sub-Boreal. During the Atlantic, Quercus and Corylus dominated (pollinic zones a, b and c) with Ulmus and Tilia; during periods of reduced arboreal pollen grains, Corylus decreased more than Quercus. After that, Fagus and Abies appeared (zone d) and developed during the sub-Boreal (zones e, f, g and h), mainly to the detriment of Corylus. At the beginning of the sub-Atlantic there was a sharp decline of forest taxa (always lower than 40%: zones i and j), dominated by Pinus. Poaceae were always present (5 to 20% of pollen grains in the catchment), but dominated (up to about 50%) only in zone i, at the beginning of the sub-Atlantic. Ruderals (Plantago, Artemisia, Centaurea, Cichorioideae, Asteraceae, Polygonum, Lamiaceae, Apiaceae), except Chenopodiaceae, were found from the beginning of the Atlantic (zone a); they were temporarily more abundant in zone c with a marked increase at the sub-Atlantic (up to 45% in
Sarlièvepaleolake sediments
Surficial formations Catchment (2)
Slope surface area (as %)
Outcrop surfaces area (as %)
Mean slope gradient(in°) Slope-gradient classes (in°)
Cumulated slope surface area (as %)
Bed-rock formations
Fluvial sedimentsBasalt-richslope sediments Carbonate-rich slope sedimentsMiocene basaltsMiocene detrital sedimentsOligocene volcano- sedimentary formationsOligocene limestones and marls A 50 40 30 20 10 0 25 20 50 55 60 65 17.4 15 10 5 0 25 20 15 10 5 0 0-2 3-4 5-7 8-10 11-13 14-16 17-19 20-24 25-30 31-49 100 80 60 40 20 0 B 14.8 6.8 67.7 3.1 0.2 2.4 5.0 Paleolake (1)
Figure 5. Physiographical data of Sarliève catchment. (A) Catchment
slope gradients. (B) Lithology and mean slope gradients by lithological area. (1) lithology as per cent of whole catchment area (29 km2); (2) lithology as % of sediment-yielding catchment area (24 km2)
zone j). Cereals, not observed in pollinic zone a, appeared as traces in zone b and remained present, with pollen-grain contents tempo-rarily higher during the sub-Boreal in zones e and f and up to about 20% of catchment taxa in zone j.
Wetland vegetation (palaeolake edge) was also characterized by the predominance of arboreal taxa (mainly Alnus, with Fraxinus and Salix) during the Atlantic and sub-Boreal (Figure 7D), with greater and more frequent variations in the abundance of arboreal taxa during the Atlantic (30–80% arboreal pollen grains domi-nated by Fraxinus: zones a to d) than during the sub-Boreal (55 to 85%, dominated by Alnus: zones e, f and g). Arboreal taxa decreased sharply at the end of this period (5%, bottom of zone i). During the sub-Atlantic, arboreal taxa first increased (up to 50%, zone i), then decreased sharply (5–20%, zone j). Areas without forest were mainly covered by Cyperaceae which were particu-larly abundant at the end of the sub-Boreal (zone h) and at the beginning of the sub-Atlantic (zone i). Aquatics sometimes appear.
Chenopodiaceae (Figure 7C) were always present, but more abundant at the beginning of the Atlantic (zone a: up to 15% of total pollen grains), temporarily during the sub-Boreal (zones f and h) and sub-Atlantic (zones i and j). Tertiary taxa (mainly Gymnosperma) were always present (Figure 7B), often forming 10% of total pollen grains, particularly during periods of catch-ment arboreal taxa decrease, but they were as high as 90% in pollinic zone e at the beginning of the sub-Boreal.
Archaeology
Surface archaeological survey results have been described in detail by Trément et al. (2007b). They are summarized in Figures 8 and 9. Evidence for the Neolithic is found in 21 sites (S), 7 probable sites (PS) and 12 isolated artefacts (IA) observed on the land
surface within the Sarliève catchment (Figure 8A). Evidence for the early Neolithic (Recent Cardial) has been found, although poor, while evidence for the late/final Neolithic, difficult to identify, is sparse and mainly located in high elevation areas. Evidence of the middle Chassean Neolithic dominates (17S, 3PS and 5IA), mainly located on slopes of the Plateau de Gergovie on the west and slopes of the Puy d’Anzelle and Puy de Bane on the east of the catchment.
There is particularly abundant evidence of the ancient Bronze Age (14S, 6PS and 1IA), especially on the Plateau de Gergovie and Puy d’Anzelle slopes, and always at an elevation above 360 m (Figure 8B). There is some evidence of the middle Bronze Age (5S, 1PS and 1IA) at the same location as evidence of the ancient Bronze Age and above 370 m. There is abundant evidence of the final Bronze Age (10S, 3PS, 1IA) and 1 funerary site (FS); they are mainly located on western and eastern catchment slopes, and the funerary site is the first evidence of human settlement in the Sarliève depression at an elevation of 346 m.
Evidence of the first Iron Age is very abundant (17S, 7PS), mainly on slopes, from the eighth century bc. This evidence is not
found on the plateau, but in areas close to the palaeolake. There is only a little evidence of the ancient and middle La Tène (fifth–third centuries bc) (7S, 4PS, 1IA and 3FS), mainly found at low elevation
(387 m on average). Human pressure increased sharply during the final La Tène (second–first centuries bc) (Figures 8C and 9): 24S,
15PS and 2FS, especially at lower elevations (53% of evidence is found below 350 m), at the edge of the eastern alluvial terrace close to the palaeolake and in the northern outlet area, although the whole catchment was settled by humans at that time. Off-site pottery resulting from farming-related soil enrichment is closely associated with sites. Land parcels with boundary markings and drainage ditches, dating from the second half of the first century bc, have
been discovered at the bottom of the lacustrine depression.
Solid sediment yield (SSY in t.km−2.yr−1) Total sediment yield
(TSY in t.km−2.yr−1) Dissolved sediment yield (DSY in t.km−2.yr−1) Ratio dissolved/solid sediment yield Böl Al Pb Bo At Sb Sa Y D 2000 1000 0 4000 5000 6000 7000 8000 9000 10000 11000 12000 13000 14000 15000 3000 0 50 50 100 100 27 96 83 77 15 61 201 222 247 150 150 200 250 250 200 0 50 0 0.5 1 1.5
A
SY phases Chronozones Dates (yrs cal BP)SYp1 SYp2 SYp3 a b SYp4 SYp5 SYp6 SYp7 SYp8 SYp9 a b
B
C
D
? ? ? ? ? ?Figure 6. Rates of sediment yield (SY) during the Lateglacial and Holocene in Sarliève catchment. Chronozones from Boivin et al. (2004).
The early Roman Empire (first–second centuries ad) is
characterized by a sharp increase in signs of settlement (57S, 31PS and 11FS) throughout the catchment (hilltops, slopes, edge and bottom of lacustrine depression); mean elevation of sites is low: 390 m. The off-site pottery area is widespread. Sites were either vast agricultural domains (or villae) (Trément, 2007b), or buildings belonging to the villae, or small farms. During the late Roman Empire (third–fifth centuries ad) (Figures 8D and 9), only
17 of the former 57 sites remained, mainly located at the edge of the palaeolake (mean elevation: 383 m), in the same place as the main early Roman Empire buildings (villae).
During the early Middle Ages, settlements were still few (5S, 4PS, 2IA and 2FS) and always located at very low elevations (mean: 351 m): slopes and plateaus seem to have been deserted. The off-site pottery area was also less extensive than during the early Roman Empire. Four of the five sites were occupied con-tinuously from the final La Tène and became vast seigniorial domains during the Middle Ages.
Archaeological excavations carried out before the construction of the ‘Grande Halle d’Auvergne’ (Vernet et al., 2005; Trément et al., 2007b) discovered a funerary site with a tumulus dating from the final Bronze Age and extensive settlement between the third century bc and second century ad at the northeastern edge of
the palaeolake. During the La Tène period, settlement, comprising workshops, wells and burial places, was highly structured with enclosures and drainage networks. There is evidence of human activity (wells, parcels with boundary marking) on the northern lacustrine depression bottom at the time of the Roman conquest (Gergovia battle: 52 yr bc) and during the early Roman Empire
(buildings, collection of spring water, funerary sites) up to the third century ad. Evidence of fisheries dating back to the Middle
Ages and Modern Times have also been found.
Discussion
Significance of rates and phases of
sediment yield
Calculated TSY, SSY and DSY rates are averages for the whole sediment yield surface area (27.3 to 23.8 km2 according to period,
Table 1). In the catchment, spatial distribution of SY varied according to earth surface conditions, particularly slope gradient (0–49°) and lithology (dominance of basalt or limestone and marl) (Figure 5). Moreover, SY rates are averages of SY phases whose duration depends on datation possibility and during which SY could vary due to catastrophic climatic events when retention rates of particles in the lake might have been low (Brune, 1953). Nine sediment yield phases (SYp1 to SYp9) were identified covering the main chronozones of the Lateglacial and Holocene (Figure 6).
Calculated SSY rates (Figure 6B) are minimum rates which can be considered close to true rates because many factors are favourable to high palaeolake-trap efficiency (Heineman, 1984; Einsele and Hinderer, 1998): high lake/catchment area ratio (aver-age of 0.16), lake often closed or shallow when open, lake water rich in Ca2+ and Mg2+ favouring clay flocculation, and inflow
mainly due to runoff with no river. During the Lateglacial and early and middle Holocene (SYp1 to 5), endorheism is shown in basin sediments by abundance of minerals (analcite, dolomite, aragonite) resulting from chemical or biochemical precipitation in salty water. Particle retention in the palaeolake was favoured by
T
able 1.
Data for sediment yield calculation, and rates of solid and dissolved sediment yield per lacustrine sediment unit. (1) Sediment
yield; (2) dissolved sediment yield; (3) solid sediment yield
Sediment units Age Deposition Precipitated Detrital V olume (10 6 m 3 ) V olumetric Mass (10 6 t) SY (1) surface DSY (2) SSY (3) (kyr cal. BP) duration (yr) components (%) components (%) mass (t/m 3) area (km 2) (t/km 2 per yr) (t/km 2 per yr) delta basin D8 1.6–0.3 1300 0 100 0.516 1.5 0.773 23.8 0 25 D6 +D7 B5+B6 1.8–0.3 1500 20 80 4.083 2 8.165 24.5 44 178 D5 B4 5.3–2.3 3000 20 80 8.56 1.75 14.98 24.9 40 160 D4 5.3–2.3 3000 0 100 0.025 1.5 0.038 24.9 0 0.5 B3 7.5–5.3 2200 < 10 to 60 40 to > 90 4.61 0.75 3.457 25.6 6.1(21.5)36.8 24 .6 (3 9. 9) 55 .3 (very variable) (very variable) B2 9.8–7.5 2300 30 to 60 70 to 40 0.937 1 0.937 26.6 4.6(6.9)9.2 6.1(8.4)10.7 (from bottom (from bottom to top) to top) D3 11.5–10.4 ? 1100 ? 0 100 0.102 1.5 0.153 24.9 0 6 B1 13.7–9.8 3900 40 60 0.862 0.95 0.819 27.3 31 46 T1 +D2 13.7–1 1.5 2200 0 100 0.676 1.5 1.014 24.9 0 19 D1 15.0 ?–13.7 1300 ? 30 70 0.526 1.75 0.921 25.8 8 19
endorheic conditions (Einsele and Hinderer, 1998) which were continuous until the beginning of the Atlantic and then intermit-tent until the beginning of the sub-Boreal (Bréhéret et al., 2003, 2008; Fourmont et al., 2006). During the late Holocene (SYp6 and 8),
the fact that only precipitated low-Mg calcite is found in sediments is the consequence of open conditions – an extensive freshwater lake with fluctuating water level, as shown by non-pollinic micro-fossils (Argant and Lopez-Saez, 2004), and probable frequent 0 100 200 300 50 100 0 0 50 100 0 50 100%
A
B
D
Sediment units Depth(in cm) Catchment vegetation
30 0
C
Chenopodiaceae 7750 yrs cal BP Wetland vegetationTertiary taxa Local pollinic
zones Chronoz ones SY phases sub-Atlantic sub-Boreal Atlanti c j 8 6 5 i h f g e d c b a B6 B5 B4 B3 trees trees Poaceae ruderals cereals aquatics Cyperaceae and paludals
Figure 7. Pollen diagrams from P core (location, see Figure 4B). (A) Catchment vegetation as per cent of total catchment taxa. Trees: Corylus,
Quercus, Ulmus, Tilia, Betula, Fagus, Abies, Juniperus, Hedera, Acer, Picea, Pinus. Ruderals (except Chenopodiaceae): Artemisia, Asteraceae, Carduus, Centaurea, Cuscuta, Brassicaceae, Cichorioideae, Convolvulaceae, Caryophyllaceae, Malvaceae, Apiaceae, Plantago, Rumex, Rubiaceae, Fabaceae, Lamiaceae, Urticaceae, Polygonum. (B) Tertiary taxa as per cent of total pollen grains. (C) Chenopodiaceae as per cent
of total pollen grains. (D) Wetland vegetation as per cent of total wetland taxa. Trees: Alnus, Salix, Fraxinus, Ligustrum, Viburnum, Myrica,
Sambucus, Vitis. Cyperaceae and paludals: Filipendula, Thalictrum, Typhaceae. Aquatics: Potamogeton, Lemna
Table 2. Rates of solid and dissolved sediment yield per sediment yield (SY) phase. (1) Dissolved sediment yield; (2) solid sediment yield;
(3) total sediment yield
SY phases Ages (kyr cal. BP) Sediment units DSY (1) (t/km2 per yr) SSY (2) (t/km2 per yr) TSY (3) (t/km2 per yr) DSY/SSY ratio
SYp9 0–0.3 no sediments ? ? ? ? SYp8 b 0.3–1.6 D6+D7+D8+B5+B6 44 203 247 0.22 a 1.6–1.8 D6+D7+B5+B6 44 178 222 0.25 SYp7 1.8–2.3 no sediments ? ? ? ? SYp6 2.3–5.3 D4+D5+B4 40 161 201 0.25 SYp5 5.3–5.5 B3 6 55 61 0.11 5.5–7.5 B3 37 24 61 1.54 SYp4 7.5–8.2 B2 9 6 15 1.50 8.2–9.8 B2 4 11 15 0.36 SYp3 b 9.8–10.4 B1 31 46 77 0.67 a 10.4–11.5 D3+B1 31 52 83 0.60 SYp2 11.5–13.7 T1+D2+B1 31 65 96 0.48 SYp1 13.7–15.0 D1 8 19 27 0.42
outflow and loss of solid matter downstream of the lake during highstand periods. Although sediment storage increased markedly at this time (Table 1), SY may be slightly underestimated. Very
abundant slope formations (74.5% of catchment area: Figure 5B) are mainly due to periglacial processes (rock fall, solifluxion: Jeambrun et al., 1973) and thus prior to lake formation. Colluvium
Site Probable site Isolated artefact
Early Middle Ages:
Funerary site Site Probable site
Late Roman Empire:
Funerary site Large villa Small villa
Roman road Off-site pottery
Off-site pottery
F. TrÈment
Site Probable site
Isolated artefact Roman road
Early Roman Empire:
Site
Agglomeration Probable site
Final La Tène:
Funerary site
Funerary site Sanctuary
Large villa
Small villa Large villa with Final La Tène tracesSmall villa with Final La Tène traces
F. TrÈment
Site Probable site Isolated artefact Site Probable site Isolated artefact
Ancient and Middle Bronze Ages:
Final Bronze Ages until Ancient La Tène:
Funerary site F. TrÈment L'Artière L'Artière L'Artière L'Auzon L'Auzon L'Auzon
Site Probable site Isolated artefact
Ancient Neolithic: Middle Neolithic:
Probable site
Plateau de
Gergovie Plateau de Gergovie
Plateau de Gergovie L'Artière L'Auzon Plateau de Gergovie 350-400 400-450 450-500 500-550 550-600 600-650 650-700 700-750 Elevation < 350 350-400 400-450 450-500 500-550 550-600 600-650 650-700 700-750 Elevation < 350 350-400 400-450 450-500 500-550 550-600 600-650 650-700 700-750 Elevation < 350 350-400 400-450 450-500 500-550 550-600 600-650 650-700 700-750 < 350 F. TrÈment 0 km 1 0 km 1 0 km 1 0 km 1 Elevation
A
C
D
B
Sarliève paleolake Sarliève paleolake Sarliève paleolake Puy de Bane Puy de Bane Puy de Banecatchment limit catchment limit
catchment limit Sarliève paleolake Puy de Bane catchment limit
Figure 8. Location maps of human settlements in Sarliève catchment at different periods. (A) Ancient and middle Neolithic; (B) Bronze Ages up
rich in organic matter containing archaeological artefacts (Vernet et al., 2005) and clearly the result of Holocene soil erosion, is mainly located on the edge of the palaeolake. As it is not wide-spread in the catchment, it was not quantified.
Evaluating real DSY rates is difficult because of high discharge of dissolved matter downstream of the lake during high-water periods (Fourmont et al., 2009). DSY rates during the Lateglacial and early Holocene (SYp1 to SYp4) are probably close to gross rates resulting from the endorheic conditions of the palaeolake (Einsele and Hinderer, 1998). During the middle and particularly the late Holocene, because the basin was open more often, first for
short periods (SYp5), then more continuously (SYp6 and 8) when the palaeolake spread out and detritism increased, DSY rates are probably grossly underestimated, although they were high during the sub-Boreal and sub-Atlantic (Figure 6C).
The Sarliève catchment is located in medium-sized mountains where slope gradients are low (< 5° for 60% of the catchment area; Figure 5) and carbonated rocks dominate (about 75% of the area; Figure 1B). SSY and DSY rates for the most recent period (178 to 203 and 44 t/km2 per yr,respectively for SYp8) are a little higher
than those assessed from current river flux (Meybeck, 1979; Milliman and Meade, 1983) and as high as soil erosion rates (Cerdan et al., 2006) in similar physiographic and bioclimatic environments. Nevertheless, because of the climate characteristics of the Sarliève environment, lower rates could be expected. This suggests that SY rates calculated from Sarliève sediment stores, although minimum, are quite close to gross erosion rates.
Sediment yield is mainly related to soil erosion. Assuming that the mean volumetric mass of eroded soils is 2 g/cm3, it is possible to
converted the sediment yield (in t/km2 per yr) in catchment-soil
ero-sion rates (in mm/yr). During SYp1 to 5 as there is no colluvium of this time on slopes and SY calculated values are close to true sedi-ment flux values, we assumed that SY rates correspond to erosion rates. During SYp6 and 8, because of colluvium stores on slopes and matter delivery downstream the lake, erosion rates deduced from SSY rates are evidently underestimated, especially DSY.
During the Lateglacial and Holocene, TSY, SSY and DSY varied greatly (Figure 6). Examination of archaeological and paly-nological data provides clear indication of two periods in the evolution of the palaeoenvironment: the first before 7500 yr cal. BP during which SY was due only to natural bioclimatic condi-tions (SYp1 to 4), and the second, after this date, during which SY was also due to human impact (SYp5 to 9).
Sediment yield evolution before
evidence of human impact
(Lateglacial and early Holocene)
While there is evidence of human settlement in the Sarliève catch-ment prior to the Neolithic, it is sparse (Pomel, 1853; Pommerol, 1877; Trément et al., 2007b). Palynological data show no evidence of farming before the Atlantic (Gachon, 1963): cereals only appear in pollinic zone b (Figure 7A). Although ruderals were present from the beginning of the Atlantic, it is likely that variations in vegetation and hydrological processes influencing erosion prior to about 7500 yr cal. BP were only due to natural processes and cli-mate change. During the Lateglacial and early Holocene, TSY was lower (mean 55 t/km2 per yr) than subsequently, but variable
(Figures 6A and 10): from 6 to 65 t/km2 per yrfor SSY and 4 to 31
t/km2 per yrfor DSY, with a DSY/SSY ratio of about 0.5. Sediment yield phase 1 (SYp1)
During SYp1 (Bölling and beginning of the Alleröd), very low SSY and DSY rates could be due to the first postglacial develop-ment of arboreal cover with Juniperus and Betula (de Beaulieu et al., 1988) which limited mechanical and chemical erosion during a cool period (Johnsen et al., 1992 ).
Sediment yield phase 2 (SYp2)
Increased SSY (65 t/km2 per yr) during the Alleröd at 13 700 yr cal.
BP, despite the continuation of previous bioclimatic conditions,
0 10 20 30 40 50 60
site probable site funeraire isolated discovery
A
B
0 20 40 60 80 100 300 350 400 450 % m ha elevation (m) mean elevation (m) m-Neolithice-Neolithic l-Neolithice-Bronzem-Bronzel-Bronze e-Iron
e-La Tènem-La Tènel-La Tènee-Empirel-Empire e-Middle Agesl-Middle Ages
m-Neolithic
e-Neolithic l-Neolithice-Bronzem-Bronzel-Bronze e-Iron
e-La Tènem-La Tènel-La Tènee-Empirel-Empire e-Middle Agesl-Middle Ages m-Neolithicl-Neolithice-Bronzem-Bronzel-Bronze
e-Iron
e-La Tènem-La Tènel-La Tènee-Empirel-Empire e-Middle Agesl-Middle Ages
0 10 20 30 40 50
scattered sites total sites
C
>500 400-500 350-400 <350
Figure 9. Stastistics of archaeological sites by period. e, early;
m, middle; l, late. (A) Site numbers; (B) abundance of sites as per cent of elevation class, and mean elevation of sites in metres; (C) cumulated surface area of sites in ha
seems to be due to CF1 tephra fallout, with a mean depth of 15 cm (Vernet and Raynal, 2000). Tephric cover could have favoured mechanical erosion over several decades or centuries (Figure 10G) because of the temporary destruction of vegetation dominated by Betula and Pinus on slopes (de Beaulieu et al., 1988), but mainly because of the high susceptibility of tephra to mechanical erosion (Chorley et al., 1984; Collins and Dunne, 1986). Likewise, increased DSY (31 t/km2 per yr) can be explained by high
suscep-tibility to dissolution of tephra silicates, mainly glass (Fourmont et al., 2006). These higher SSY and DSY rates continued during the Younger Dryas up to about 11 500 yr cal. BP, although tephric cover had probably been completely eroded by that time; Tertiary pollen-grain abundance in lacustrine sediments (Gachon, 1963) shows that mechanical erosion mainly cut into the Oligocene bed-rock. During the cold and dry Younger Dryas (Peteet, 1995; Anderson, 1997) (Figure 10M) mechanical erosion was favoured by tundra (de Beaulieu et al., 1988), which does not provide effi-cient protection of the earth surface against erosion, as observed in the Lac Chambon catchment located in a granitic and volcanic area close to the Sarliève catchment (Macaire et al., 1995, 1997). Nevertheless, high DSY indicates that the climate was fairly humid, and the dissolution of carbonated rocks could have been favoured by the cold climate.
Sediment yield phase 3 (SYp3)
At the beginning of the Holocene, between 11 500 yr cal. BP and 9800 yr cal. BP, SSY and DSY remained high, although the former fell to 46 t/km2 per yr (Ep3b). At this time, forest developed,
dominated first by Corylus and then Quercus and Ulmus (Gachon, 1963; de Beaulieu et al., 1988), and the climate became warmer
(Johnsen et al., 2001; Davis et al., 2003) (Figure 10K,M). Gachon (1963) suggested that the abundance of Chenopodiaceae pollen grains in Sarliève sediments during the Lateglacial and early Holocene could have been due to slope-mass movement by soli-fluction, which could have contributed to the development of these pioneering taxa. The abundance of Chenopodiaceae at the begin-ning of the Atlantic (zone a, Figure 7C), when SSY was very low (6 t/km2 per yr), indicates that there is no relationship between the
abundance of this taxa and the intensity of mechanical erosion. On the other hand, Chenopodiaceae could have colonized the bottom of the lacustrine depression during drought periods, providing evidence of the presence of salt water as shown elsewhere by Valero-Garcés et al. (2000). Salt, also testified by precipitated minerals in B1 to B3 lacustrine units (Fourmont et al., 2006; Bréhéret et al., 2008), was produced by dissolution of gypsum forming a small part of Oligocene limestones and marls (Jeambrun et al., 1973). Dissolution of catchment bedrock gypsum and calcite during SYp3 could indicate the beginning of pedogenesis during the early Holocene and is in accordance with a relatively high value of DSY (31 t/km2 per yr). However, it was not possible to
evaluate precisely the evolution of DSY rates from SYp2 to SYp3. Sediment yield phase 4 (SYp4)
During the Boreal and the Atlantic before 7500 yr cal. BP, erosion rates, much lower than before and similar to SYp1, did not change significantly (SSY = 6 to 11 t/km2 per yrand DSY = 4 to 9 t/km2
per yr), although the DSY/SSY ratio increased (0.36 to 1.50; Figure 6D). This trend could be explained by extensive develop-ment of forest cover, dominated by Corylus and Quercus (de Beaulieu et al., 1988; Gachon, 1963), related to climate warming
A B C D E F G H I J K L M
Solid
Sediment yield rates Chronology Catchment surface Climate
characteristics Dissolved 2000 1000 0 4000 5000 6000 7000 8000 9000 10000 11000 12000 13000 14000 15000 3000 0 50 0.11 10 100 −8 −6−4 0°C +2°C 0 0 50 100 0 20 40 0 20 40 –2 –4 100 150 200 0 50 SYp1 SYp2 SYp3 a b SYp4 SYp5 SYp6 SYp7 SYp8 SYp9 a b SY phases Chronozones Ages
(yrs cal BP) Lithology Tertiary
and non-arboreal vegetation Site surface Archaeological phases sub-Boreal
mainly carbonated rocks
tephr a sub-Atlantic Atlantic Neolithic Tertiary
taxa Poaceae Ruderalsand cerals
Bronze Iron Emp Boreal Pre boreal Bölling- Allerö d Middle- Ages Yr . Dryas ha.10–2 yrs wet dry t.km−2.yr−1 t.km−2.yr−1 δ18O (‰)
Figure 10. Comparison of sediment yield rates, chronology, catchment area characteristics and climate. (D) Ages in yr cal. BP; (H) tertiary taxa
as per cent of total pollen grains; Poaceae, and ruderals and cereals as per cent of catchment-taxa pollen-grains; (J) temperature from Greenland ice-core (Johnsen et al., 2001); (K) temperature from pollen data (Davis et al., 2003); (L) humidity from bog (Barber et al., 1994); (M) temperature from lake record (von Grafenstein et al., 1999)
(Figure 10K,M), which provided efficient protection of the earth surface against mechanical erosion. Higher temperatures and less precipitation during the Boreal, testified in western Europe (Andrews, 2006) with minimum temperatures and dryness at about 8200 yr cal. BP in the Northern Hemisphere (Carrion, 2002; Alley and Agustsdottir, 2005; Macklin et al., 2006), may have been more marked in the drier microclimate of Sarliève and could explain the low absolute value of DSY. Nevertheless, the sharp rise of the DSY/SSY ratio at this period, marked by catchment-slope stability, indicates a matter budget promoting an increase in soil depth.
Sediment yield evolution during periods of
human impact (middle and late Holocene)
TSY increased dramatically after 7500 yr cal. BP (average for SYp5, SYp6 and SYp8: 165 t/km2 per yr): from 24 to 232 t/km2 per
yrfor SSY and from 6 to 44 t/km2 per yrfor DSY. The DSY/SSY
ratio decreased to close to 0.25, with considerable fluctuations during the Atlantic (SYp5) (Figure 6). This rise in sediment yield rate appeared concomitantly with the growth of human settlement in the Sarliève catchment (Figure 10I). Pottery dated from the end of the Ancient Neolithic, although scarce (two probable sites), provides evidence of human activity in the catchment; similar activity has also been observed in many places around Clermont-Ferrand from 7500 yr cal. BP (Georjon et al., 2004; Pouenat, 2007). Human activity increased considerably after that period, with some fluctuations (Figures 8 and 9). Evidence of ruderals (zone a, Figure7A) and cereals (zone b, Figure 7A) from the beginning of the Atlantic show that vegetation and earth surface conditions were modified by human activities from about 7500 yr BP. Human activity and climate together influenced erosion processes and intensity (Figure 10H–L).
Sediment yield phase 5 (SYp5)
From the Atlantic after 7500 yr cal. BP to the beginning of the sub-Boreal at about 5300 yr cal. BP, sharp TSY increase (61 t/km2
per yr) is characterized by strong variations in DSY/SSY ratio. Marked SSY increase (by a factor of nine maximum relative to SYp4) together with lower variation in DSY (increase by a factor of four maximum) is an indication of human impact (Dearing and Jones, 2003), although climate became a little more humid than before. SYp5 corresponds to the development of the Neolithic society and arable farming in the Massif Central (Georjon et al., 2004), particularly widespread in the Sarliève catchment during the Chassean Middle Neolithic (Figures 8A, 9A). Evidence of farming is provided by cereal pollen grains (Figure 7A). Farming seems to have occurred mainly at elevations of 350 to 500 m (average 400–450 m, Figure 9B) where ancient and middle Neolithic sites cover a total area of about 13 ha (Figure 9C), cor-responding to a mean time-weighted settlement area of 0.65 ha per century (Figure 10I). It is difficult to explain high variations of arboreal pollen grain contents in slope vegetation during the Atlantic (zones a, b and c Figure 7A) by climate change, which, although not marked, did occur (Aaby, 1976; Bond et al., 2001; Douglas et al., 2007). On the other hand, a sharp increase in ruder-als (Figure 7A) and preferential decrease in Corylus (Figure 11B), which is more easily cut than Quercus (Figure 11A), during peri-ods of slope arboreal pollen regression, could indicate human impact on deforestation. This seems to be confirmed by frequent
simultaneity between periods of deforestation and periods of high Tertiary pollen grain content (Figure 7B) and detrital layer deposi-tion (HCS facies in B3), indicating increased mechanical erosion. In the lacustrine depression during SYp5, a marked variation of arboreal pollen contents (mainly Alnus) compared to Cyperaceae and paludals (Figure 7D), appears to be related to an alternation of biochemical dominated BL facies and low water level in the pal-aeolake on the one hand, and detrital dominated HCS facies and high water level observed in lacustrine sediments on the other (Fourmont et al., 2009). Non-pollinic microfossils indicate the occurrence of livestock farming as early as pollinic zone c, which could explain the mesotrophic to eutrophic character of the pal-aeolake waters (Argant and Lopez-Saez, 2004). These marked variations in vegetation, hydrology and sediment supply in the lacustrine depression are similar to variations in the catchment vegetation. Low water level in the lake could be the result of increased evapotranspiration during afforestation in the catch-ment, and high water level due to increased runoff during defores-tation. However, the relative impacts of climate versus human activity on hydrology and sediment yield are not yet clear because of the marked variability of sedimentary facies in unit B3. High resolution multiproxy analysis (at a centimetric scale) of this unit is in progress.
Sediment yield phase 6 (SYp6)
From the sub-Boreal after 5300 yr cal. BP up to 2300 yr cal. BP in the sub-Atlantic, increased TSY (201 t/km2 per yr) and rising
water level (Fourmont et al., 2009) are in keeping with changes in the climate which became more humid between 5200 yr cal. BP and 4500 yr cal. BP (Barber et al., 1994; Magny et al., 2006) and cooler (Johnsen et al., 2001), with greater cooling at about 2800 yr cal. BP (van Geel et al., 1998) (Figure 10J,L). Nevertheless, a greater rise in SSY and DSY during SYp6 than SYp5 (by factors of 2.9 and 6.6, respectively, Figures 6B and C) cannot be explained solely by climate change which was not marked. The rise in SSY is synchronous with increased human settlement between the end of the Neolithic and the ancient La Tène as shown by the abundance of sites, particularly during the ancient Bronze Age, final Bronze Age and first Iron Age (Figures 8B and 9A): total surface area of sites varies between archaeological periods (Figure 9C), but the mean time-weighted site area increased more during SYp6 (0.92 ha/century) than SYp5 (0.65) (Figure 10I). These sites, located at elevations between 350 and 500 m from the final Neolithic until the middle La Tène (Figure 9C), were scat-tered between 700 m and the edge of the palaeolake (< 350 m) from the final Bronze until the middle La Tène, promoting transit of solid flux from top to bottom of slopes. During SYp6, forest cover on slopes, marked by the replacement of Corylus by Fagus (zones e to h, Figure 7A) was more continuous than during SYp5. Nevertheless, several maximum cereal-pollen contents, often syn-chronous with increased Tertiary taxa and slight forest regression (Figure 7A, B), show that human impact and mechanical erosion of bedrock could have been intense during certain periods (pol-linic zone e in particular). These periods could correspond to rapid human population growth, as during the ancient Bronze Age (pol-linic zone e) and ancient Iron Age (zone g) and explain the high overall SSY value during SYp6. The palaeolake water level, which was probably higher because of the more humid climate, varied as shown by non-pollinic microfossils (Argant and Lopez-Saez, 2004). At the edge of the palaeolake, where vegetation varied