Development of high-temperature firebrick resistance-heated
energy storage (FIRES) using doped ceramic heating system
By
Daniel Christopher Stack
B.S., Mechanical Engineering (2014)
Syracuse University
S.M., Nuclear Science and Engineering (2017)
Massachusetts Institute of Technology
SUBMITTED TO THE DEPARTMENT OF NUCLEAR SCIENCE AND
ENGINEERING IN PARTIAL FULFILLMENT OF THE REQUIREMENTS
FOR THE DEGREE OF
DOCTOR OF PHILOSOPHY IN NUCLEAR SCIENCE AND ENGINEERING
AT THE
MASSACHUSETTS INSTITUTE OF TECHNOLOGY
February 2021
© Massachusetts Institute of Technology. All rights reserved.
Signature of Author:_____________________________________________________________________________ Daniel Christopher Stack Department of Nuclear Science and Engineering January 22, 2021 Certified by:___________________________________________________________________________________
Charles W. Forsberg Principal Research Scientist, Department of Nuclear Science and Engineering Thesis Supervisor Certified by:___________________________________________________________________________________
Michael P. Short Associate Professor, Department of Nuclear Science and Engineering Thesis Co-supervisor Accepted by:__________________________________________________________________________________
Ju Li Battelle Energy Alliance Professor of Nuclear Science and Engineering And Professor of Materials Science and Engineering Chairman, Department Committee on Graduate Students
2
3
Development of high-temperature firebrick resistance-heated
energy storage (FIRES) using doped ceramic heating system
By Daniel C. Stack
Submitted to the Department of Nuclear Science and Engineering on January 22, 2021 in partial fulfillment of the requirements for the degree of Doctor of Philosophy in Nuclear Science and Engineering
Abstract
Towards combating climate change, the widespread replacement of fossil fuel energy with zero-carbon energy has two main requirements: (1) the ability to reach very high temperatures using zero-carbon energy to perform a variety of continuous industrial processes, such as iron smelting and cement clinker production; (2) the ability to match electricity supply with demand. Firebrick resistance-heated energy storage (FIRES) is a previously proposed technology capable of meeting both requirements by storing zero-carbon electricity as high-temperature heat, and delivering it to industrial plants or power plants as needed in place of fossil fuels. The capability limits of FIRES is set by existing electrical heater options, which limit the temperatures and heat rates of the system.
The work herein describes the development of a novel high-temperature FIRES system using cation-doped ceramic firebricks as the basis of the electrical heating system. The firebricks are directly resistance heated (DRH), enabling peak temperatures equal to that of flame temperatures, and allowing FIRES to electrify and decarbonize the hottest industrial processes and power the highest efficiency turbines.
The fundamentals of semiconductor joule heater design were reviewed, and the material option space was evaluated. Chromia doped with nickel was identified as a promising material candidate for a DRH-style FIRES system. Commercial and doped lab-fabricated chromia samples were prepared. Electrical resistivity was measured as a function of temperature, and brick-brick contact resistivity was measured as a function of temperature and contact load, up to 1500oC, to determine viability of electrically heating a freely stacked brick mass. A proof of concept of DRH was successfully demonstrated by electrically heating a small stack of doped samples.
Calculations and simulations of brick-brick contact temperature rise, short circuit failure conditions, and thermal runaway were developed and undertaken using the experimentally measured electrical properties and the expected operating conditions of a FIRES system as inputs. Results informed the development of an electrically conductive brickwork design, including the brick dimensions and patterns of interlaid insulative and conductive firebrick to form an electrical circuit resistant to thermal runaway. The bricks and brickwork were designed with the intention of being compatible with hot blast stoves (heat regenerators) commonplace in the steel industry to provide a pathway for commercial development using existing industrial experience. Specific modifications necessary for coupling FIRES with blast furnaces, cement kilns, and gas turbines were explored.
Thesis Supervisor: Charles W. Forsberg
Title: Principal Research Scientist, Department of Nuclear Science and Engineering
Thesis Co-supervisor: Michael P. Short
4
Acknowledgements
I would like to thank Exelon Corporation for their sponsorship of this work and their commitment to developing sustainable energy solutions. A special thanks to Dr. Ugi Otgonbaatar of Exelon for our discussions of the research and the possibilities of the FIRES technology.
I would like to thank Don Abrino and HarbisonWalker International for engaging in discussions about the firebrick option space, and for providing many firebrick samples as a valuable commercial reference. Also, a special thanks to Dr. Zachary Hood, formerly of the Electrochemical Materials Lab at MIT, for a great deal of help with the doped sample fabrication process.
I would like to thank my co-advisor, Prof. Mike Short, for offering a wealth of insights, support, and enthusiasm throughout this project, especially through the highs and lows of the experimental portion.
I owe a great debt of gratitude to my advisor, Dr. Charles Forsberg, for his inspirational thinking, guidance, patience, and unwavering support over many years of research. Six years ago, I did not join the nuclear science and engineering department expecting to work on thermal energy storage; in hindsight, I cannot imagine a more fulfilling path. It has been an honor to be your student, to explore such a promising concept, and to work towards this “small” energy revolution.
Finally, thank you to all of my colleagues and friends who have entertained far too many hours of talk over the years on the topic of heating up bricks, and to my family, for their unconditional love and support that has sustained me through these years.
5
6
Table of Contents
Abstract ... 3 Acknowledgements ... 4 Table of Contents... 6 List of Figures ... 9 List of Tables ... 11 1 Introduction ... 12 2 Background ... 142.1 Electricity sector challenges ... 14
2.2 Industrial heating sector challenges ... 16
2.3 Description of firebrick resistance-heated energy storage (FIRES) ... 21
2.4 Requirements of firebrick for DRH-style FIRES ... 24
2.5 Strategy of DRH-style firebrick development ... 26
3 Joule heater fundamentals ... 26
3.1 Electrical conductivity in semiconductors ... 26
Carrier concentration ... 26
Carrier mobility ... 30
3.2 Operating range maximization of a joule heater ... 32
Ideal semiconductor joule heater properties ... 32
Exhaustion region prediction in materials: Si and SiC reference ... 33
Limitations of semiconductor theory in predicting behavior ... 37
3.3 Considerations of resistivity-temperature derivative (RTD) ... 38
4 Evaluation of oxide materials for joule heater devices ... 40
4.1 Review of candidate oxide materials ... 40
Chromium oxide (Cr2O3) ... 41
Nickel oxide (NiO) ... 41
Titanium dioxide (TiO2) ... 42
Zinc oxide (ZnO) ... 42
Aluminum oxide (Al2O3) ... 43
Magnesium oxide (MgO) ... 43
Zirconium dioxide (ZrO2) ... 44
4.2 Exhaustion region prediction in candidate oxides ... 44
4.3 Summary and material selection ... 46
5 Experimental methods ... 48
5.1 Commercial chromia firebrick methods ... 48
Room temperature testing of bulk resistance and brick-brick contact resistance ... 48
Resistivity-temperature measurements ... 50
7
Fabrication ... 53
Bulk and contact resistivity-temperature measurements ... 55
Contact resistivity-temperature measurements ... 57
5.3 Direct Resistance Heating (DRH) methods ... 58
6 Experimental results ... 60
6.1 Commercial chromia firebrick results ... 60
Variability among samples ... 60
Contact resistivity-load measurements ... 62
Resistivity-temperature measurements and cycling ... 65
Summary and lessons learned from commercial firebrick testing ... 66
6.2 Lab-fabricated chromia firebrick results ... 67
Bulk resistivity-temperature results ... 67
Contact resistivity-load-temperature results ... 68
Direct resistance heating experiment results ... 71
Findings of previous fabrication series 1, 2 and 3 ... 71
Summary of lab-fabricated chromia firebrick testing ... 73
7 Electrical contact heating and temperature rise in a DRH-style FIRES unit ... 75
7.1 Derivation... 75
7.2 Results and discussion ... 76
7.3 Summary of contact heating and temperature rise calculations ... 77
8 Short circuit instability calculations ... 79
8.1 Derivation... 79
8.2 Results and discussion ... 81
8.3 Limitations of short circuit model ... 82
8.4 Summary of short circuit instability calculations ... 82
9 Thermal runaway simulations ... 83
9.1 Methods ... 83
Cycling description ... 83
Numerical scheme ... 84
Simulation inputs ... 85
Performance metric considerations ... 86
9.2 Results ... 86
General system dynamics: 𝚫𝚫𝑻𝑻𝑻𝑻𝑻𝑻𝑻𝑻𝑻𝑻𝑻𝑻, cycling, and equilibrium ... 86
The 𝚫𝚫𝑻𝑻𝑻𝑻𝑻𝑻𝑻𝑻 ≤ 𝟏𝟏𝟏𝟏𝟏𝟏𝟏𝟏𝟏𝟏 criterion: Tradeoffs of w, 𝑻𝑻𝑻𝑻𝑻𝑻𝑻𝑻, and tequi ... 88
Limitation of results ... 89
9.3 Summary of thermal runaway simulations ... 89
10 Conceptual design of a DRH FIRES unit ... 90
10.1 Brickwork design ... 90
8
Electrode region considerations ... 94
Considerations of insulating region, conductive region, and their volume ratio ... 95
10.2 Brick geometry design ... 96
Effect of brick width on conductive width of electrical flow path ... 97
Brick height considerations ... 98
Open radiative heat transfer pathways for greater flexibility and stability ... 99
10.3 Flow control design and inlet preheating options ... 99
10.4 Summary of Conceptual design of a DRH FIRES unit ... 101
11 Retrofits and modifications to applications ... 102
11.1 Adaptation of hot blast stove designs for FIRES ... 102
11.2 Retrofit of cement kilns with FIRES ... 103
11.3 Retrofit of iron blast furnaces with FIRES ... 105
11.4 Modification of gas turbines with FIRES ... 106
11.5 Usage of FIRES in other applications ... 110
11.6 Summary of retrofits and modifications to applications ... 110
12 Conclusions ... 111
12.1 Summary of work ... 111
12.2 Future work ... 112
13 Appendix material ... 113
13.1 Tests of commercial silicon carbide samples ... 113
HARBIDE results and discussion... 113
NISIC 20 results and discussion ... 114
9
List of Figures
Figure 1: Effect of solar energy on California electrical load and wholesale electricity prices during a spring day. .. 14
Figure 2: solar curtailment and levelized cost of energy (LCOE) as a function of greater solar energy penetration. . 15
Figure 3: Average market price of energy as a function of solar power penetration. [10] ... 16
Figure 4: energy flow diagram of United States, 2018. [15] ... 17
Figure 5: global energy projections to 2050. ... 18
Figure 6: Temperature capabilities of potential zero-carbon heat sources compared to application requirements. [5] ... 19
Figure 7: Cost comparison of different heating options. [5] ... 20
Figure 8: Qualitative feasibility chart for different industrial heating options. [5] ... 21
Figure 9: Schematic of FIRES coupled with generic industrial heating application. ... 21
Figure 10: Existing basis of FIRES system. [23, 26] ... 22
Figure 11: Residential scale (left) and commercial scale (right) firebrick storage systems available today. [29, 30] . 22 Figure 12: simplified band structures of semiconductors. ... 27
Figure 13: Carrier concentration of a doped semiconductor as a function of inverse temperature. [35] ... 29
Figure 14: The effect of greater dopant on lower and upper temperature limits TL and TU of the fully exhausted extrinsic region in silicon. ... 30
Figure 15: Normalized trend of small polaron mobility with temperature. ... 32
Figure 16: Modeling of exhaustion region for Si and SiC. TL and TU of exhaustion region for p-type and n-type doping of Si and SiC at different levels, corresponding to carrier concentrations between 80% and 120% of dopant level. . 34
Figure 17: Comparison of exhaustion region criteria for N-doped SiC with Ed = 0.125eV, with exact carrier concentration overlayed. ... 35
Figure 18: Comparison of modeled resistivity and measurements of SiC. ... 36
Figure 19: Electrical resistivity versus temperature of a typical SiC heater element. ... 37
Figure 20: Characteristic thermal runaway behavior in series circuits and parallel circuits with materials of positive and negative RTD. ... 38
Figure 21: Comparison of exhaustion range of oxide candidates at different dopant concentrations. ... 45
Figure 22: Room temperature bulk and contact resistance experimental setup. ... 49
Figure 23: Platination of brick samples in evaporator. ... 50
Figure 24: resistivity-temperature measurement setup. ... 52
Figure 25: Ramp/soak cycle of commercial firebrick resistivity-temperature measurements. ... 52
Figure 26: Lab fabrication of Ni-doped chromia pellets and bricks. ... 54
Figure 27: Bulk and contact resistivity-temperature measurement setup for lab-fabricated samples. ... 56
Figure 28: platinum resistivity-temperature trend, used to calculate and subtract RPt from measurements. ... 57
Figure 29: Ramp/soak cycle of lab-fabricated firebrick resistivity-temperature measurements. ... 58
Figure 30: Experimental setup of DRH experiment. ... 59
Figure 31: Preliminary resistance measurement of five un-fired SERV® 95 DC firebrick samples as a function of load. ... 60
Figure 32: Comparison of sample resistance before and after firing in furnace for 12 hours at 1200oC. ... 61
Figure 33: Evolution of brick appearance with thermal cycling. ... 61
Figure 34: Resistance-load measurements of brick stacks “A B” compared to their summed individual measurements “A+B” before and after platination. ... 62
Figure 35: Contact resistance vs load-up and load-down of brick-brick contact of fired samples A and B, fitted with power law functions. ... 63
Figure 36: Contact resistance vs load-up and load-down of brick-brick contacts of fired samples C, D and E, fitted with power law functions... 64
Figure 37: Contact resistivity (a) and equivalent resistor length (b) as a function of load-down of fired and unfired brick stacks. ... 64
Figure 38: resistivity-temperature trends over 13 cycles of SERV® 95 DC sample A from 25oC to 1500oC. ... 65
Figure 39: Bulk resistivity-temperature behavior of 2.00% Ni-doped samples, series 4. ... 68
Figure 40: Room temperature contact resistivity-load measurements of stacked samples S4-7 and S4-8. ... 69
Figure 41: Effects of thermal cycling and loading on contact resistance in the S4 stack. ... 70
Figure 42: Direct resistance heating experiment of the S4 stack. ... 71
Figure 43: uncorrected resistivity-temperature behavior of samples from series 1 2 and 3. ... 72
10
Figure 45: Resistor model of the brickwork in FIRES. ... 75
Figure 46: a): Δ𝑇𝑇𝑇𝑇𝑇𝑇𝑇𝑇𝑇𝑇𝑇𝑇 as a function of Lb and Leq. b): resistance ratio Rb/(Rb+Rb-b) as a function of Lb and Leq. See Table 8 for inputs. ... 77
Figure 47: Checkerwork with vertical hot spots in line with electrical flow path. ... 79
Figure 48: Length scale map of short circuit stability as a function of temperature for chromia. ... 81
Figure 49: 1-D Modeling of FIRES charge cycling. ... 83
Figure 50: Bulk resistivity 𝜌𝜌𝜌𝜌 and extrapolated point to 2000oC for use in thermal runaway simulations. ... 85
Figure 51: Evolution of temperature and ∆𝑇𝑇 versus time as a function of varying Tmin and cycling. ... 88
Figure 52: high-level schematic of the DRH brickwork concept. Generic 3-phase wye configuration. ... 90
Figure 53: Resistive load configurations of delta, wye, and DC options for FIRES. ... 91
Figure 54: Six-pass delta configuration in a hexagonal brickwork. ... 92
Figure 55: Three-pass wye configuration in a hexagonal brickwork. ... 93
Figure 56: Three-pass wye configuration in a square brickwork. ... 94
Figure 57: Lateral movement of electricity through the electrode region of the brickwork. ... 95
Figure 58: Hexagonal brickwork cross-sections with different widths ratios of conductive and insulating bricks. .... 96
Figure 59: Typical checker firebrick geometries used in regenerative heat exchangers. ... 97
Figure 60: Dimensions and approximate solid conductive widths for two hexagonal brickworks. ... 98
Figure 61: Preheat options for FIRES inlet. ... 100
Figure 62: Variations of hot blast stove designs. ... 102
Figure 63: General schematic of a cement plant without (top) and with FIRES (bottom). ... 104
Figure 64: General schematic of a blast furnace without (top) and with FIRES (bottom). ... 106
Figure 65: FIRES coupled with natural gas combined cycle (NGCC) plant. Roundtrip efficiencies up to 63%. ... 107
Figure 66: FIRES coupled with reheat air-Brayton combined cycle (RACC) plant. ... 107
Figure 67: Cross section of typical gas turbine. [114] ... 108
Figure 68: A typical reverse-flow diffusion can-annular combustor. [114] ... 108
Figure 69: Interface and operating mode of FIRES with a natural gas turbine... 109
Figure 70: Platinized samples of NISIC 20 (left) and HARBIDE (right), provided by HWI. ... 113
Figure 71: Measured electrical resistance versus load of bare and platinized HARBIDE. ... 113
Figure 72: Resistivity versus temperature of HARBIDE up to 500oC over a customized ramp/soak operation. ... 114
Figure 73: NISIC 20 electrical resistance measurements and mass gain over several heating cycles. ... 115
11
List of Tables
Table 1: Typical heater operating capabilities [2] ... 23
Table 2: Attributes of ideal firebrick for DRH-style FIRES system ... 25
Table 3: property inputs of Si and SiC for carrier activation calculations ... 34
Table 4: Inputs to carrier concentration calculations as a function of temperature for candidate materials. ... 44
Table 5: properties of oxide materials of interest. ... 47
Table 6: product data of SERV®95 DC, provided by HWI ... 48
Table 7: Lab-fabricated chromia sample descriptions ... 54
Table 8: Inputs to supertemperature Δ𝑇𝑇𝑇𝑇𝑇𝑇𝑇𝑇𝑇𝑇𝑇𝑇 (38). ... 77
Table 9: Inputs of stability check calculation (47) ... 81
Table 10: Thermal runaway simulation inputs ... 85
12
1 Introduction
To mitigate the threat of climate change and transition to a more sustainable way of life, it has been acknowledged by the broader scientific community and the majority of national governments [1] that greenhouse gas emissions must be dramatically reduced. The bulk of the emissions takes the form of carbon dioxide produced by fossil fuel power plants and industrial heat processes. Decarbonization of these energy sectors poses many technological challenges, most of which may be considered in two categories: (1) the ability to reach very high temperatures using zero-carbon energy to perform a variety of continuous industrial processes, such as iron smelting and cement clinker production; (2) the need to match electricity supply with demand using variable generators (VG), particularly intermittent wind and solar electricity production. The present technology options for accomplishing these tasks are very few, and are typically either prohibitively expensive, technologically immature, unproven at scale, or limited in their application by geography. This technology shortfall necessitates the focus of researchers to address the many issues of implementing technology options beyond the laboratory, into the energy sector.
One class of technology that shows great promise for addressing both challenges above, and the focus of this work, is known as electrically-heated thermal energy storage (E-TES). The function of E-TES is to capture surplus electrical energy, typically from VG or non-load following nuclear plants, and store the energy as heat. This heat can then be delivered to (1) an industrial plant that needs process heat, or (2) a power plant that can regenerate electricity at times of high demand, acting as a battery that can manage the supply-demand mismatch. In both cases, the stored heat of E-TES replaces the combustion of fossil fuels with the energy of zero-carbon sources, opening a pathway to transition away from fossil fuels.
Firebrick resistance-heated energy storage (called “FIRES”) is an E-TES system based on commonplace industrial materials that was conceived to replace fossil fuels with zero-carbon energy in even the hottest power cycles and industrial plants. Previous work [2] has established the relative robustness of ceramic brickworks to store 100s-1000s of MWh and achieve cycle times of either a few hours or days depending on the market demand, with comfortable storage times of a week. System cost estimates came to approximately $10/kWh, far below long-term battery projections near $150/kWh [3, 4], using commercially available firebricks and metallic heaters that typically operate near 1000oC.
While 1000oC is acceptable for many industrial processes, the production of steel, glass and cement require temperatures of 1500oC or more, with flame temperatures near 2000oC [5], hotter than any commercially available heaters [6-8]. Moreover, operating near the peak temperatures of commercial heater options causes them to burn out relatively quickly in an air environment, requiring frequent and potentially costly replacements, thereby limiting their practicality. Heaters are designed to deliver heat to surroundings, typically in relatively rapid fashion, and relatively frequent replacement; this is contrary to the application of thermal energy storage, which desires the gradual deposition of heat into a thermal mass over the course of hours, does not benefit from a rapid heat-up, and is hindered economically if heaters must be frequently replaced.
The goal of this doctoral work is to develop a new type of FIRES system, which operates without the limitations of traditional heaters and instead employs a new approach: electrically conductive firebricks. Such bricks would serve as both the charge medium and heat storage medium of FIRES, and holds promise for very long life, high temperatures, and reliable charging capabilities. A hypothesis was developed that a mass of electrically conductive bricks, composed of a cation-doped oxide material, may be stacked to form a large thermally insulated electrical circuit in the form of a brickwork. The brickwork may pass an electrical current through freely stacked bricks to volumetrically resistance-heat the mass near 2000oC, with long-term thermo-mechanical stability and controllable electrical charging.
The work herein follows along the steps taken towards developing a FIRES system that uses electrically conductive firebrick. It embodies a holistic effort to bring this technology closer to commercialization, which includes testing of commercial firebricks, design, fabrication, and testing of custom ceramics to match requirements, proof of concept experiments, system charging simulations, and conceptual design and discussion.
To begin, the motivation of this work is presented (Section 2), by clarifying why E-TES is a class of devices that can make great strides towards decarbonizing the energy sectors, and why further innovation is required. A discussion of current and future energy needs is presented, both in terms of the challenges of achieving an electricity grid with high VG penetration and the inadequacies of current technology options to deliver zero-carbon high-temperature heat to industrial processes. The existing E-TES options are discussed in more detail, the need for hotter E-TES is established, and the FIRES system is described. Following this, the relevant technical background is presented (Section 3). The fundamental physics and engineering of ceramic joule-heater design is reviewed, and
13
properties desirable for a FIRES storage medium are discussed. An evaluation of materials options is provided (Section 4), culminating in selection of doped chromia for further investigation.
The experimental portion of the work is presented next. Experimental methods (Section 5) for sample preparation and electrical property measurements are detailed for some existing commercially available firebricks and lab-fabricated doped ceramics. Results are reported (Section 6) and discussed in terms of performance characteristics. The section concludes with results of a joule-heating experiment of a small stack of ceramic bricks, serving as a proof of concept for the direct resistance-heating of freely stacked firebricks for energy storage applications.
Next the modeling and simulation portion of this work is presented, which uses the experimental results to examine key aspects of spatial heat generation and heat transfer during charge cycles. Modeling and simulations focus on three specific concerns: the excessive heating of brick-brick electrical contacts in a large stack (Section 7), the length scale of short circuit failures for the candidate chromia material (Section 8), and the timescale of thermal runaway (Section 9).
Fourth, the preliminary design and dimensioning of FIRES is detailed, informed by the simulations and by state-of-the-art of industrial systems and practices. The bricks, brickwork regions, and electrically conductive flow path are designed to ensure resistance to thermal runaway while maintaining an overall geometry compatible with existing industrial hot blast stove technology (Section 10). Further design considerations regarding retrofits and modifications to target application, specifically, cement, steel, and Brayton power cycles, are discussed in Section 11. The work concludes (Section 12) with a summary of findings and the next steps in commercializing the FIRES technology, different applications the technology may see use in that were not already discussed, and high level discussion of the role regulation may play in the adoption of E-TES systems.
14
2 Background
2.1 Electricity sector challenges
In the absence of affordable electricity storage, the addition of large volumes of renewable energy to electricity grids has created an unprecedented volatility in electricity supplies, which has caused balancing challenges to the system. Figure 1a shows the change in net electricity load in California from 2012 to 2020. The addition of more solar energy over the years has caused the net load to dip dramatically in the middle of the day. Net load is the load after subtracting wind and solar, which have near-zero operating costs. This drop in net load corresponds to a drop in the wholesale market price near zero (Figure 1b), reflecting the low value of the electricity at these times. The low sale price hurts the economics of solar generators as well as any other generators operating at the time, such as wind, nuclear or hydro plants. There is little revenue to pay for the capital and maintenance costs. This dip also creates an overgeneration risk where the combined generation of solar power and “must run” thermal and hydro plants produces more than what is demanded. To prevent overgeneration, solar generation must be curtailed, further hindering its ability to reach high penetration.
a)
b)
Figure 1: Effect of solar energy on California electrical load and wholesale electricity prices during a spring day.
a): Projected electrical load in subsequent years with more solar energy penetration (the “duck curve”) [9]. b): Wholesale electricity price data at a southern California node, March 31, 2019. As more solar energy is installed, risk of overgeneration at the peak of sunny days increases, and electricity value decreases.
-20 0 20 40 60 80 0 3 6 9 12 15 18 21 24 Who le sa le pr ice ($/ M Wh ) Hour number
Electricity price - March 31, 2019
(CAISO GOULD_2_N007)
15 a)
b)
Figure 2: solar curtailment and levelized cost of energy (LCOE) as a function of greater solar energy penetration. a): Annual curtailment. b): Solar LCOE. [9]
As regions such as California drive towards greater renewable penetration in the grid, unfavorable sales prices and curtailment become rapidly unsustainable. Figure 2 shows the effects of greater solar energy penetration on the amount of energy curtailed from solar generators (Figure 2a) and the associated rise in levelized cost of energy (LCOE) due to less lifetime generation (Figure 2b). Curtailment levels and cost rise rapidly past 20% solar penetration. In the case where typical “must run” plant capacity is cut in half, and solar power is allowed to make up 80% of power demand, curtailment and cost instead rise rapidly past 28% solar penetration. Figure 3 shows the reductions of wholesale price of electricity in a simulated grid scenario as the solar power penetration is increased. The average sale price of solar energy drops by half near 30% power penetration.
16
Figure 3: Average market price of energy as a function of solar power penetration. [10]
To achieve electricity grids with a large share of VG, challenges of supply and demand mismatch must be met with energy storage. Denholm and Margolis found that California would require an additional 15-25 GW of storage capacity to economically reach solar PV penetration of 50%, matching or exceeding the installed storage capacity nationwide [11]. This storage would be required to enable an LCOE of $70/MWhe for solar PV, somewhat more costly than the average wholesale price of California $40-$50/MWhe [12]. But the study does not consider the cost of the storage itself, which if expensive may be just as cost prohibitive as heavily curtailed VG. Current capital costs for Li-ion batteries, the most deployable option, are typically between $250-$500/kWh, and are likely to stay above $150/kWh in the future [3, 4]. Recent work by Schmidt et al. [13] predicts that Li-ion batteries or vanadium redox-flow batteries will be the cheapest storage option for energy arbitrage with long-term projected levelized costs of storage (LCOS) of $150/MWhe. Storage at this cost would effectively triple the cost of stored solar energy, and even more dramatically increase the total LCOE of a high-penetration solar PV grid. The current state and projections portend an expensive electricity grid if new storage solutions are not pursued.
2.2 Industrial heating sector challenges
Although given less attention, the heating sectors pose a comparable threat to the climate as the electricity sector, with a larger energy burden. The different energy sources and sinks of the US is shown in Figure 4. Non-electricity fuel consumption in the residential, commercial, and industrial sectors account for 28% of the CO2 emissions in the US, compared to 38% for electricity generation [14]. However, the CO2 from electricity is only associated with approximately 13 quads (quadrillion Btu) of delivered electricity, while the heating sectors are associated with approximately 27 quads of delivered heat [15], roughly double. This discrepancy arises because making electricity from traditional power plants requires 2 or 3 units of fossil fuel heat per unit of electricity, depending on plant efficiency. Because wind and solar generators produce electricity directly and are replacing traditional power plants, 1 quad of VG capacity will remove 2-to-3 quads of fuel emissions.
The 27 quads of the heating sector will not generally have this feature when replacing fossil fuels with zero-carbon energy, except where heat pumps may be used. Heat pumps only operate at lower temperatures, based on the capabilities of existing refrigerants. The largest share of this energy is in the industrial sector, which requires approximately 18 quads1 of heat at elevated temperatures, far above typical maximum heat pump temperatures of 75oC [17].
1 A portion of the 23 quads of industrial fuel consumption are used as feedstock rather than heat. Feedstock was estimated as 5 quads, based on estimations of the Energy Information Administration [16].
17
Figure 4: energy flow diagram of United States, 2018. [15]
Figure 5 shows global energy projections to 2050. World energy usage is expected to increase from approximately 600 quads today to 900 quads in 2050, with the industrial sector making up one third of energy consumption or more throughout. Energy-intensive manufacturing is expected to rise substantially as large populations of the world continue substantial development.
18
b) c)
Figure 5: global energy projections to 2050.
a): Total energy consumption. b): End-use breakdown by energy sector. c): Breakdown of industrial subsectors. [18]
Three of the largest energy consumers and CO2 producers of the industrial sector are chemical processing, steel, and cement production, accounting for 4%, 7%, and 7% of global energy system emissions, respectively [19]. Chemical production primarily uses steam at temperatures of a few hundred Celsius, while cement, glass, and steel manufacturing require temperature between 1000oC and 1800oC. [5, 20].
The options to decarbonize the heat inputs of these processes are limited to only a few existing or proposed technologies. Friedmann et al. recently published a study of low-carbon heating options for industry in terms of cost, temperatures, carbon footprint, and technical feasibility. Figure 6 shows the temperature capabilities of potential zero-carbon heat sources, as well as operating temperatures of the industrial processes of interest. Traditional or advanced nuclear reactors have some potential for use in chemical and paper process heat. For cement, glass and steel, nuclear heat can be used for preheating but the options for higher temperature heat are limited to electricity, hydrogen, or biomass.
19
Figure 6: Temperature capabilities of potential zero-carbon heat sources compared to application requirements. [5]
Each of these options have costs and carbon intensity dependent on their generation process. Figure 7 shows estimates of cost and carbon footprint. With the exception of nuclear reactors, the cost of most other heating options is expected to far exceed fossil fuel costs. Hydrogen via steam methane reforming (SMR) with 89% carbon capture is considered the least expensive “low carbon” heating option that can run the hottest applications, and is approximately $16/MMBtu fuel (twice or three times that of typical fossil fuel costs in the US). It is dependent on natural gas extraction and carbon capture infrastructure that may be geography dependent, and still has some emissions. Although renewably generated hydrogen via electrolysis has a low carbon footprint, each option is expected to cost a factor of five or ten more than typical fossil fuels. An inherent disadvantage of hydrogen generation via electrolysis is the efficiency loss of the process; the eventual heat from combustion will be only 67-84% of the electricity input for most systems, even with further developments of low and high-temperature electrolyzers through the year 2030 [17]. Many carbon footprint analyses of biomass options remain controversial, and biomass options vary widely in price range. “biodiesel 100” is approximately four to eight times as expensive as fossil fuels.
20
Figure 7: Cost comparison of different heating options. [5]
Although shown with a large cost range and uncertain carbon intensity, electric resistance heating is potentially the lowest cost heating option capable of running the hottest applications. If operated in high renewable penetration grids at times when the vast majority of electricity is generated by zero-carbon sources (e.g., the peak of sunny days in California), electricity may be the most competitive zero-carbon heat source. One inherent advantage over fuel production is the 100% efficiency of joule heating. The electrical heat may be stored for later use in a thermal mass with low heat leakage.
However, implementation of electricity as a heat source is more complicated than other options. While hydrogen and biodiesel still generate and transfer heat via combustion, electric heat generation and transfer requires the integration of heating elements and an electrical infrastructure that may not fit conveniently into existing processes. For lower temperatures driven by heat exchangers and steam generators, the implementation of heaters may be simpler than in the case of high temperature systems that rely on radiative heat transfer of flames. These challenges are reflected in the qualitative feasibility chart in Figure 8, also from the work of Friedmann et al. [5].
The combinations of either high cost or low feasibility of different low-carbon heating options makes clear the need for more work on developing technologies that enable decarbonization of the industrial heating sector.
21
Figure 8: Qualitative feasibility chart for different industrial heating options. [5]
2.3 Description of firebrick resistance-heated energy storage (FIRES)
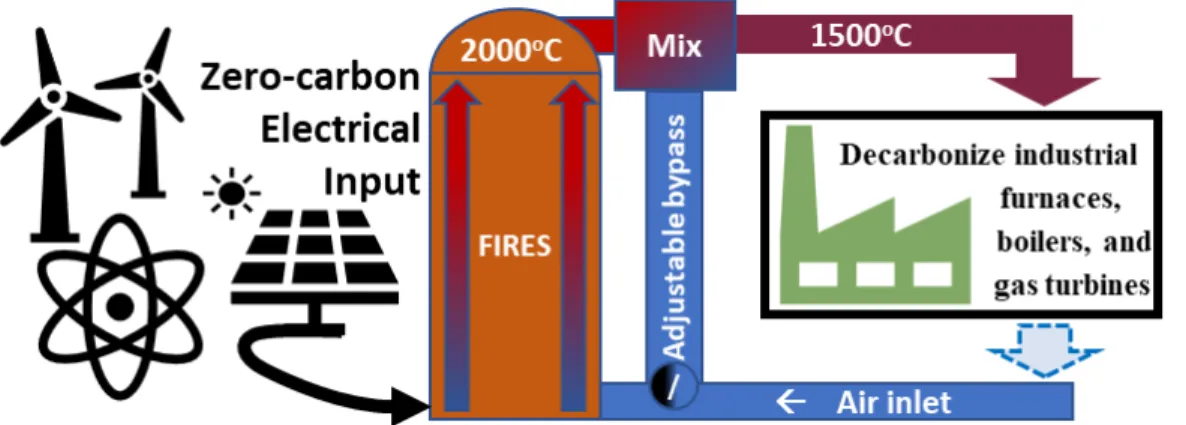
Firebrick resistance-heated energy storage (FIRES) [2, 21, 22] is an electrically heated thermal energy storage (E-TES) concept designed to couple with high-temperature industrial plants or power plants. The system consists of a large mass of heat-resistant ceramic bricks known as firebricks, an electrical heating system capable of heating up the firebricks, a blower system capable of removing heat from the bricks via convective heat transfer, and a steel vessel lined with ceramic insulation capable of housing the hot bricks. The system is “charged” by heating the firebricks using electricity. The system is “discharged” by blowing air through the hot bricks, which are laid as a brickwork that forms chimney-style air channels. Figure 9 shows a simple schematic of how FIRES is operated to deliver heat to applications that traditionally use fossil fuels.
Figure 9: Schematic of FIRES coupled with generic industrial heating application.
The brickwork, insulation, steel vessel, and plumbing of FIRES is modeled after existing high-temperature firebrick regenerators that are commonplace in industrial glassmaking and steelmaking [2], which are used to capture and store the heat of hot flue gases to reduce fuel consumption. Figure 10 below shows the regenerative “hot blast” or “Cowper” stoves used in blast furnaces for steelmaking, and several common brick geometries that make up their
22
chimney-style brickworks. Hot blast stoves operate with peak temperatures of 1600oC, heat rates up to 300 MW [23], hourly cycling, and near-continuous operation [24], with a 20-30 year lifetime [25].
Figure 10: Existing basis of FIRES system. [23, 26]
In industrial applications, hot exhaust gas from steel and glass furnaces is routed through the regenerators, heating the brick and cooling the furnace gas before it is exhausted to the atmosphere. After the firebrick is heated, ambient air is sent through the firebrick and heated. After heating, fuel is added to raise the gas temperatures to those required by the industrial process. This results in large energy savings. The firebrick goes through multiple cycles per day. In many industrial processes the hot gas is corrosive and contains particulates. Firebrick is used because it is the only material able to withstand the high temperatures. There is more than a century of large-scale industrial experience with these systems.
The main difference between FIRES and hot blast stoves, and the key point of necessary innovation, is the inclusion of an electrical heating system for charging. Brickworks integrated with electric heating systems have been deployed at residential and commercial scales for the purposes of space and water heating, in E-TES systems known as firebrick storage heaters. Units as large as 10 MWh for commercial complexes have been deployed in China as part of national “coal to electricity” anti-pollution policies [27]. Figure 11 shows residential and commercial firebrick storage heaters. At the industrial scale, Siemens Gamesa has recently launched a pilot plant of an E-TES technology that couples an electric heating system with a crushed rock storage medium [28]. The system charges by blowing air through a heater chamber and then through the crushed rock to heat it. The system discharges by again blowing air through the rock. The heated air is used to run a steam turbine to produce electricity. The full scale system is intended for gigawatt-hours of storage for steam power plants.
23
The limiting feature of these E-TES systems is the type of electric heating elements they use to heat the firebrick or other storage media. Each is based on metallic heating elements. The key properties of existing metallic and ceramic heater options are shown in Table 1. Metallic heaters have maximum operating temperatures of 1300-1400oC, but they are regularly operated several hundred degrees colder to maintain a longer heater life; the oxidation of the metals increases exponentially with temperature [6]. In practice, each of the metallic-based E-TES systems store at peak temperatures of 750-850oC. Although effective for many industrial processes that use steam, these temperatures are too low for cement, glass, and steel production. For electricity production, E-TES systems coupled with steam turbines are limited to a maximum of 45% roundtrip efficiency, more typically 35-40%, which represents a relatively large waste of the electricity inputted compared to the efficiencies of natural gas combined cycle (NGCC) plants, near 60% efficient with peak temperatures of 1600oC [31]. A FIRES unit capable of powering steel, cement, and glass plants, as well as NGCC plants, must possess a heating system that outperforms metallic heaters.
Another large benefit to higher temperature storage is greater energy density and smaller system size. Heat storage materials such as firebrick can go to very high temperatures, far above metallic heater limits, meaning a great deal more sensible heat may be stored. If one doubles the temperature swing from hot to cold, the quantity of firebrick, weight, and size of the storage system may be reduced by approximately half. This creates economic incentives to increase storage temperatures for even low-temperature applications.
Table 1: Typical heater operating capabilities [2]
Key Performance Aspects of Candidate Resistance Heaters
Heater Type
Operating
Peak
Temperature
Max Recommended
Surface Load
@ Typical
Temp
@ High
Temp
-
oC
kW/m
2kW/m
2Nichrome (Ni-Cr) [6]
1250
(800
35-100
oC)
(1100
10-25
oC)
Kanthal (Fe-Cr-Al) [6]
1425
(800
50-120
oC)
(1300
20-35
oC)
Silicon Carbide (SiC) [7]
1650
(1200
100-150
oC)
(1600
25-30
oC)
Molybdenum Disilicide
(MoSi
2) [8]
1850
200-220
(1500
oC)
(1750
80-120
oC)
The ceramic heater options, silicon carbide (SiC) and molybdenum disilicide (MoSi2), exceed metallic heaters in peak temperatures and heat flux capabilities, and generally have longer life. This is because of their higher temperature stability and slower oxidation kinetics. However, ceramic heaters have several limitations of their own. Whereas metallic heater wires can be easily produced to any length to span long lengths and follow firebrick channel paths, ceramic heaters are each prefabricated and must penetrate the insulated wall of the storage chamber such that their electrodes are kept cool; this makes it difficult to reach the innards of a large brickwork. The length restrictions also imply more electrical penetrations into the heat storage systems with more heat losses through those penetrations. While SiC heaters can be cantilevered against the external wall, MoSi2 heaters do not have the mechanical strength to be cantilevered and must be supported against gravity. SiC heaters can operate only slightly hotter (1650oC) than the applications FIRES aims to power, which makes sustained delivery of heat difficult. This is again exacerbated by oxidation kinetics, which demands that in practice SiC heaters be operated a couple hundred degrees Celsius below peak [32]. For a high temperature FIRES unit, it was concluded that a charging system based on existing heater options could not match the same reliable performance as the discharge system demonstrated in hot blast stoves.
24
To achieve a FIRES charge system similarly robust as the discharge system, a novel approach was considered, in which the firebrick acts as both the electrically conductive charge medium and the storage medium, and the brickwork is charged via direct resistance heating (DRH). By using electrically conductive firebrick, electricity can flow directly through the brickwork, generating heat volumetrically, and avoiding major temperature gradients, as well as heater wattage loading limits. A DRH charge system may also be most simplistically incorporated without major adaptation of existing hot blast stove designs, by avoiding the need to fit new components into the brickwork, such as with cantilevered heaters. The design burden of a DRH-style FIRES unit is therefore the design of the electrically conductive firebrick itself.
2.4 Requirements of firebrick for DRH-style FIRES
A DRH FIRES unit where the firebrick acts as both the energy storage media and joule-heating media has unique requirements for the firebrick, which merges the attributes of both traditional firebricks and joule heaters. This section discusses these attributes in more detail. The final three attributes discussed, which all pertain to electrical properties, are the focus in this doctoral work. Table 2 lists the attributes of an ideal firebrick for DRH, as well as the relative capabilities in existing hot blast stoves and ceramic heaters with respect to each attribute.
• High operating temperature: The starting point of evaluating candidate materials is whether they are capable of operating at high temperatures, which at a minimum requires a high melting point and sufficient mechanical strength to withstand the weight of the storage media stacked on top. Operating temperatures in practice are set by several other considerations as well. Hot blast stove materials, which consist of high-alumina firebricks, routinely reach 1600oC, with ratings near 1800oC and melting points over 2000oC. Other oxide options have similar temperature ranges.
• Bulk chemical stability (in air): Rapid oxidation is a common disqualifier of materials for high temperature applications. Most firebricks are already oxides which cannot be oxidized further. Existing ceramic heaters are not oxides but form SiO2 layers on the outside that protect the bulk material. SiC heaters fail due to gradual growth of this layer as oxygen penetrates further inward, increasing heater resistance and causing stresses between the protective layer and the bulk material. This is commonly called aging [32]. MoSi2 heaters have a slower oxidation rate.
• Thermal shock resistance: A key challenge in the design of heaters and hot blast stoves, thermal shock resistance is the ability of a material to resist crack formation and propagation due to temperature-induced stresses, particularly during thermal cycling of materials. Smaller and more thermally conductive objects such as SiC and MoSi2 heater rods have better thermal shock resistance than larger oxide bricks for the same operating conditions, such that heaters can generally handle higher heat rates than firebricks. Hot blast stoves have been designed to operate on the order of 104 cycles, for decades of operation with some regular maintenance. SiC heater life is generally limited by oxidation rather than thermal shock. MoSi2 failure sometimes occurs from thermal stresses during cooldown, caused by material embrittlement after long periods of operation [33].
• High heat transfer rate: The heat transfer rate achieved in practice is tied to thermal shock limits, where very high heat transfer rates induce too much stress. Based on previous analysis [2], typical brickworks of hot blast stoves are estimated to have heat transfer rates up to several 10s of kW/m2, where heaters may reach over 100 kW/m2 (Table 1). In a DRH system, this heat transfer rate pertains to the convective heat transfer that the brickwork walls may handle from an airstream during discharge. Charge rates are far less constrained by thermal shock because heat is generated volumetrically through the conductive brickwork rather than transferred by surface convection/radiation.
• High energy density: A higher energy density makes heat storage more practical by storing more energy in less mass/volume. This is secondary to all the attributes necessary for surviving high temperatures in hot blast stoves, and is not considered in heater applications. Typical high-alumina low porosity firebricks have a thermal mass between 0.5 and 1 MWh/m3 of sensible heat capacity for a temperature change of 1000oC. • Bulk electrical conductivity: Electrical conductivity is an essential requirement not seen in most
commercial firebricks, which are large bandgap semiconductors, classified for most purposes as electrical insulators. Even at temperatures of 1000oC, alumina-silica refractories generally have resistivities of 105 ohm-cm. Meaningful heat generation at these resistivities is generally impractical. This high resistivity is due to the covalent bonding and lack of free charge carriers in oxide crystal structures. Heaters made of SiC, also a relatively large band gap semiconductor, have far lower electrical resistivities, near 10-2 ohm-cm. This
25
effect is achieved by doping the crystal structure with atoms of different valency, creating freely moving electrons or holes. MoSi2 heaters have electrical resistivities near 10-5 ohm-cm, because MoSi2 is an intermetallic compound with no energy band gap, meaning valence electrons will freely move through the crystal under an applied voltage.
• Small resistivity-temperature derivative (RTD): In addition to being sufficiently electrically conductive, candidate firebricks must also have a relatively constant resistivity with temperature, i.e., a relatively small resistivity temperature derivative (RTD). Most commercial firebricks have sharp exponentially decreasing resistivities, which may change by four orders of magnitude over the temperature ranges of interest. This makes it very challenging to controllably heat a large mass of the material. As the temperature goes up, the electrical resistivity goes down. This implies that most of the current goes through the hottest part of the ceramic creating the risk of run-away heating and heater failure. SiC heaters have a sharp negative RTD up until approximately 600oC, at which point resistivity levels out and the RTD turns positive and small. It is therefore typically recommended to operate SiC heaters above 600oC [7]. MoSi2 heaters possess a relatively constant positive RTD throughout the temperature range, with a factor of 10 or 12 change in resistivity over the temperature range. The control challenges created by different RTDs and the theory behind the different behaviors are discussed in the following section.
• Surface electrical conductivity: Surface electrical conductivity is necessary for the flow of electricity between stacked firebricks. The protective SiO2 layers that form on ceramic heaters are highly insulative, and does not allow current to flow between contacting materials. This makes the prospect of simply stacking doped SiC bricks to form the DRH-style FIRES unit likely unworkable, in addition to the other shortcomings of SiC (an idea explored early in the project). Oxide firebricks in clean air undergo minimal changes in surface chemistry but are generally not electrically conductive.
Table 2: Attributes of ideal firebrick for DRH-style FIRES system
Ideal attributes Relevant material properties Hot blast stove experience Ceramic heater experience
High operating
temperature mechanical strength Melting point,
routinely 1600oC ratings near 1800oC melting points over 2000oC.
SiC: 1650oC, strength for cantilever.
MoSi2: 1850oC, hang vertically or support by hooks.
Bulk chemical stability
(in air)
Oxidation/other reaction rates, diffusivity rates
10s of years in contact with air and flue gases at elevated
temperatures.
Oxide layer formation protects bulk material, typically
100s-1000s hours life. Thermal shock resistance Thermal conductivity, young's modulus, thermal expansion coefficient, tensile strength
10^4 thermal cycles 100s-1000s thermal cycles
High heat transfer
rate (thermal shock-limited) Thermal conductivity 1s-10s kW/m2. 10s-100s kW/m2. High energy
density
specific heat, density, operating temperature
range
0.5-1 MWht/m3 for 1000oC
26 Bulk electrical
conductivity electrical resistivity 10^4 - 10^7 ohm-cm. 10^-5 - 10^-2 ohm-cm
Small resistivity-temperature derivative (RTD)
electrical resistivity, operating temperature
range Exponentially negative RTDs.
MoSi2: positive RTD SiC: negative RTD < 600oC, positive RTD > 600oC Surface electrical conductivity Surface chemistry, oxidation/other reaction
rates, diffusivity rates Generally stable, oxides
Surfaces oxidize to form SiO2, highly electrically insulative
2.5 Strategy of DRH-style firebrick development
Of the many attributes necessary for a DRH-style firebrick, the three most critically lacking are the electrical properties, which demand a far higher conductivity, and a smaller RTD compared to the exponential trends seen in most commercial firebricks. On the other hand, existing oxide firebricks would likely overcome the problem of the resistive surface oxide layer experienced by SiC heaters if their bulk were electrically conductive, due to their already oxidized state. Doping oxides to create the necessary electrical attributes while maintaining the many other positive attributes of hot blast stove firebricks arose as a promising approach to developing a DRH-style firebrick.
First, a review of oxide options was undertaken with respect to their relevant properties and prospects for effective doping (physics are reviewed in Section 3), in addition to other practical considerations of each candidate. Next, the electrical properties of some commercial bricks were tested as a baseline to candidate materials. Finally, the top candidate bulk-dopant combination was home-fabricated and tested.
3 Joule heater fundamentals
The principles of design for effective resistive heating devices involve the intersection of semiconductor physics and materials science. This section begins with a review of semiconductor electrical conductivity, and discusses the capabilities to predict and design for specific properties. Then an evaluation of the material option space for DRH-style firebricks is presented, with respect to the relevant semiconductor and material properties.
3.1 Electrical conductivity in semiconductors
The electrical conductivity of a material can be generally expressed as the product of the available charge carriers, and mobility of the carriers:
𝜎𝜎(𝑇𝑇) = 𝑞𝑞 ∗ 𝜇𝜇𝑐𝑐(𝑇𝑇)𝑁𝑁(𝑇𝑇)
(1)
where T is the temperature, q is the carrier charge, 𝜇𝜇𝑐𝑐 is the carrier mobility, and N is the charge carrier concentration. Typical units for charge, carrier concentration, and mobility are Coulombs C, #/cm3, and cm2/V-s respectively. The charge carrier may be an electron or an electron hole. The properties of mobility and carrier concentration heavily depend on the class of material, particularly with regard to its electron band structure. A brief review of semiconductor electronic band theory is given here.
Carrier concentration
27
In the electronic band structure of pure semiconductors, there is an appreciable band gap between the energies of the valence band edge Ev and the conduction band edge Ec. The creation of a free electron charge carrier, unbound
from the valence shell and free to move in an electric field, requires the thermal excitation of valence electrons across the band gap Eg, where Eg = Ec - Ev. This excitation leaves a hole in the valence shell that is also a carrier, free to
migrate through the solid as adjacent valence electrons hop to its location. Figure 12a shows a simplified band structure of an undoped semiconductor.
Figure 12: simplified band structures of semiconductors.
a) undoped intrinsic semiconductor. b) p-type doped semiconductor, with an acceptor ionization energy near the valence band. c) n-type doped semiconductor, with the donor energy level near the conduction band. EFi denotes the Fermi level in the intrinsic case. Adapted from [34].
The number of carriers that exist at a given temperature is determined by density of possible electron states over the energy range of interest, and the probability that the state is (or is not) occupied. The number of free electrons (holes) in the conduction band (valence band) at a given temperature can be obtained by integrating the product of the density of states in the band and the probability that the state is occupied (unoccupied) by an electron:
𝑛𝑛𝑜𝑜(𝐸𝐸) = � 𝑔𝑔𝑐𝑐(𝐸𝐸)𝑓𝑓(𝐸𝐸)𝑑𝑑𝐸𝐸 ∞ 𝐸𝐸𝑐𝑐 𝑎𝑎𝑛𝑛𝑑𝑑 𝑝𝑝𝑜𝑜(𝐸𝐸) = � 𝑔𝑔𝑣𝑣(𝐸𝐸)�1 − 𝑓𝑓(𝐸𝐸)�𝑑𝑑𝐸𝐸 𝐸𝐸𝑣𝑣 −∞ (2)
Where no is the number of free electrons at thermal equilibrium, po is the number of free holes a thermal equilibrium,
E is energy, g(E) is the density of states function, f(E) is the Fermi-Dirac distribution, and the subscripts c and v signify
conduction band or valence band. Note that in the case of holes, the probability is represented by 1-f(E). The Fermi-Dirac distribution is written:
𝑓𝑓(𝐸𝐸) = 1
exp �𝐸𝐸 − 𝐸𝐸𝐹𝐹
𝑘𝑘𝑇𝑇 � + 1
(3)
where EF is the Fermi level. An energy state at the Fermi level corresponds to a 50% chance of being occupied by an
electron. For semiconductors where the Fermi level is farther than 3kT from the edge of the valence band and conduction band (referred to as “non-degenerate” semiconductors), the Fermi-Dirac distribution may be simplified to the Maxwell-Boltzmann distribution:
𝑓𝑓(𝐸𝐸) ≈ exp �𝐸𝐸𝐹𝐹𝑘𝑘𝑇𝑇 �− 𝐸𝐸
(4)
This allows for the analytical solution of equation (1), with the following result of free electron and hole concentrations:
𝑛𝑛𝑜𝑜= 𝑁𝑁𝑐𝑐exp �𝐸𝐸𝐹𝐹𝑘𝑘𝑇𝑇 � 𝑎𝑎𝑛𝑛𝑑𝑑 𝑝𝑝− 𝐸𝐸𝑐𝑐 𝑜𝑜= 𝑁𝑁𝑣𝑣exp �𝐸𝐸𝑣𝑣𝑘𝑘𝑇𝑇 �− 𝐸𝐸𝐹𝐹
28
where Nc is the effective density of states in the conduction band, and Nv is the effective density of states in the valence
band: 𝑁𝑁𝑐𝑐=2(2𝜋𝜋𝑚𝑚𝑛𝑛 ∗𝑘𝑘𝑇𝑇)32 ℎ3 𝑎𝑎𝑛𝑛𝑑𝑑 𝑁𝑁𝑣𝑣= 2�2𝜋𝜋𝑚𝑚𝑝𝑝∗𝑘𝑘𝑇𝑇� 3 2 ℎ3 (6)
where h is Planck’s constant, and 𝑚𝑚𝑛𝑛∗ and 𝑚𝑚𝑝𝑝∗ are the density of states effective masses of electrons and holes,
respectively. The Fermi level, temperature, electron and hole concentrations are related by: 𝐸𝐸𝐹𝐹= 𝐸𝐸𝑣𝑣+ 𝑘𝑘𝑇𝑇 ∗ 𝑙𝑙𝑛𝑛 �𝑁𝑁𝑝𝑝𝑜𝑜
𝑣𝑣� = 𝐸𝐸𝑐𝑐+ 𝑘𝑘𝑇𝑇 ∗ 𝑙𝑙𝑛𝑛 �
𝑛𝑛𝑜𝑜
𝑁𝑁𝑐𝑐�
(7)
By the law of mass action, the product of free electrons and free holes must be a constant at equilibrium. In an intrinsic semiconductor, where the creation of a free electron in the conduction band also creates a hole in the valence band (𝑛𝑛𝑜𝑜= 𝑝𝑝𝑜𝑜), the constant value may be designated the square of ni, the intrinsic carrier concentration:
𝑝𝑝𝑜𝑜𝑛𝑛𝑜𝑜= 𝑐𝑐𝑐𝑐𝑛𝑛𝑐𝑐𝑐𝑐𝑎𝑎𝑛𝑛𝑐𝑐 = 𝑛𝑛𝑖𝑖2
(8)
It follows that the Fermi level for an intrinsic semiconductor, denoted EFi, changes with temperature as per the relation:
𝐸𝐸𝐹𝐹𝑖𝑖=𝐸𝐸𝑐𝑐+ 𝐸𝐸2 𝑣𝑣+ 𝑘𝑘𝑇𝑇 ∗ 𝑙𝑙𝑛𝑛 �𝑁𝑁𝑁𝑁𝑣𝑣 𝑐𝑐�
(9)
In an intrinsic semiconductor, where the creation of a free electron in the conduction band also creates a hole in the valence band, po = no.. and the square root of their product yields the generic intrinsic carrier concentration, which
can be expressed as:
𝑛𝑛𝑖𝑖= �𝑛𝑛𝑜𝑜𝑝𝑝𝑜𝑜= �𝑁𝑁𝑐𝑐𝑁𝑁𝑣𝑣exp �𝐸𝐸𝑣𝑣2𝑘𝑘𝑇𝑇 � = �𝑁𝑁− 𝐸𝐸𝑐𝑐 𝑐𝑐𝑁𝑁𝑣𝑣exp �−𝐸𝐸2𝑘𝑘𝑇𝑇�𝑔𝑔
(10)
Note that, by this manipulation, the Fermi level is eliminated from the equation, and the intrinsic carrier concentration relates to the band gap Eg.
An intrinsic semiconductor shows an exponential increase of charge carrier concentration with temperature, which is impractical for most resistance-heated devices. The exponential trend continues until the material melts, creating no regime where carrier concentration is constant.
To modify the electrical behavior of semiconductors, small amounts of impurities are added, i.e, dopants, which change the band structure of the semiconductor. Dopants most commonly substitute atoms of the pure lattice and have one more or one fewer electron in their valence shell. The net effect of the dopant is the donation of one free electron to the conduction band (n-type doping), or the acceptance of an electron from the valence band to form a free hole (p-type doping). Figure 12b and Figure 12c show the relative positions of the dopant energy levels which will donate or accept electrons from the neighboring band edges. An effective p-type dopant will have usually one fewer valence electron and an energy level near the valence band edge; an effective n-type dopant will have usually one more valence electron and an energy level near the conduction band edge. The creation of these free carriers requires the ionization of the dopant, again a thermally activated process, but with lower temperature requirements, as per the smaller energy gap that exists between the band edges and the energy level of the dopant. The number of dopant sites ionized as a function of temperature, which yields an equal number of free carriers, is expressed as [34]:
𝑁𝑁𝑑𝑑+= 𝑁𝑁𝑑𝑑 1 + 𝑔𝑔𝑑𝑑exp �𝐸𝐸𝐹𝐹𝑘𝑘𝑇𝑇 �− 𝐸𝐸𝑑𝑑 𝑎𝑎𝑛𝑛𝑑𝑑 𝑁𝑁𝑎𝑎−= 𝑁𝑁𝑎𝑎 1 + 𝑔𝑔𝑎𝑎exp �𝐸𝐸𝑎𝑎𝑘𝑘𝑇𝑇 �− 𝐸𝐸𝐹𝐹 (11)
where N indicates concentrations of dopants, + and – superscripts indicate ionized dopants, and d and a subscripts indicate acceptor or donor dopants. 𝑔𝑔𝑑𝑑 and 𝑔𝑔𝑎𝑎 are the donor and acceptor ground state degeneracy of the bulk material,
i.e., the number of ways in which the ionization can occur.
The presence of free holes, free electrons, and ionized acceptor and donor sites in the bulk material must obey the local charge neutrality equation:
29 𝑝𝑝𝑜𝑜− 𝑛𝑛𝑜𝑜− � 𝑁𝑁𝑎𝑎−𝑙𝑙 𝑀𝑀𝑎𝑎 𝑙𝑙=1 + � 𝑁𝑁𝑑𝑑+𝑙𝑙 𝑀𝑀𝑑𝑑 𝑙𝑙=1 = 0 (12)
where the summations are over M kinds of p-type or n-type dopant materials. When combined with equations (5) and (11), all terms are defined to solve for the Fermi level that satisfies (12). The Fermi level will move as more dopant is activated. In single-doped systems (Figure 12b or Figure 12c), the Fermi level will typically be located in between the dopant energy level and the nearest edge of the band gap at low temperatures. As the dopant becomes activated, the Fermi level will generally move towards the center of the band gap.
The resulting carrier concentration of a single-doped semiconductor over the temperature range is shown in Figure 13. The temperature dependence of carrier concentration has three distinct regimes: ionization, extrinsic, and intrinsic. At low temperatures, the free carriers increase exponentially as the dopant is ionized, such that carrier concentration is driven mostly by equation (11). As nearly all the dopant sites are ionized, i.e., 𝑁𝑁𝑎𝑎−≈ 𝑁𝑁𝑎𝑎, the material
enters the extrinsic regime, where increasing temperature has a negligible effect on carrier concentration. This is also referred to as exhaustion. Throughout this temperature regime, the excitation of electrons across the bandgap is exponentially increasing, but negligible. At a high enough temperature, the intrinsic electron-hole generation overtakes the base dopant as the dominant charge carrier, and the carrier concentration again increases exponentially, following the ni line.
Figure 13: Carrier concentration of a doped semiconductor as a function of inverse temperature. [35]
When designing joule heaters as well as other electronic devices, the extrinsic region is generally the area in which the device is operated, due to the vast changes in resistivity that may occur in the exponential regions. To change this operating range, one may add more or less dopant. Figure 14 shows the effect of varying the amount of dopant added. More dopant shifts the upper temperature limit TU and lower temperature limit TL higher. The envelope
of the extrinsic region where the dopant is fully exhausted generally shrinks as more dopant is added, as the onset of exhaustion occurs at higher temperatures and is more gradual. Earlier exhaustion occurs with dopants whose energy
30
levels are close to the band gap edge. More dopant also has the added effect of proportionally higher conductivity. A balance must be struck between the width of the extrinsic region, the onset of the extrinsic region, and the overall conductivity of the system. The specific application must be considered carefully when deciding the amount of dopant. One must also consider the higher and lower bounds of doping, namely the solubility limit of the dopant within the material, and the starting purity of the material, respectively. Doping beyond the solubility limit will introduce undesirable phases and unintended properties. Research and development of higher performance transparent conducting oxide (TCO) films, i.e films that may cover a solar cell to efficiently conduct carriers away without blocking sunlight, often involve pushing the solubility limits of dopants in order to maximize electrical conductivity. Equilibrium solubility limits have been surpassed by forming and depositing doped oxides at non-thermodynamic conditions, creating metastable compositions that do not show undesirable phases [36]. Such metastable compositions may be suitable for lower temperature applications such as solar cells, but are not an option for joule-heating devices, which would lose metastability upon heating to high temperatures. Doping at very low levels in an impure material will likely result in dilution of the intended effect with the impurities. For example, the presence of an unintended p-type impurity may cancel the effect of an n-p-type dopant. These factors set the stringent purity requirements of most of the semiconductor industry. While devices for such applications may typically be expected to operate at a range of -50oC to 150oC [35], joule-heating applications aim to create an exhaustion region of 1000oC or more.
Figure 14: The effect of greater dopant on lower and upper temperature limits TL and TU of the fully exhausted extrinsic region in silicon.
Adapted from [34].
Carrier mobility
The mobility of carriers in semiconductors is affected by several complex interactions of the electrons and holes with impurities, phonons, and lattice distortions, which have competing effects. The relative magnitude of each changes with temperature and dopant amount, and vary widely by the character of the semiconductor. The mobility derivative d𝜇𝜇𝑐𝑐/dT is of special significance because it determines the resistivity-temperature derivative RTD in the extrinsic regime where N(T)≈ constant. Considerations of the RTD will be discussed more in Section 3.3.
Once a free electron or hole is formed, its mobility is understood in terms of the polaron quasiparticle, which captures the coupled movements of both the electron and the lattice ions as they shift from their equilibrium positions to screen the charge. Polarons formed during movement are characterized as a large polarons, or that small polarons.
![Figure 3: Average market price of energy as a function of solar power penetration. [10]](https://thumb-eu.123doks.com/thumbv2/123doknet/14733677.573631/16.918.111.737.115.465/figure-average-market-price-energy-function-solar-penetration.webp)