HAL Id: hal-01149960
https://hal.inria.fr/hal-01149960
Submitted on 7 May 2015
HAL is a multi-disciplinary open access
archive for the deposit and dissemination of
sci-entific research documents, whether they are
pub-lished or not. The documents may come from
teaching and research institutions in France or
abroad, or from public or private research centers.
L’archive ouverte pluridisciplinaire HAL, est
destinée au dépôt et à la diffusion de documents
scientifiques de niveau recherche, publiés ou non,
émanant des établissements d’enseignement et de
recherche français ou étrangers, des laboratoires
publics ou privés.
Going Through, Going Around: A Study on Individual
Avoidance of Groups
Julien Bruneau, Anne-Hélène Olivier, Julien Pettré
To cite this version:
Julien Bruneau, Anne-Hélène Olivier, Julien Pettré. Going Through, Going Around: A Study on
Individual Avoidance of Groups. IEEE Transactions on Visualization and Computer Graphics,
In-stitute of Electrical and Electronics Engineers, 2015, 21 (4), pp.9. �10.1109/TVCG.2015.2391862�.
�hal-01149960�
Going through, going around: A study on individual avoidance of
groups
Julien Bruneau, Anne-H ´el `ene Olivier, and Julien Pettr ´e
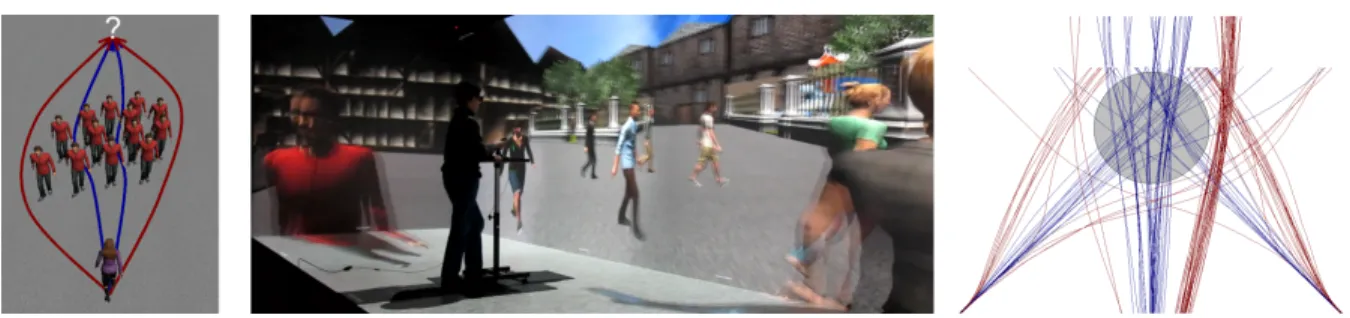
Fig. 1.Left: Our paper focuses on interactions between individual walkers and groups. We study and simulate decisions made by
a walker to go through or around groups of people.Middle: Our approach is an experimental one. We observe decisions made by
users during collision avoidance tasks with virtual groups performed in Virtual Reality. Right: Experimental results showing going
through or around decisions of one user.
Abstract— When avoiding a group, a walker has two possibilities: either he goes through it or around it. Going through very
dense groups or around huge ones would not seem natural and could break any sense of presence in a virtual environment. This paper aims to enable crowd simulators to handle such situations correctly. To this end, we need to understand how real humans decide to go through or around groups. As a first hypothesis, we apply the Principle of Minimum Energy (PME) on different group sizes and density. According to this principle, a walker should go around small and dense groups whereas he should go through large and sparse groups. Such principle has already been used for crowd simulation; the novelty here is to apply it to decide on a global avoidance strategy instead of local adaptations only.Our study quantifies decision thresholds. However, PME leaves some inconclusive situations for which the two solutions paths have similar energetic costs. In a second part, we propose an experiment to corroborate PME decisions thresholds with real observations. As controlling the factors of an experiment with many people is extremely hard, we propose to use Virtual Reality as a new method to observe human behavior. This work represent the first crowd simulation algorithm component directly designed from a VR-based study. We also consider the role of secondary factors in inconclusive situations. We show the influence of the group appearance and direction of relative motion in the decision process. Finally, we draw some guidelines to integrate our conclusions to existing crowd simulators and show an example of such integration. We evaluate the achieved improvements.
Index Terms—Crowd simulation, Interaction, Perception, Action, Groups, Virtual Reality
1 INTRODUCTION
Virtual reality technologies are constantly evolving to render more and more realistic immersive environments. Realistic environments, such as cities or public buildings, need virtual populations to resemble real ones. Crowd simulators are available to animate populations in virtual environments. Among existing techniques, microscopic approaches provide the highest level of realism for virtual environment applica-tions. They simulate each agent as well as the interactions they have together or with the user. However, solutions generally consider inter-actions between individual agents only, whereas it has been shown that pedestrian are more often walking in small groups than alone [1]. One reason for the absence of groups in simulators is that local interactions involving groups are not fully understood, and thus, not captured by numerical models of local interactions.
While there are many studies on how people navigate together as a group, we are missing information on how individuals interact with these groups. In this context, the main objective of this paper is to study interactions between individual and groups in order to create
• Julien Bruneau, Anne-H´el`ene Olivier and Julien Pettr´e are with INRIA Rennes, France. E-mail: [email protected].
Manuscript received 12 September 2014; accepted 10 January 2015; posted online 29 March 2015; mailed on 1 May 2015.
For information on obtaining reprints of this article, please send e-mail to: [email protected].
new simulation algorithms that correctly handle such situations. Not only Virtual Reality benefits from the improvements of crowd simu-lators to populate immersive virtual environments, but it plays a great role in our study. Indeed, we use a Virtual Reality platform to study individual locomotion behaviors during interactions with groups.
More specifically, we focus on the situation of collision avoidance: how do individuals avoid collision with groups of people? Our objec-tive is to understand under which conditions individuals may traverse groups or decide to circumvent them as a whole. We first approach this question under the perspective of the Principle of Minimum Energy. The Principle of Minimum Energy (PME) already used to simulate other navigation mechanism [11], states that humans tend to optimize their trajectory to use as little energy as possible to reach their goals. It is obvious that the circumventing of groups of a large size will rep-resent a considerable loss of energy along the travel path. By contrast, it is also obvious that going through small groups will require sev-eral collision avoidance maneuvers whereas it is a small detour to go around. However, several questions remain: according to PME, what are the energetic thresholds which give preference to one decision? Is the energetic difference always significant? Do real humans actually follow the rules dictated by the PME?
This paper addresses these issues and proposes three contributions:
1. We study interactions between individual walkers and groups from a theoretical point of view by applying the PME. We study groups of changing size and density, we compare go around and
go through solution paths. Three kinds of situations are drawn. In the group size-density space, we delimit two regions for which go around paths are significantly different on the energetic level from go through paths. In between, go around and go through paths represent the same amount of energy consumption. We call them inconclusive situations.
2. We use VR to study how real humans behave when avoiding vir-tual groups of changing size and density. We corroborate our theoretical study: humans behave as predicted by the PME. In addition, we take interest in results obtained for inconclusive sit-uations. We demonstrate that decision changing, between going around and going through, is made according to some individual threshold, and that this threshold can be influenced by secondary factors such as the appearance of the group, or relative direction of motion.
3. We build on the results of both our theoretical and experimen-tal studies. We propose an algorithm to imitate humans in their decision to go around or through a group of people, with few intuitive parameters.
Altogether, these contributions enable us to design the first model of local interactions in crowds (between individual and groups) fully val-idated through a VR-based study. The paper is organized as follows. Section 2 presents related work. Section 3 presents our study on effort as a main factor to decide on a strategy to avoid a group of people. Section 4 presents a behavioral study conducted in Virtual Reality to confirm our results, and to complete our results with the considering of secondary factors. Finally, Section 5 draws guidelines to integrate our results into crowd simulators, and demonstrates some results based on RVO2, before ending with the conclusion.
2 RELATED WORK
Virtual Reality has a wide range of applications ranging from games [37, 18] to the study of human behaviors [4, 9, 31, 20, 22] or even as a tool to provide health care services [14, 17]. The purpose of such applications may require immersing users in large environments. The quality of immersion, such as presence [33, 28], is improved when virtual characters are found wherever expected. Large environments require crowds of them. It is thus important to have virtual crowds of characters that act as close as possible as real people to keep a high sense of presence[21, 8].
Crowd simulators offer solutions to populate virtual environments. Microscopic models are the most adequate for this purpose, various approaches are to be found in the literature: rule-based [26], cellu-lar automatons [27], social forces [13] and velocity based [3]. All these approaches simulate individual agents. In the real world, groups (families, couples, friends,...) are often more frequent than isolated individuals [1].
Many studies have been performed to integrate groups in simula-tions to enhance realism of the simulated crowd [24, 16, 7]. Focus is typically given to group formations, leaving the question of the in-teraction (e.g., collision avoidance) between individuals and groups unanswered. One reason is that there is a little knowledge about such interactions. Analysis is required to extend these approaches, but cap-turing and observing corresponding behaviors is difficult. Our paper considers Virtual Reality as a powerful mean to lead study on indi-vidual behaviors in crowds, to extend knowledge on interactions with groups and to extend simulation algorithms accordingly.
We focus on the individual decision to go around or to go through a group. Our approach is a 2-stage one. In a first stage, we apply the Principle of Minimum Energy as a main criterion in such decision taking. It has been shown that humans often follow the least effort principle for a multitudes of different behaviors [36]. PME has al-ready been applied on avoidance behaviors in [11]. There are major differences in the way our paper considers PME in avoidance situa-tions. Guy et al. use PME to find the best local adaptation amongst a set of valid ones. Only collision avoidance between individual agents is considered. In contrast, our paper considers interactions between
individual and groups, we use PME to compare avoidance strategies. The energetic consumption is evaluated for global solution paths.
Real observations are required to perform crowd simulator calibra-tion and assessment [34, 15]. Data can be recorded in a real envi-ronment (ecological dataset). For example, metrics defining group formations have been extracted from such observations [6, 23]. How-ever, the exact conditions of interactions between people are often unknown in such datasets (e.g., motivations, constraints or relations between people). In complement, laboratory datasets are useful to complete such studies with more control over the studied situation and more accurate kinematics data. They are useful to understand human motion control mechanisms [19, 25] or to evaluate existing models [30]. However, such data are expensive to acquire and complex sit-uations remain hardly controllable and repeatable. This is especially true for crowd motion studies which require many participants. To this end, VR-based experimental platforms offer a convenient control over experimental factors and parameters. Part of real subjects can be re-placed by virtual ones. We can expose a population to precise stimuli allowing us to analyze very specific behaviors. Logically, VR was pre-viously used to perform studies on motion control or interactions with virtual humans[10, 9]. Our paper use VR to corroborate the theoret-ical PME-based analysis with real human behaviors facing situations of avoiding a virtual group. In comparison with those previous studies, to our knowledge, our study is the first to consider individual motion behaviors in crowds for the purpose of extending crowd simulation algorithms.
3 PRINCIPLE OFMINIMUMENERGY: A SIMULATION STUDY
An individual walker has two solutions to avoid a group he crosses during his travel: either he goes through it or around it. Going around a group results into a longer travel path whereas going through asks the walker to perform local adaptations maneuvers, i.e., successive changes of speed and orientation. Both strategies raise additional ener-getic cost along the travel path. How significant are those differences? Do these differences explain human behavior? This section answers the first question.
Group size and density change the length of the path going around the group, as well as the number of local interactions when going through the group. They are both fundamental factors of our study. To evaluate and compare the energy cost of avoidance strategies, we need to have examples of the two kinds of avoidance paths, going around or going through ones, performed under various conditions of group size and density. To face the obvious difficulty to obtain empirical data, we use simulation tools to synthesize data.
Our approach is the following. In simulations, we set situations of interactions between individuals and groups. For each situation, we first simulate the agent going through the group, and then we force him to go around. We record the two kinds of resulting trajectories, evaluate their energetic cost and compare them. Method and Results are detailed below.
3.1 Method
Simulations are based on the RVO2 algorithm [3]. RVO2 considers interaction between individual agents only. Interactions between indi-viduals and groups will naturally result into a going-through strategy. To compare with the going around strategy, we extended RVO2 to force going-around behaviors as suggested in [35]: the group is sim-ulated as a single ’big’ agent with a large radius. The initial setup situation is illustrated in figure 2. All agents comfort speed was set to 1.33m.s−1. The shape of the group was defined as a circle. The positions of agents inside the group are computed randomly according to a Poisson distribution. We considered the following factors values to simulate interactions between the individual agent and the group:
• Group size: the group circle radius varied from 1m to 11m with a 0.5m step (21 different values).
• Group density: Density is expressed as the mean distance be-tween agents. Interpersonal distance bebe-tween agents varied from 0.75m to 3.75m with a 0.05m step (61 different values).
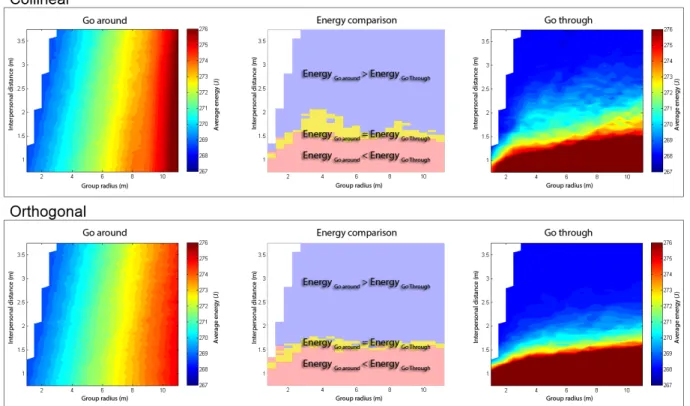
Fig. 3. Energetic cost of paths performed to avoid a group for collinear (Top) and orthogonal (Bottom) relative movements. Graphs on the left and right show respectively the average energy consumed by going around trajectories (Left) or going through trajectories (Right) according to group sizes and group interpersonal distances. Graphs on the middle show the results of the Wilcoson signed-rank tests which compare the energetic costs for both decisions. Significant differences between both decisions are illustrated in red when going around the group is less costly than going through it, in blue when going around the group is more costly than going through it. When there is no significant difference, the result of the comparison is shown in yellow.
• Group relative movement: the individual agent and the group had orthogonal or collinear trajectories (initial distance to the cross-ing point was 40m in both cases).
We studied all the possible combinations of factors values, i.e., 2562 situations. When interpersonal distance is superior to the group size, groups consist of 1 member only. These irrelevant situations were removed from our study (212 removals). For each situation, there can be variations in the energetic cost of avoidance paths depending on the placement of the agents in the group, especially when going through given the exact interactions occurring there. We averaged this cost by calculating the 50 different distributions for agents’ positions in group and by simulating one go-around path and one go-through path for each of the 50 distributions.
In the end, our simulations resulted into two sets of 117500 paths each (going around vs. going through sets, made of 50 paths for 2350 situations each). The energetic cost evaluation was performed for each path based on the equation proposed by [32]:
E= m
Z
(es+ ew|v|2)dt (1)
where m is the mass of a person, v the instantaneous speed and esand
eware constants. The energy is computed only to be compared with
each other to find the trajectory that minimize the energy consumption, the mass has no influence on such computation and has been set to m= 1kg. The two constants have been set to es= 2.23J.Kg−1.s−1and
ew= 1.26J.s.Kg−1.m−2 which are values given by [32] to represent
the average human.
We used the Wilcoxon signed-rank tests to compare sets of going around and going through paths computed under identical conditions.
3.2 Results
Figure 3 shows the average energetic cost of simulated paths depend-ing on group size and interpersonal distance. Left and right plots are respectively for go around and go through paths. Collinear (top) and orthogonal (bottom) relative movements are displayed separately. The figure also summarizes the statistical results (middle) from the com-parison between the energy spent with go around or go through strate-gies.
The energy graphs highlight how energetic cost varies with respect to group size and interpersonal distance. The cost of going around increases with the group size. This was expected because larger groups result in longer avoidance paths. The cost of going through decreases with an increase of the group interpersonal distance. This was also expected as the decrease of distance result in denser groups and more numerous people to be locally avoided one after the other. Note that an increase of the group size also results into more local avoidances and in an increase of the path cost, but in smaller amounts.
The comparison test results between go through and go around paths is reported in figure 3. Three cases can be distinguished. The red area corresponds to when going around is significantly less costly than going through. Conversely, the blue area corresponds to when going through is significantly less costly than going around. Finally, the yellow zone corresponds to a transition zone from the red to the blue: there, no significant difference in energy between going through and around is found.
3.3 Discussion
Our results show that, considering the energetic cost of collision avoid-ance paths, the PME can suggest clear strategies: walkers have strong interest in going through large and sparse groups, and conversely,
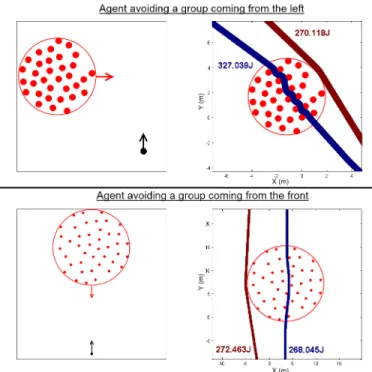
go-Fig. 4. Conditions for the experiment on group avoidance.Top: spacing between the characters of the group was: {1.1, 1.4, 1.7, 2, 2.3}m. Bottom left: participants avoided a group coming from: left, front or right. Bottom right: the visual appearance of the characters of the group was: ordinary
people, soldiers or zombies.
Fig. 2. Simulation setting with one agent avoiding a group on an orthog-onal or collinear trajectory. On the left, the starting position with move-ment direction. On the right, example of computed trajectories relative to the group (For the top: group radius=3, interpersonal distance=0.8, for the bottom: group radius=8, interpersonal distance=2)
ing around small and dense groups of people. However, the PME is unable to determine a better strategy for some combinations of group size and interpersonal distance. These are called inconclusive situa-tions.
In the next section, we propose a study with a twofold objective. Using VR, we observe interaction between real individuals and groups of people. We first check that users behave as predicted by the PME. We expect that users will choose their strategy to go through or around a group in accordance to PME results for situations picked in the red or the blue areas of figure 3. Second, we examine the role of secondary factors in inconclusive situations.
4 GROUPS AVOIDANCE: AVR-BASED USER STUDY
4.1 Objectives
In the previous section we showed that PME is a relevant decision cri-terion for individual to set avoidance strategies during avoidance with groups. However, several questions remain: do humans behave as dic-tated by the PME? How do they make a transition in the inconclusive situations (where PME cannot distinguish one best strategy)? Do some non-physical factors influence avoidance strategies?
An obvious way to answer these questions is to replicate some of the previously studied situations. It is not trivial to get a group of people to walk in a perfectly controlled way, or to accurately replicate similar situations for several subjects. For these reasons, we decided to con-duct our study using an immersive virtual reality platform: individual subjects interact with groups of virtual agents. We picked several sit-uations considered in the PME study, some where going around is the best strategy, some where going through is the best one, and finally some where PME cannot determine a best option. For the two first kinds of situations, we expect subjects to behave as predicted by our previous study. We inspect how there is a sudden or a smooth change in their strategy for the latter kind of situations. Beyond physical fac-tors, we also consider the effect of a social factor. We consider the role of the visual appearance of the group on the avoidance decision. Two hypotheses are tested: humans try not to go between people that have a visually perceptible social link and they try to stay out of groups that have a repulsing aspect. Our baseline condition is groups with ordi-nary aspect: ordiordi-nary groups are made of virtual men and women with individual appearance each (cloth, hair, skin). To give groups a repuls-ing appearance, we composed them with virtual zombies (see fig.4). Finally, to visually exhibit social links in groups, we composed them with soldiers.
4.2 Materials and Methods
Fig. 5. Pictures of the experiment showing participants navigating with a joystick in a VR environment and avoiding virtual agents.
Participants 13 people (1 woman, 12 men) volunteered for this experiment. They were 28.4 (±7.5) years old (range: 23 to 52). They
were naive with respect to the purpose of the experiment. All had normal or corrected-to-normal vision. They gave written and informed consent and the study conformed to the declaration of Helsinki.
Apparatus Experiments took place in the 4-screen Computer As-sisted Virtual Environment (CAVE) as illustrated on figure 5, equipped with 13 projectors, 15MPixels resolution in total, 9m large, 3m high and 3m deep. 3D environment display and character anima-tion were designed in the Unity game engine. Multi-surface ren-dering was performed by the MiddleVR plugin. Active stereoscopy was achieved with Volfony ActiveEyes Pro Radiofrequency wearable glasses. Glasses were tracked by an ART tracking system made up of 16 cameras. Participants were standing in the CAVE and were im-mersed in a first person perspective in a street-like virtual environment. They were given a joystick to control their virtual motion. The longi-tudinal axis of the joystick controls speed linearly from 0.8m.s−1to 2.0m.s−1. The lateral axis control the angular rotation speed linearly from −25deg.s−1to 25deg.s−1. When the joystick is in rest position (nobody is touching it), the speed is 1.4m.s−1and the angular rotation speed is 0deg.s−1.
Task Participants were asked to go to a visible target (a gate in the wall in front of them, see figure 4). They were asked to move like they would have done in real conditions, especially they should try to avoid any collision with the virtual characters walking in the environ-ment. The task was described to participants using slides with images and text. First, they trained with the joystick in a dedicated environ-ment. Then, they performed the experimental task 6 times before we began recording data. At the end of the experiment, participants filled a questionnaire to report their feedback.
Conditions We fixed the virtual group radius to 3m. We reuse two factors (interpersonal distance and group relative movement) from the PME experiment. We introduced a new factor in this experiment on visual appearance. Factors are illustrated in figure 4. We considered the following conditions:
• Interpersonal Distance: the distances between characters in groups were: {1.1, 1.4, 1.7, 2, 2.3}m. With a group of 3m radius, 1.1 and 2.3 corresponds to situations where PME has a well de-fined optimized strategy while 1.4, 1.7 and 2 are distances from the inconclusive zone.
• Group relative movement: participants interacted with groups coming from the front (Collinear motion), or from the left or the right (Orthogonal motion). We did not distinguish the left and right conditions in our analysis. There were as many repetitions from the front as from the left plus the right.
• Appearance of the group: we used various 3D shapes and tex-tures for virtual characters. We studied groups made of ordinary people, zombies, and soldiers. They were all animated by a sin-gle walking cycle and soldiers had a synchronized walk.
In this study, we selected only one condition of group radius to avoid a huge number of repetitions for participants. The relative posi-tion of characters in the group was computed according to a homoge-neous Poisson distribution.
Plan There were 4 repetitions for each condition, i.e., 120 trials in total. They were presented in a randomized order. We recorded the trajectories performed by participants in the virtual environment.
Analysis Dependent variables were the percentages of trials for which real humans went around or through the group of virtual walk-ers. Each dependent variable was analyzed into separate 3-way anal-ysis of variance (ANOVA) with repeated measures on the following factors: interpersonal distance, character appearance and group rel-ative movement. Greenhouse-Geisser adjustments to the degrees of freedom were applied when appropriate, to avoid any violation of the sphericity assumption. The effect size was computed using partial eta squared (η2p). When appropriate, Bonferroni post-hoc tests were
used to further analyze significant effects between conditions. We also compared going around and going through strategies using Wilcoxon signed-rank test to evaluate the preferred strategy across participants.
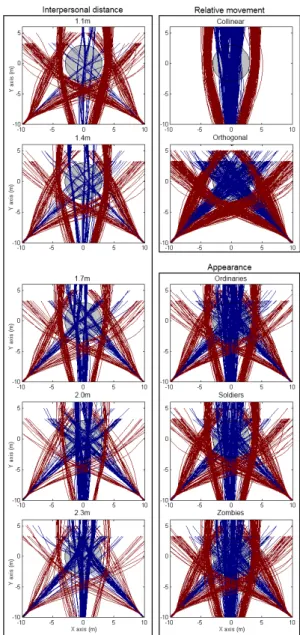
Fig. 6. Participants’ trajectories relative to the group position (gray circle) with respect to experimental conditions: interpersonal distance (left), di-rection (top right) and appearance (bottom right). Going around trajec-tories are displayed in red. Going through trajectrajec-tories are displayed in blue.
4.3 Results
Figure 6 illustrates all the trajectories performed in the virtual envi-ronment by the participants, going towards the gate while avoiding collisions with a group of walkers. Virtual trajectories are grouped by conditions of interpersonal distances, relative motion, and appearance. Trajectories are plotted relatively to the moving group position to eas-ily distinguish going through from going around paths. From these trajectories, we can already notice a switch in strategy from 1.1m inter-personal distance to 2.3m which corroborates the PME results. There are visually no real differences between collinear or orthogonal rela-tive movement or among the different appearances.
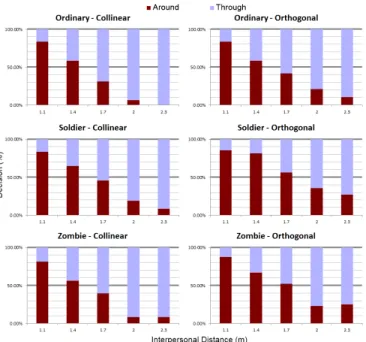
The quantitative results concerning the decisions made to go around or through the group during the interactions are summarized in fig-ure 7. Results showed that users performed more going around tra-jectories when the direction of the group motion was orthogonal to their own motion (54.1% of going around) than when it was collinear (44.2% of going around) (F(1, 12) = 7.33, p < 0.02, ηp2= 0.38).
Fig. 7. Proportion between going around and going through decisions per distance, over all trials.
around decisions than for zombies, and ordinary people (respectively 49% and 44%, F(1.3, 15.5) = 8.22, p < 0.01, ηp2= 0.41). Note that the difference between zombies and ordinary people is not signifi-cant. Finally, interpersonal distance had an effect on the user decisions (F(1.8, 21.5) = 26.46, p < 0.0001, η2p= 0.69). The percentage of
go-ing around trajectories w.r.t. distance was: 85,2% for 1.1m, 66.9% for 1.4m, 48.7% for 1.7m, 25% for 2m, and 19.9% for 2.3m. The behav-ior was not significantly different between 1.1m and 1.4m nor between 1.4m and 1.7m.
4.4 Discussion
As a main result to this experiment, we corroborate the strategies pre-dicted by the PME is representative of the observed users’ behavior. On average, whatever the other factors values, sparse groups are tra-versed by users in large proportions, and conversely, dense groups are avoided as a whole.
Subjects operate a smooth transition between those extreme groups density. Figure 8 gives a parallel view on the results of our 2 studies, we can see similar trends with the best strategy switching from going around to going through when the interpersonal distance grow bigger. On average, strategies are equally set when the group interpersonal distance is 1.7m. This situations as well as the surrounding ones (1.4m and 2m) belong to the inconclusive set of situations according to the PME.
Fig. 8. Decisions to go through or around amongst the participants and the energy spent in the same condition. For comparison purposes, we only consider decisions for ordinary group.
For intermediary density values, we revealed the importance of
rel-ative motion: effect is more important than what is predicted by the PME study. We believe that, even if situations are similar on the en-ergetic point of view, the situation is visually very different for users. The difference in the group motion perception may explain this dif-ference in the avoidance decisions set by users. Out of inconclusive conditions, when the difference of energy consumption is significant (according to the PME study), the difference concerning the relative proportion in users’ decisions is very clear (order of magnitude 80 vs. 20 % for extreme conditions of interpersonal distances).
Individual preferences were not a studied factor. Nevertheless, fig-ure 9 shows a variability in decision amongst participants. Such vari-ation amongst people is common [6, 12] and is even stronger between culture [29, 2].
Fig. 9. Proportion between going around and going through decisions per participant, over all trials.
As expected, we could influence the strategy set by users by play-ing on the visual appearance of groups. The result is clear for groups of soldiers, where a tendency to go around more often is observed. However, we did not obtain expected reactions to groups of zombies: they did not have any effect on participants in comparison with or-dinary people. Zombies are not real, which might have hindered the participants’ capacity to experience it as a real situation.
Finally, trajectories can also be a bias as the input device (a joystick in our experiment) is far from the actual walking action. This bias has been studied by [5]. But in our experiment we analyze the decision made and not the trajectory shape. Such a decision is mainly based on perception and is done pretty soon during the avoidance which should minimize the bias.
5 APPLICATIONS
Sections 3 and 4 provide us theoretical and experimental results on in-dividual strategies and decisions to avoid a group of walkers. Based on these results, we propose an algorithm for group avoidance deci-sion that selects the strategy that best fits the human one. This sec-tion presents the algorithm as well as an example of integrasec-tion to the RVO2 model ([3]).
5.1 Decision algorithm: Around or through the group?
The PME study has delimited three zones where the best strategy is well defined. The first zone concerns very small groups, below 2m ra-dius, that are so small that going around is always a good strategy. For the groups that are bigger, there is a zone with interpersonal distance below 1.35m where going around is better and a zone with interper-sonal distance above 2.05m where going through is better. Between these two zones, the user case study has shown that the decision rate goes from a majority of people going around the group to a majority of people going through the group between 1.1m and 2.3m interper-sonal distance. Figure 7 show that this evolution is linear and the user case study has highlighted personal preferences as a reason for this linear evolution. Moreover, the group’s appearance and the relative movement have both demonstrated some influence over this decision.
From these results, we developed the algorithm 1. This algorithm takes as input both an agent and a group and returns a Boolean an-swering the question whether the agent should cross the group or go
input : agentID, groupID
output: true if the agent should cross the group, false otherwise // test
if groupSize(groupID) < 2 then return false;
// Get the personal preference of the agent ρa← getAgentThreshold(agentID);
// Get the visual factor of the group
Gvu← getGroupVisualFactor(groupID) ; // Gvu∈ [0 : 1]
// Compute the relative movement factor # » dira← getAgentDirection(agentID); # » dirg← getGroupDirection(groupID); Gθ← 1 − # » dira.dir# »g ; // Gθ ∈ [0 : 1] // Compute threshold and choose strategy threshold← ρa+ Gvu.Cvu+ Gθ.Cθ;
if groupInterDistance(groupID) < threshold then return false;
return true;
Algorithm 1: Function that select a strategy to avoid a specific group for a specific agent
around. If the group size is less than 2m than the strategy is to go around as hinted by the PME study. Otherwise, a specific threshold is computed according to the agent own preference ρa, the group
appear-ance score Gvuand the relative motion score Gθ. Both appearance and
relative score measure the effect of these factors on the threshold. For example, a group of soldier will have the highest effect on the thresh-old with an appearance score of 1. The relative motion score goes from 0 to 1 with 0 being collinear and 1 being orthogonal. For the three pa-rameters: the personal preference ρa, the appearance maximum effect
Cvuand the relative movement maximum effect Cθ, we propose default
values based on our best guest from our previous results. To represent the variability in decisions between people and the linear progression seen in figure 7, the ρde f ault was set by a uniform distribution from
1.3m to 2.1m. We set Cvu= 0.15m, by considering that soldiers have
the highest effect from group appearance, and Cθ= 0.06m.
5.2 Integration in RVO2
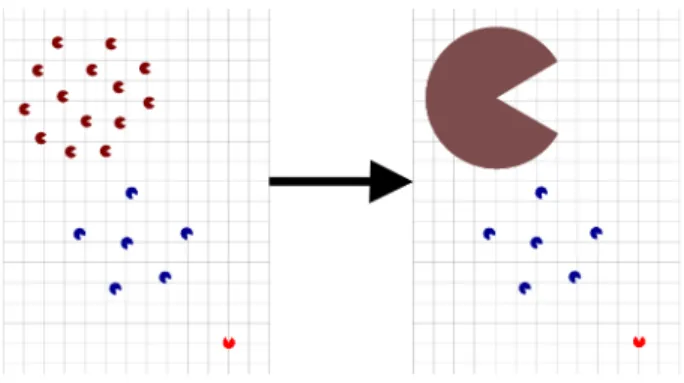
The algorithm we proposed determines individual decisions to avoid a group of walkers depending on several factors. It appeared to be easy to combine it with existing crowd simulation models to adapt their avoidance behavior to groups. To prove the feasibility of such an adaptation, we proposed to combine our decision algorithm with RVO2 model. This model deals with local interactions and was not designed to consider groups as a whole. The objective here was then to define in the simulation which agents should be merged into a group to be avoided by going around it. The first adaptation was to include a group criterion. It was based on [35]. When agents are identified as part of a group, all of them are replaced by a single ’big’ proxy agent, as presented in figure 10. The proxy agent current speed was set as the average speed of all agents of the group. In that way, the group is avoided as a whole and agents of the group are not considered indi-vidually with succession of local avoidances: the resulting avoidance trajectories will go around the whole group instead of going through the group around each individual agent.
To improve the trajectories performed to avoid a group (by going around the group), we also proposed another adaptation. Indeed, when avoiding large obstacles, the resulting trajectory can be jerky if the adaptation is performed too late. In such a case, walkers need to adapt their motion earlier to go around the group while keeping a smooth trajectory. To consider this point, we adjusted the timeHorizon param-eters of RVO2 which defined how soon an agent should avoid other
Fig. 10. On the left: the situation as it really is, on the right: the situation as it is perceived by the red agent (All the blue agents are seen as one big agent because they are considered as a group while the green ones are too far from each other to be considered as a group)
agents. We defined it as a factor of the size of the agent or proxy agent to avoid, allowing sooner avoidance when interacting with larger groups.
Results of the combination of RVO2 with the decision algorithm are presented in the companion video. An example of RVO2 behav-ior after its combination with our decision algorithm is illustrated on figure 11. On the left, the purple agent goes through the group, only considering local interactions. After combining RVO2 with the deci-sion algorithm (on the right), the purple agent avoids all the red agents as part of a whole group instead of trying to go through it.
Fig. 11. Example of avoidance decision made by the purple agent. The agent goes through the very dense group in RVO2 while going around it in the modified RVO2.
5.3 User-study evaluation
We integrated our decision algorithm in RVO2 simulation model. The objective of this study is to check if our decision algorithm is able to improve the visual quality of crowd simulation results. To this end, we proposed a subjective evaluation based on a perceptual user study: we asked some participants to compare simulation results from ROV2 only with ones from RVO2 extended with our algorithm. 10 male participants volunteered for this experiment. They were 28.3 (±4.7) years old (range: 24 to 40). They were naive with respect to the pur-pose of the experiment. All had normal or corrected-to-normal vision. They gave written and informed consent and the study conformed to the declaration of Helsinki.
We prepared 4 situations (20s each) where one single agent walks counter flow in front of a crowd of walking people. This crowd was made up of individuals and groups of various densities. For each sit-uation, agent motion was simulated both with RVO2 and with RVO2 combined with the decision algorithm, creating 2 video stimuli. Partic-ipants were seated in front of a desk (cf. figure 12). Stimuli were
dis-played on a 24inches screen. Participants were asked to observe suc-cessively the 2 video stimuli and to evaluate which one complies the most with the decision they would have made as a single walker avoid-ing other people in the same conditions. The 2 video were made from a third person view point to give participants a good view of the situation as the computer screen limits greatly the field of view of a first person view point. In total, they repeated this task 20 times (4 situations*5 repetitions). Stimuli were presented in a randomized order. We com-pared the percentage of answers supporting RVO2 with respect to the percentage of answers supporting RVO2 combined with the de-cision algorithm using a Wilcoxon signed-rank test. Results showed that RVO2 combined with the decision algorithm was perceived as more compliant with decisions a human would have used to avoid people than RVO2 alone (RVO2+Decision algorithm= 77.5% ± 17.36, RVO2= 22.5% ± 17.36, Z = 2.66, p < 0.01). The participants were asked which criteria they used to choose between the two video stim-uli. Some answers are transcribed below; globally people chose what seems to be the most natural motion for them. Trying to go through a dense group is the main reason that breaks the naturalness of the mo-tion, according to the commentary 3 below, splitting small group is worse than having weird trajectories.
1. I chose according to what the path I would have selected for my own motion.
2. Avoiding most of dense crowds seems more natural.
3. Splitting small groups is a deal-breaker (happened in some cases where trajectories were actually better than other solution)
4. My criteria would change according to the density (homoge-neous or heteroge(homoge-neous). In homoge(homoge-neous density, the behavior ”I go directly toward the goal” seems more realistic as there were no visible group to break. In heterogeneous density, I preferred the other behavior that seems to preserve the groups from the other agents.
This result is promising and shows that including our decision algo-rithm to existing crowd simulator will improve their level of realism. The commentary 4 highlighted a difference for homogeneous and het-erogeneous density. In higher density situation, people get closer to each other leading to smaller personal space and less visible groups. It is fair to say that this could greatly influence the group avoidance strat-egy. The experiment done in this paper was done with no other agent then the group members to be able to consider only the interaction with the group. But experiments in high density are also needed to check how the environment around the groups influences this group avoid-ing behaviors. Beyond that, our perception study shows that spectators perceive improvements on simulation results, and find them more nat-ural. Some people find that the reaction facing a group can be even more important than the avoidance trajectory itself for realism. This demonstrates the need for improving the ability of crowd simulators to deal with more complex situations of interactions.
Fig. 12. Experimental setup to evaluate the decision algorithm.
6 CONCLUSION
In this paper, we study interaction between individuals and groups; we focus on strategies set by individuals to go through or around a group of people. We extend the use of the Principle of Minimum En-ergy from choosing local speed variation to selecting global avoidance strategy. We confirm the influence of the energy factor, in this specific situation, and complete its results with an experiment where real indi-viduals were interacting with different groups. We also highlight, with the experiment, two secondary factors that influence the chosen strat-egy: the relative motion and the visual aspect of the group. We propose an algorithm to simulate realistic avoidance strategies between indi-viduals or groups. We also integrate our results in an existing crowd simulator and demonstrate that spectators can perceive some improve-ment in the crowd animation.
This work opens various perspectives. We propose to use VR as a new method to gather observation on crowd behaviors and local inter-actions in crowds. We show its strength and how it can help to better understand complex interactions that are hard to study using regular observation gathering method: only one subject is required to observe behaviors in crowds, we have no technical difficulty with tracking, we can perfectly control complex experimental conditions. Especially, crowd simulation has only considered interactions between individ-uals for too long, real situations of interactions in crowds are often much more complex. We focused on interactions between individuals and groups. Our results also reveal how humans process and simplify interactions, e.g., by considering a group of many as a whole. We need to continue performing experiments on individual behaviors in crowds: simulators would widely benefit from conclusions about the way people in crowds filter, select and combine the numerous interac-tions they have. We expect large improvement of microscopic crowd simulation algorithm in the near future thanks to next iteration of ex-periments to come based on our VR-based experimental facility.
ACKNOWLEDGMENTS
This work is funded by the French National Research Agency ANR, project PERCOLATION number ANR-13-JS02-0008.
REFERENCES
[1] A. F. Aveni. The not-so-lonely crowd: Friendship groups in collective behavior. Sociometry, 40(1):96–99, Mars 1977.
[2] C. Beaulieu. Intercultural study of personal space: A case study. Journal of Applied Social Psychology, 34(4):794–805, 2004.
[3] J. Berg, S. Guy, M. Lin, and D. Manocha. Reciprocal n-body colli-sion avoidance. In C. Pradalier, R. Siegwart, and G. Hirzinger, editors, Robotics Research, volume 70 of Springer Tracts in Advanced Robotics, pages 3–19. Springer Berlin Heidelberg, 2011.
[4] B. Bideau, R. Kulpa, N. Vignais, S. Brault, F. Multon, and C. Craig. Using virtual reality to analyze sports performance. Computer Graphics and Applications, IEEE, 30(2):14–21, 2010.
[5] G. Cirio, A. Olivier, M. Marchal, and J. Pettre. Kinematic evaluation of virtual walking trajectories. IEEE Transactions on Visualization and Computer Graphics, 19(4):671–680, 2013.
[6] M. Costa. Interpersonal distances in group walking. Journal of Nonverbal Behavior, 34(1):15–26, 2010.
[7] L. Crociani, A. Gorrini, and G. Vizzari. Pedestrian dynamics in presence of groups: an agent-based model applied to a real world case study. 2014. [8] C. Ennis and C. O’Sullivan. Perceptually plausible formations for vir-tual conversers. Comput. Animat. Virvir-tual Worlds, 23(3-4):321–329, May 2012.
[9] P. W. Fink, P. S. Foo, and W. H. Warren. Obstacle avoidance during walking in real and virtual environments. ACM Trans. Appl. Percept., 4(1), Jan. 2007.
[10] M. Garau, M. Slater, D.-P. Pertaub, and S. Razzaque. The responses of people to virtual humans in an immersive virtual environment. Presence: Teleoper. Virtual Environ., 14(1):104–116, Feb. 2005.
[11] S. J. Guy, J. Chhugani, S. Curtis, P. Dubey, M. Lin, and D. Manocha. Pledestrians: A least-effort approach to crowd simulation. In Proceedings of the 2010 ACM Symposium on Computer Animation, pages 119–128, 2010.
[12] L. A. Hayduk. Personal space: Where we now stand. Psychological bulletin, 94(2):293, 1983.
[13] D. Helbing, I. Farkas, and T. Vicsek. Simulating dynamical features of escape panic. Nature, 407(6803):487–490, 2000.
[14] B. Herbelin. Virtual reality exposure therapy for social phobia. PhD thesis, Ecole Polytechnique Federale de Lausanne, 2005.
[15] M. Kapadia, M. Wang, S. Singh, G. Reinman, and P. Faloutsos. Sce-nario space: Characterizing coverage, quality, and failure of steering al-gorithms. In Proceedings of the 2011 ACM Symposium on Computer Animation, pages 53–62, 2011.
[16] I. Karamouzas and M. Overmars. Simulating and evaluating the local be-havior of small pedestrian groups. Visualization and Computer Graphics, IEEE Transactions on, 18(3):394–406, 2012.
[17] J. H. Kwon, C. Alan, S. Czanner, G. Czanner, and J. Powell. A study of visual perception: Social anxiety and virtual realism. In Proceedings of the 25th Spring Conference on Computer Graphics, SCCG ’09, pages 167–172, New York, NY, USA, 2009. ACM.
[18] A. Lecuyer, F. Lotte, R. Reilly, R. Leeb, M. Hirose, and M. Slater. Brain-computer interfaces, virtual reality, and videogames. Computer, 41(10):66–72, Oct 2008.
[19] S. Lemercier, A. Jelic, R. Kulpa, J. Hua, J. Fehrenbach, P. Degond, C. Appert-Rolland, S. Donikian, and J. Pettr´e. Realistic following be-haviors for crowd simulation. Comp. Graph. Forum, 31(2pt2):489–498, May 2012.
[20] H. A. Mallot, S. Gillner, H. A. van Veen, and H. H. B¨ulthoff. Behavioral experiments in spatial cognition using virtual reality. In Spatial cognition, pages 447–467. Springer, 1998.
[21] R. McDonnell, M. Larkin, B. Hern´andez, I. Rudomin, and C. O’Sullivan. Eye-catching crowds: Saliency based selective variation. In ACM SIG-GRAPH 2009 Papers, SIGSIG-GRAPH ’09, pages 55:1–55:10, New York, NY, USA, 2009. ACM.
[22] B. J. Mohler, S. H. Creem-Regehr, and W. B. Thompson. The influence of feedback on egocentric distance judgments in real and virtual environ-ments. In Proceedings of the 3rd symposium on Applied perception in graphics and visualization, pages 9–14. ACM, 2006.
[23] M. Moussaid, N. Perozo, S. Garnier, D. Helbing, and G. Theraulaz. The walking behaviour of pedestrian social groups and its impact on crowd dynamic. PLoS ONE, 5(4), 2010.
[24] S. R. Musse and D. Thalmann. A model of human crowd behavior: Group inter-relationship and collision detection analysis. In Workshop Computer Animation and Simulation of Eurographics, pages 39–52, 1997. [25] A.-H. Olivier, A. Marin, A. Cr´etual, A. Berthoz, and J. Pettr´e.
Colli-sion avoidance between two walkers: Role-dependent strategies. Gait & Posture, 38(4):751 – 756, 2013.
[26] C. W. Reynolds. Flocks, herds and schools: A distributed behavioral model. SIGGRAPH Comput. Graph., 21(4):25–34, Aug. 1987. [27] A. Schadschneider. Cellular automaton approach to pedestrian
dynamics-theory. In Pedestrian and Evacuation Dynamics, pages 75–86, 2001. [28] M. J. Schuemie, P. van der Straaten, M. Krijn, and C. A. van der Mast.
Research on presence in virtual reality: A survey. Cyberpsychology and Behavior, 4(2):183–201, 2001.
[29] A. Seyfried, M. Boltes, J. Khler, W. Klingsch, A. Portz, T. Rupprecht, A. Schadschneider, B. Steffen, and A. Winkens. Enhanced empirical data for the fundamental diagram and the flow through bottlenecks. In Pedes-trian and Evacuation Dynamics 2008, pages 145–156. Springer Berlin Heidelberg, 2010.
[30] A. Seyfried, B. Steffen, W. Klingsch, T. Lippert, and M. Boltes. The fun-damental diagram of pedestrian movement revisited empirical results and modelling. In Traffic and Granular Flow’05, pages 305–314. Springer Berlin Heidelberg, 2007.
[31] W. H. Warren and B. R. Fajen. Optic Flow and Beyond, chapter From optic flow to laws of control, pages 307–337. Kluwer (Editors: L. M. Vaina, S. A. Beardsley, and S. Rushton), 2004.
[32] M. W. Whittle. Gait analysis: an introduction. Elsevier, 2003. [33] B. G. Witmer and M. J. Singer. Measuring presence in virtual
environ-ments: A presence questionnaire. Presence: Teleoper. Virtual Environ., 7(3):225–240, June 1998.
[34] D. Wolinski, S. J. Guy, A.-H. Olivier, M. Lin, D. Manocha, and J. Pettre. Parameter estimation and comparative evaluation of crowd simulations. Compter Graphics Forum: Eurographics 2014 special issue, 33:1–10, 2014.
[35] H. Yeh, S. Curtis, S. Patil, J. van den Berg, D. Manocha, and M. Lin. Composite agents. In Proceedings of the 2008 Symposium on Computer
Animation, pages 39–47, 2008.
[36] G. K. Zipf. Human Behaviour and the Principle of Least-Effort. Addison-Wesley, Cambridge MA, 1949.
[37] M. Zyda. From visual simulation to virtual reality to games. Computer, 38(9):25–32, Sept 2005.