HAL Id: hal-02288760
https://hal-amu.archives-ouvertes.fr/hal-02288760
Submitted on 16 Sep 2019
HAL is a multi-disciplinary open access
archive for the deposit and dissemination of
sci-entific research documents, whether they are
pub-lished or not. The documents may come from
teaching and research institutions in France or
abroad, or from public or private research centers.
L’archive ouverte pluridisciplinaire HAL, est
destinée au dépôt et à la diffusion de documents
scientifiques de niveau recherche, publiés ou non,
émanant des établissements d’enseignement et de
recherche français ou étrangers, des laboratoires
publics ou privés.
On the Decay of the Triplet State of Thionucleobases
Shuming Bai, Mario Barbatti
To cite this version:
Shuming Bai, Mario Barbatti.
On the Decay of the Triplet State of Thionucleobases.
Physical Chemistry Chemical Physics, Royal Society of Chemistry, 2017, 20, pp.12674-12682.
�10.1039/C7CP02050C�. �hal-02288760�
On the Decay of the Triplet State of Thionucleobases
Shuming Bai* and Mario Barbatti*
Singlet oxygen production upon photosensitization plays a critical role for drugs based on thionucleobases. While for immunosuppressants its yield must be near zero, for phototherapeutic drugs it should be near the unity. In this work, we apply high-level quantum chemical modelling to investigate the decay of the triplet state of thionucleobases, a main determinant of the singlet oxygen yield. Working on CASPT2 optimizations of two prototypical thiothymines (2-thiothymine and 6-aza-2-(2-thiothymine), we showed that the T1 state is characterized by two ππ* minima and by the
intersection of T1 to the singlet ground state. On the basis of this topography, we propose a two-step mechanistic model,
which, depending on the energetic balance between the two minima, may have as determining step either a slow transition between minima or a faster intersystem crossing to S0. Chemical kinetics modelling, as well as simulation
of transient absorption spectra, confirmed that the two-step model can explain the experimental results available for both molecules. Moreover, through additional investigations of 2-thiocytosine and 6-thioguanine, we show that such T1
topography is a common theme for nucleobases. We also discuss how the triplet-state topography may be used to control the singlet oxygen yield, aiming at different medical applications.
Introduction
Photoinduced processes in thio-modified nucleobase
derivatives have become an important investigation topic due to, on the one hand, the use of these substances as phototherapeutic agents2-5 and, on the other hand, their
carcinogenic effects on patients taking them as
immunosuppressants.6-8 In both cases, the key chemical event
is the production of singlet oxygen species, which is beneficial in the former, but harmful in the latter. Thus, from a molecular-design point of view, a major goal in this field has been to synthesize new thiothymine derivatives with tunable singlet oxygen yields. Diverse nucleobase analogues, differing by number and position of the substitutions, have been intensively investigated in both experimentalists and theoreticians, as recently reviewed in refs.9, 10 Even when the structures of these
thionucleobases are similar at a first glance, the substituents may significantly impact triplet quantum yields, intrinsic decay dynamics of triplet states, and molecular oxygen quenching, quantities directly related to the tuneability of the singlet oxygen yield.
In fact, many of the researched thionucleobase derivatives have triplet quantum yields near unity,1, 11 with fast population
transfer into the triplet manifold,12 sometimes occurring in even
less than 1 ps.13, 14 Naturally, such ultrafast sub-picosecond
intersystem crossing (ISC) is interesting on itself and has led to
diverse computational investigations on excited-state
topography11, 15-21 and dynamics.22, 23 Nevertheless, the
subsequent steps, especially the decay dynamics of the T1
triplet state, a property more directly related to the clinical application, has still not been addressed by theoreticians, likely due to the challenge of describing such long timescale processes occurring in the µs scale.1, 24
Even though thionucleobases tend to have high triplet quantum yields, their singlet oxygen yields may substantially differ. For instance, while for 2-thiothymine the singlet oxygen yield is 0.36, for 2,4-dithiothymine it raises to 0.46, and for 6-aza-2-thiothymine it doubles, reaching 0.69.1, 13 This implies that the
different singlet oxygen yields of these molecules should arise from distinct decay dynamics of their triplet states. Therefore, clarifying the mechanism of this dynamics is a fundamental step to guide future research on the molecular design of these species. Bearing that in mind, we have used high-level quantum chemistry and chemical kinetics modelling to unveil the fate of the triplet states in model thiothymines.
In the context of singlet oxygen production, we should first bring to attention the two possible fates of the triplet state of a photosensitizer (in our case a thionucleobase): the state may either decay spontaneously, recovering the singlet ground state (intrinsic decay), or it may be quenched by an oxygen molecule (quenched decay). Both fates may compete with each other in the same timescale.1 However, if the intrinsic triplet decay
lifetime turns out to be too short, there is not enough time for an oxygen molecule to react with the photosensitizer, reducing the singlet oxygen yield. The opposite is also true: if the intrinsic decay is too long, there is enough time for an O2-photosensitizer
encounter and reaction, increasing the singlet oxygen yield. Therefore, besides the reaction rate of singlet oxygen generation, the intrinsic triplet decay is a central chemical step
a.Aix Marseille Univ, CNRS, ICR, Marseille, France.
* Corresponding authors: shuming.bai@univ-amu.fr (SB); mario.barbatti@univ-amu.fr (MB).
†Electronic Supplementary Information (ESI) available: [details of any supplementary information available should be included here]. See DOI: 10.1039/x0xx00000x
controlling the singlet oxygen yield, and it should be well understood as the foundation for the research of oxygen quenching step.
From a more methodological standpoint, when we consider the triplet-decay dynamics of these molecules, we should take into account the following issues: first, we know from the experiments that the triplet lifetime, usually at µs timescale,1, 24
is much longer than the time for the ultrafast ISC initially populating the triplet manifold. Consequently, we may assume that the triplet-decay dynamics starts from an equilibrated T1
state, memoryless of the previous steps. Secondly, the long scale of the triplet-decay dynamics renders direct nonadiabatic dynamics simulations rather useless, as there is no possibility of propagating the equations of motion for micro-seconds. Therefore, this is a case where reaction rate theories are much more suited for.
In this work, we focus on the decay dynamics of the T1 state of
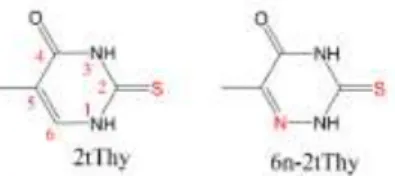
2-thiothymine (2tThy) and 6-aza-2-thiothymine (6n-2tThy). Both are shown in Figure 1. These two thiothymines have been chosen for the following reasons: first, they are prototypical thymine analogues, and conclusions for them can be extended to similar species. Secondly, they have been often investigated, and we can count on previous experimental results to draw comparisons and seek confirmation for our hypotheses.1, 13, 24-26 Last, although these two molecules are very close in structure— just a carbon atom replaced by a nitrogen at position 6—they have quite different triplet-decay dynamics, both intrinsic and quenched.1 Considering these three points, 2tThy and 6n-2tThy
make excellent subjects to research the mechanism of triplet decay in thiothymines.
Starting from CASPT2 optimizations of the T1 state and
complementing them with computation of reaction paths, estimates of activation energies, and simulations of transient absorption, we have built a complete mechanistic picture of the intrinsic triplet-decay dynamics of 2tThy and 6n-2tThy. It allowed us to rationalize the experimentally observed differences between them. Even more relevant, this mechanistic picture reveals the key elements to control the singlet oxygen yield of thiothymines in general, either to shut it down or to top it up, depending on the aimed application. In addition, we also discuss how general our conclusions are, by extending the investigation of the triplet state topography to two other thionucleobase prototypes, 2-thiocytosine and 6-thioguanine.
Computational details
Geometry optimizations and excited states were computed with the complete active space perturbation theory to the second order (CASPT2) in its multi-state (MS) version.27 The
active space was composed of 10 electrons in 7 orbitals (1n, 4, 2*, shown in the ESI, Section S1) using the ANO-RCC-VTZP basis set.28 Because, for our purposes, it is enough to consider
only three states in each multiplicity manifold (S0 to S2 and T1 to
T3), this active space works well, always reaching good
convergence. Standard IPEA (0.25 au)29 was globally adopted in
the CASPT2 calculations, and no level shift was used. Spin-orbit coupling (SOC) matrix elements were computed at CASPT2 level with an effective one-electron spin-orbit Hamiltonian from atomic mean field integrals.30 All these calculations were done
with Molcas 8.27 Cartesian coordinates for all optimized
structures are given in the ESI, Section S2. The T1 and T2 states
at the S0 minimum are also characterized in the ESI (Section S3).
Transient absorption spectra were simulated with the combined density functional theory / multi-reference configuration interaction (DFT/MRCI) method, originally developed by Grimme and Waletzke.31 This method has been
proved in a previous work to be an excellent approach for
thiothymines.15 The DFT calculations were done with
Turbomole.32 The MRCI calculations were done with the original
Hamiltonian, using the program developed by Grimme and Waletzke31 and recently updated by Lyskov et al.33 The original
parameters derived for BHLYP functional34 were used. Vertical
excitation energies and oscillator strengths were convoluted with normalized Gaussian functions (0.20 eV standard deviation) to obtain the simulated spectra.
Additional DFT and linear-response time dependent DFT (TDDFT) calculations were done with B3LYP,35, 36 CAM-B3LYP,37
and B97X-D38 functionals based on the 6-311G(d,p) basis set.39
They were carried out with Gaussian 09.40 Also complementary
linear-response algebraic diagrammatic construction to second order (ADC(2))41 and coupled cluster to approximated second
order (CC2)42 calculations, both with aug-cc-pVDZ basis set,
were done with Turbomole.
Singlet/triplet crossing points were optimized at CASPT2 level to an energy gap smaller than 0.02 eV, with an in-house modified version of CIOpt program.43
Phosphorescence (radiative) lifetime was calculated as:44, 45
𝜏𝑝ℎ𝑜𝑠=13∑ (−12 𝑐
3
𝑓𝑘Δ𝐸𝑘2)
𝑘=0,±1 (1)
where k=0,±1 refers to the three hyperfine components of the triplet state, fk is the calculated oscillator computed between
spin-orbit coupled states, and Δ𝐸𝑘 is the T1k/S0 emission
energy gap.
To investigate the rate determining step in our model, we needed to estimate the Gibbs free activation energy from the experimental rates under two different hypotheses, either supposing that the experimental rates corresponded to a crossing between T1 minima or supposing that those rates
corresponded to an ISC process.
The Gibbs energy for a crossing between minima (Δ𝐺𝑐𝑟𝑜𝑠𝑠‡ ) was
estimated using the Eyring equation:46
Figure 1 Structure and numbering of 2-thiothymine (2tThy) and 6-aza-2-thiothymine (6n-2tThy).
𝑘cross= 𝑘𝑏𝑇
h exp (−
Δ𝐺𝑐𝑟𝑜𝑠𝑠‡
𝑘𝑏𝑇 ) (2)
where kcross is the reaction rate at 300 K.
The Gibbs energy for ISC ( Δ𝐺𝑖𝑠𝑐‡ ) was estimated with the following quasi-Marcus formula:
𝑘𝑖𝑠𝑐= 2𝜋 ħ |𝐽𝑠𝑜𝑐| 2 1 √4𝜋𝜆𝑘𝑏𝑇exp (− Δ𝐺𝑖𝑠𝑐‡ 𝑘𝑏𝑇) (3)
where 𝐽𝑠𝑜𝑐 is the SOC at the T1/S0 crossing point and is the
reorganization energy, computed as the S0 energy difference
between the T1 minimum and the S0 minimum geometries (see
scheme in the ESI, Section S4.)
The rational for using Eq. 3 is the following. The ISC rate, described by the Golden rule, is determined by the SOC and the Franck-Condon-weighted density of states.47, 48 If we take the
harmonic vibrational approximation with the same frequencies for donor and acceptor states, this result is simplified to the conventional Marcus formula,49 as, for instance, employed by
Ou and Subotnik45 in the same context as ours, but for
benzaldehyde. In the Marcus formula, the activation free energy at the crossing point is extrapolated in a harmonic model with the help of the reorganization energy and the adiabatic free energy gap G0. This procedure renders the well-known
0
2 / 4G exponential argument. In our case, however,
the true crossing point can be directly optimized and the true (at our computational level) activation energy Δ𝐺𝑐𝑟𝑜𝑠𝑠‡ can be
used, replacing the approximated exponential argument. Thus, Eq. (3) should be especially accurate when the frequencies of the initial and final states are different and anharmonic effects are relevant. This is exactly the situation here, because, as we discuss later, T1 is composed of more than one diabatic
contribution.
Results and discussion
Minimum structures of the T1 state
The intrinsic decay dynamics of the T1 state is a long time
process.1, 24 Thus, the first important question we need to
address is what the T1 optimized structures are. Adopting
MS-CASPT2 to optimize the T1 state of 2tThy and 6n-2tThy, we
obtained two minimum structures for each of them. Their geometries are shown in Figure 2 along with some relevant geometric parameters.
Both molecules show similar minima. The first minimum features the sulfur atom strongly displaced out of the ring plane (op-S). The second minimum features a slight ring distortion with boat conformation involving atoms N3 and C/N6 (B3,6). The
op-S T1 minimum corresponds to a transition between and *
orbitals located at the C-S bond, as shown in Figure 3. The out-of-plane displacement of the sulfur takes place due to the population of the * orbital, which tends to change the hybridization character of C2 from sp2 into sp3. In the case of
the B3,6 T1 minimum, the electronic structure corresponds to a
* transition mainly located at C5-C/N6 bond (Figure 3). As usual, the * excitation of the aromatic ring induces an out-of-plane ring distortion.50
In spite of the qualitative similarity between the minima in the two molecules, there are some relevant distinctions: the sulfur displacement out of the ring plane in the op-S minimum is larger in 6n-2tThy than in 2tThy by 15° (Figure 3); the ring distortion
in the B3,6 minimum, measured by the Cremer-Pople parameter
Q,51 is smaller in 6n-2tThy than in the 2tThy by 0.133 Å.
These optimized triplet geometries are somewhat different from those described by Cui and Fang52 and Gobbo and Borin,21
but very close to the results of Mai et al.17 (In all these
references, the triplet minima are discussed only in the context of the initial ultrafast ISC process; the T1-state decay is not
addressed.) Cui and Fang52 optimized 2-thiouracil (2tUra) under
Cs constraint at CASSCF(16,11)/6-31+G* and obtained a planar
structure for T1, involving a * excitation at the C-S bond.
Planar structures were also obtained by Gobbo and Borin,21 who
optimized 6n-2tThy with CASSCF(16,11)/ANO-L-VDZP, to find two * triplet minima, one at the C-S another at the C5-N6 sites. The MS-CASPT2 optimizations of Mai et al.,17 with (12,9)
active space and cc-pVDZ basis set, resulted in two non-planar
T1 minimum structures for 2tUra, completely analogous to our
op-S and B3,6 minima. Moreover, T1 optimizations with
TD-B3LYP, ADC(2), and CC2 methods (geometries are given in the ESI, Section S6) also predict two non-planar structures similar to those obtained at CASPT2 level.
The reason we provide such a detailed account of the electronic and geometric structures of the two T1 minima is that their
relative energies is a key factor determining the fate of the T1
state, as we shall discuss. And exactly due to the importance of
Figure 3 The singly-occupied orbitals of the T1 state of 2tThy from CASPT2 calculation
at the op-S minimum (left) and at the B3,6 minimum (right). The equivalent orbitals for
6n-2tThy are shown in Section S5 of the ESI.
Figure 2 T1 minima including (a) out-of-plane S (op-S) and (b) boat-distorted (B3,6)
conformations of 2tThy and 6n-2tThy at CASPT2 level. In (a), the C/N6-N1-C2-S dihedral angle is indicated. In (b), the Cremer-Pople parameter Q, giving the ring puckering degree (in Å), is given as well. (Q = 0 corresponds to a planar structure.)
these relative energies, before moving into the discussion of the reaction mechanisms in the next sections, we will briefly describe how sensitive to the theoretical method these energies are.
To compare the effects from different quantum chemical methods, we used CASPT2, CASSCF, CC2, ADC(2), TDDFT, and
DFT methods to compute the T1 energy after linear
interpolation of internal coordinates (LIIC) between the two minima optimized at CASPT2 level. The results, collected in Figure 4, show that CC2 and ADC(2) are in very good agreement with CASPT2, which is taken here as the reference method. The differences between these three methods are within acceptable 0.1-eV margin.
CASSCF gives quite poor results, strongly overestimating the relative energy of B3,6 minimum by about 0.4 eV. In the case of
6n-2tThy, the CASSCF relative energies of the two minima are qualitatively wrong. To increase the active space up to (16,11) or to use CASSCF-optimized geometries does not improve this result significantly. The failure of CASSCF is not surprising on itself, as it has been known for a long time that the quality of the CASSCF excitation energy (for both, singlet and triplet states) is deeply dependent on the amount of ionic character of each state.53 Fortunately, CASPT2 corrects this unbalance,
providing excitations with uniform accuracy.53
TDDFT with B3LYP functional gives reasonable results for the reaction barrier of 2tThy starting from op-S minimum, but all other features are ill-described. In particular, TD-B3LYP strongly underestimates the relative energy of the B3,6 minima. This
underestimation is even larger with CAM-B3LYP and ωB97X-D functionals (not shown in the figure). DFT performs slightly
better than TDDFT for the same functional (B3LYP), but it is still not satisfactory as compared to the CASPT2 result.
These results confirm the importance of applying a high-level correlated method, to precisely describe the delicate balance between the energies of the two minima.
Description of the potential energy profiles
As discussed in the previous section, the T1 state of both
thiothymines has two minima, and to understand the decay of this state, it is worth mapping the other electronic states along the pathway connecting these minima. This is done in Figure 5, which shows LIIC energy profiles for S0, S1, T1, T2, and T3 states
between the two minima at CASPT2 level.
The character and energy of the first three triplet states imply that three diabatic states determine them, two 3* states and
a 3n* state involving the n orbital of S. The 3n* state and the
1n* (S1) are energetically close. The two 3* states are
strongly coupled, forming a double-well profile around the two T1 minima. Note that both minima have clear 3* character,
and the T1 state holds a dominant 3* character along the
whole potential energy profile. This characterization disproves the hypothesis raised by Kuramochi et al.1 that the strong
difference between the singlet oxygen yields of 2tThy and 6n-2tThy would be caused by a 3n* character of their T1 state.
According to the CASPT2 results, the energies of the two 3*
minima of 2tThy are nearly the same, with the B3,6 minimum
only 0.03 eV above the op-S minimum (Table 1). Meanwhile, in 6n-2tThy, the B3,6 minimum is 0.3 eV lower than the op-S
minimum. This phenomenon is related to the fact that the C=C bond is stronger than the C=N bond, leading to larger excitation energy of 3*(C5-C6) in 2tThy than of 3*(C5-N6) in 6n-2tThy.
This strong difference of relative energies between the two
Figure 4 T1 energy profile between the two T1 minima at different levels. The energy of
the op-S minimum was set to zero in all cases. TD-B3LYP, CC2, and ADC(2) calculations are based on the linear response of the closed-shell ground state, while B3LYP is a direct unrestricted DFT calculation of the triplet configuration.
Figure 5 Potential energy profiles of the lowest singlet and triplet states and their characters for (a) 2tThy and (b) 6n-2tThy at CASPT2 level.
molecules, directly impacts the T1 equilibrium distribution, and
the subsequent T1 decay.
In addition to relative energies, a series of other relevant parameters of the two minima of each molecule are collected in Table 1, including Boltzmann population at 300 K, phosphorescence lifetime (as given by Eq. 1), energy gap, SOC, and oscillator strengths between T1 and S0. The experimental T1
lifetime for each molecule is given as well.1
Under the thermal equilibrium hypothesis, the T1 population in
2tThy splits between the two minima: a Boltzmann distribution at 300 K based on the CASPT2 energies predicts a 3:1 ratio between the op-S and the B3,6 (Table 1). In the case of 6n-2tThy,
the whole population lies on the B3,6 minimum. We point out
that these estimates do not consider zero-point, thermal, and entropic terms. At another level, neither solvent effects nor tunneling are considered as well. However, we believe that given the large energy gap between the minima of 6n-2tThy (0.3 eV), the preference for the B3,6 minimum will hold even when
those other factors were taken into account. In fact, later, when we discuss the transient absorption spectra and compare them to the experimental data, we will confirm this hypothesis. For both, 2tThy and 6n-2tThy, the two minimum structures show striking differences for almost all the properties listed in Table 1. This suggests that we can treat the two minima as independent quasi-states, instead of one single T1 state, when
considering the T1 decay dynamics. In other words, we must
consider the adiabatic dynamics along the T1 state.
Note, first, that the calculated phosphorescence lifetimes are much longer than the experimental T1 lifetime. This implies that
there is some nonradiative dynamics determining the fate of the T1 state, agreeing with the experimental conclusions of
Taras-Goslinska et al.25 This nonradiative process is most likely
an ISC from T1 into S0. Then, another interesting point is that,
given the SOC and ∆E values in Table 1, the T1/S0 ISC rate should
be significantly larger from op-S than from B3,6 minimum. The
implications of this finding are discussed in the next section.
Table 1 Characterization of the T1 minimum structures of 2tThy and 6n-2tThy at
CASPT2 level. E: vertical energy gap;Ea: adiabatic energy gap; Eop-S(T1): energy
relative to the op-S minimum; ph: computed phosphorescence lifetime; expt: T1 intrinsic
experimental lifetime (ref.1).
Two-step mechanism of intrinsic triplet-decay dynamics
To clarify how the T1 state converts to the singlet ground state,
we first optimized the T1/S0 crossing point at CASPT2 level, and
then calculated the LIIC energy profiles for S0 and T1 states
between the B3,6 minimum and the crossing point also with
CASPT2.
The geometry of the T1/S0 crossing point is close to the op-S
minimum, but with an even larger displacement of S out of the plane. It lies about 0.3 eV above the op-S T1 minimum and has a
significant spin-orbit coupling to S0 of about 80 cm-1 (Δ𝐸𝑖𝑠𝑐‡ and
Jsoc in Table 2).
A different T1/S0 crossing point, characterized by a strong
puckering at C/N6, has been described for 2tThy and 6n-2tThy in refs.21, 52. As it lies 0.9 eV above the T1 minimum and has SOC
near zero,52 it should not play any relevant role for the triplet
decay and it will not be further discussed here.
Because the op-S crossing point is close to the op-S minimum, the LIIC path connecting the B3,6 minimum to the crossing point
conveniently shows the main topographic features of the triplet state, as illustrated in Figure 6 for 6n-2tThy. This figure also qualitatively shows how T1 decay should take place. Starting
from the B3,6 minimum, it is a two-step process: first, the
molecule must cross the barrier to the op-S minimum (step 1); and then from there it may reach the crossing point (step 2), where the molecule converts to S0. Naturally, starting from the
op-S minimum, only step 2 is in play.
It is fortunate that experimental rates for intrinsic T1 decay of
both molecules are available:1 expt-1 = 3.7×10⁵ s-1 for 2tThy and
expt-1 = 1.3×10⁵ s-1 for 6n-2tThy (Table 1). Based on these
results, we estimated the activation free energy for a chemical kinetic model involving each of these two steps, using two simple models, the Eyring equation (Eq. 2) for the barrier-crossing rate (step 1) and the quasi-Marcus formula (Eq. 3) for the ISC rate (step 2). The comparison of these estimates to the activation energies obtained at CASPT2 level allowed us to identify the rate determining step (RDS) in the intrinsic triplet decay of each molecule, as discussed next.
2tThy 6n-2tThy
T1 min Structure op-S B3,6 op-S B3,6
Character: 3* (C2-S) (C5-C6) (C2-S) (C5-N6) E(T1-S0) /eV 1.76 2.17 1.52 2.07 Ea(T1-S0) /eV 3.20 3.23 3.17 2.87 Eop-S(T1) /eV 0.000 0.026 0.000 -0.304 T1 Population (300 K) 74% 26% <1% >99% T1-S0 SOC /cm-1 59 7 75 3 T1-S0 Osc. Strength (×10-6) 0.4 0.01 2.9 0.02 ph /s 822 51,600 86 21,000 expt /s (ref.1) 2.7 7.5
Figure 6 Energy profiles for the T1 and S0 states connecting the two T1 minima and the
T1/S0 crossing point for 6n-2tThy at CASPT2 level. The related key structures are
Table 2 Parameters for RDS determination (300 K) with Eqs. 2 and 3.
Let us for a moment assume that step 1, the barrier crossing, is the RDS for the T1 intrinsic decay. If that were true, according to
the Eyring equation (Eq. 2), Δ𝐺𝑐𝑟𝑜𝑠𝑠 ‡ would have to be about
0.43 eV for 2tThy and 0.46 eV for 6n-2tThy to be consistent with the experimental reaction rates (Table 1). As for comparison, the calculated Δ𝐸𝑐𝑟𝑜𝑠𝑠‡ based on CASPT2 LIIC paths are 0.19 and
0.43 eV, respectively.
Now, if we assume that step 2, T1/S0 ISC, is the RDS, we may use
the quasi-Marcus formula (Eq. 3) to predict that Δ𝐺𝑖𝑠𝑐 ‡ would
have to be 0.39 eV for 2tThy and 0.42 eV for 6n-2tThy to be consistent with the experimental rates (Table 2). CASPT2, on its
‡
turn, tells that Δ𝐸𝑖𝑠𝑐 , computed as the T1 energy difference
between the crossing point and the op-S minimum, is 0.30 eV for 2tThy and 0.24 eV for 6n-2tThy.
For 2tThy, the Boltzmann analysis showed that the T1 state
should be mainly distributed over the op-S minimum with an excess of 3 to 1 (Table 1). Therefore, we should not expect step 1 to be the RDS. Even if we allow for some error in the theoretical calculations, and assume that the T1 state has a
larger population over the B3,6 minimum, the difference
between the CASPT2 and the experimental activation barriers (0.19 and 0.43 eV; Table 2) is still too large to reasonably expect that step 1 would be the RDS. As a conclusion, the RDS for 2tThy should be step 2, no matter the exact population distribution between the two T1 minima. This conclusion is reinforced by the
excellent agreement between the experimental ISC barrier (0.39 eV) and the CASPT2 calculation (0.30 eV), even in view of the computational approximations and intrinsic inaccuracy. For 6n-2tThy, on its turn, we have three reasons to believe that step 1 is in fact the RDS. First, the T1 population is completely
concentrated in the B3,6 minimum (Table 1). Secondly, the
CASPT2 and the experimental activation barriers (0.43 and 0.46 eV) are in excellent agreement. And finally, step 2 is much faster than step 1, as indicated by the difference between the activation barriers 0.24 eV for theory against 0.42 eV for the experiment.
Confirmation of the distributions from transient absorption simulation
According to our calculations, the T1-state population of
6n-2tThy totally lies on the B3,6 minimum, while that of 2tThy splits
3:1 between the op-S and the B3,6 minima. Here we show how
experimental transient absorption spectra strongly confirm this prediction.
We calculated absorption spectra using DFT/MRCI for each of the two minima of both molecules. We resorted to this method instead of CASPT2, because for the absorption spectra we need
to compute about ten excited states for each molecule. These simulated spectra are compared to the experimental results from ref.1 in Figure 7.
For both molecules, experimental and computed spectra predict a double-band structure. Despite the qualitative agreement, the computational result is blue-shifted by about 0.3-0.4 eV.
The main difference between the experimental spectra of 2tThy and 6n-2tThy is the relative strength of the two bands. While for 6n-2tThy the high-energy peak (450 nm) has about half of the height of the low-energy peak (700 nm), for 2tThy, the low energy peak is much weaker, barely registering any signal. We can use this relative intensity between the two peaks to qualitatively infer the relative importance of the population in each T1 minimum. Starting from 6n-2tThy, the large intensity of
the experimental high-energy peak favors a T1 population at the
B3,6 minimum, as predicted by the Boltzmann analysis of the
CASPT2 energies (Table 1). For 2tThy, the low intensity of the experimental high-energy peak favors a T1 population at the
op-S minimum, also in agreement with the computational predictions.
T1 decay in other thionucleobases
We have discussed above that, for thiothymines, the T1 state
topography, characterized by two minima with different SOC strengths, determines the decay rate to the ground state. Is this conclusion restricted to thiothymines, or is it a phenomenon shared by other thionucleobases too? To answer this question, we should check whether the double-well T1 topography is also
a feature of other thionucleobases.
Unsurprisingly, for thiouracil, we know already that it features a T1 topography similar to that of thiothymine, as we may infer
from a comparison between our results and those from Mai and co-workers,17 in their discussion of the ultrafast population of
the triplet manifold. The cases of thiocytosine and thioguanine are not so obvious and are addressed here.
Source 2tThy 6n-2tThy
/eV CASPT2 1.44 1.66
Jsoc /cm-1 CASPT2 79 81
Δ𝐸𝑐𝑟𝑜𝑠𝑠‡ /eV CASPT2 0.19 0.43
Δ𝐺𝑐𝑟𝑜𝑠𝑠‡ /eV Expt. (Eq. 2) 0.43 0.46
Δ𝐸𝑖𝑠𝑐‡
/eV CASPT2 0.30 0.24
Δ𝐺𝑖𝑠𝑐 ‡
/eV Expt. (Eq. 3) 0.39 0.42
Figure 7. Experimental transient absorption spectra1 at starting time and simulated
We took 2-thiocytosine (2t-Cyt) and 6-thioguanine (6t-Gua) as prototypes. Both are the simplest thio-derivatives of cytosine and guanine and have been often investigated.11, 23, 54 For both
thio-derivatives, we searched for T1 minima with ADC(2), which,
as discussed, has provided excellent results for thiothymines. (Geometries are given in the ESI, Section S6.)
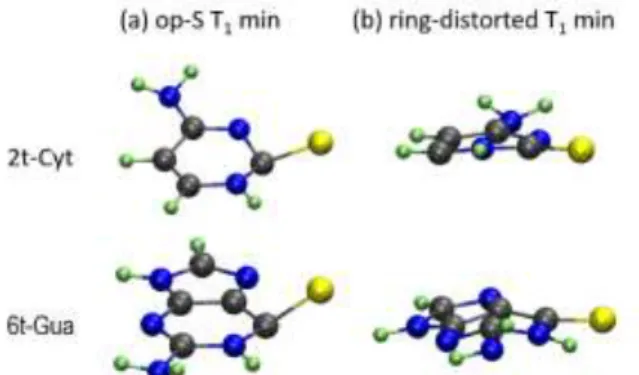
In both cases, we found out that the T1 state also features two
minima, one with the sulfur displaced out of the ring plane and another with a ring-distorted structure (they are shown in Figure 8). For 6t-Gua, such topography has also been previously described by Martínez-Fernandez et al.,23 in their discussion of
population transfer to triplet states. For the two minima of each species, we computed T1/S0 SOC with MS-CASPT2. The coupling
strengths are completely analogous to those obtained for thiothymines: the SOC at the op-S minimum is significantly larger than that at the ring-distorted minimum (77 cm-1 vs 4
cm-1for 2t-Cyt and 46 cm-1 vs 7 cm-1 for 6t-Gua).
These results support the hypothesis that the double-well
topography of the T1 state is a general feature of
thionucleobases, generalizing our conclusions on the decay of the T1 state for a larger class of molecules.
Conclusion
Different medical applications of thionucleobases may require singlet oxygen yields upon photoexcitation as low as zero when dealing with immunosuppressants or as high as the unity when dealing with phototherapy. Seeking for the fundamentals of this chemical tuning, we have unveiled the mechanisms of intrinsic triplet deactivation in two prototypical thiothymines, 2tThy and 6n-2tThy, and then extended these conclusions to other thionucleobases, 2t-Cyt and 6t-Gua.
Starting from the T1-state equilibrium of 2tThy and 6n-2tThy
and supposing that the previous processes leading to this state leave no memory, we applied high-level static calculation optimized at CASPT2 level, chemical kinetics analysis, and transient absorption simulations to draw a complete picture of intrinsic decay dynamics of triplet state.
In a nutshell:
1. At CASPT2 level, we obtained two minimum structures for the T1 state. These minima are determined by two strongly coupled 3ππ* diabatic states, producing a double well adiabatic T1 state.
High-level quantum chemical methods with good description of electron correlation are necessary to properly simulate the delicate energetic balance of these two minimum structures. Qualitatively wrong results may be got with TDDFT and CASSCF. 2. Given the relative energies of the two minima, the population distribution in the T1 state of 2tThy and 6n-2tThy between these
minima is reversed: while 2tThy mainly lies on an out-of-plane sulfur (op-S) minimum, 6n-2tThy mainly lies on a ring-distorted minimum. Comparison of simulated spectra to experimental transient absorption confirmed these distributions.
3. In addition to the two-minimum structure, the deactivation mechanism of the triplet state involves a T1/S0 crossing region
near the op-S structure. We built a two-step model of triplet-decay dynamics, and applied rate equations to gather thermochemical information out of available experimental results. This two-step model showed that the different triplet decay rates of the two molecules arise from dynamical factors: while for 2tThy, the rate determining step (RDS) is an ISC step; for 6n-2tThy the RDS is the crossing from the B3,6 to the op-S
minimum.
4. Finally, we tested 2t-Cyt and 6t-Gua, and confirmed that they feature two analogous T1 minimum structures, with similar SOC
strengths. Thus, the two-step mechanism for T1 decay proposed
here seems to be a common theme for thionucleobases in general.
The two-step mechanism may be the basis for a general on/off switch of the singlet oxygen yield. We may think of two limiting cases (Figure 9). The first one would be to have the ring-distorted minimum much more stable than the non-planar-S minimum. In such a case, the RDS is the barrier crossing between minima. This elongates the triplet lifetime, giving time to the thionucleobase derivative to react with oxygen and produce a singlet oxygen species.
The second limiting case would be to have the ring-distorted minimum much less stable than the non-planar S minimum. Now, ISC is the RDS. The triplet lifetime of the thionucleobase derivative is shortened and the singlet oxygen production, reduced. The experimental fact1 that the singlet oxygen yield is
twice as bigger in 6n-2tThy (B3,6 lower than op-S) than in in
2tThy (B3,6 higher than op-S) is a strong indication that such a
switch mechanism may work, opening new research possibilities in drug design.
Under the risk of sounding trivial, we would like to point out a fact that might be somewhat unexpected, especially for researchers focused on ultrafast processes. When dealing with
Figure 8 T1 minima including (a) out-of-plane S (op-S) and (b) ring-distorted
conformations of 2t-Cyt and 6t-Gua at ADC(2) level.
Figure 9 General double-well topography of T1 state as an on/off switch for singlet
relatively long-time scale dynamics, as the microsecond taken by the intrinsic triplet decay, the exclusive consideration of the global minimum during the theoretical analysis is not enough. Instead, we should consider other local minima, as high as 0.5 eV above the global minimum. As we have seen, even when such a high-energy minimum has an initial population distribution near zero, it may still play an important role for the long-term dynamics.
Acknowledgements
The authors thank the support of the A*MIDEX grant (n° ANR-11-IDEX-0001-02) and of the project Equip@Meso (ANR-10-EQPX-29-01), both funded by the French Government “Investissements d’Avenir” program. They also thank Prof. Christel Marian, who kindly provided the latest version of the DFT/MRCI program.
Notes and references
1. H. Kuramochi, T. Kobayashi, T. Suzuki and T. Ichimura, J.
Phys. Chem. B, 2010, 114, 8782-8789.
2. O. Reelfs, P. Karran and A. R. Young, Photochem.
Photobiol. Sci., 2012, 11, 148-154.
3. S. W. Pridgeon, R. Heer, G. A. Taylor, D. R. Newell, K. O'Toole, M. Robinson, Y. Z. Xu, P. Karran and A. V. Boddy, Br. J. Cancer, 2011, 104, 1869-1876.
4. A. Massey, Y.-Z. Xu and P. Karran, Curr. Biol., 2001, 11,
1142-1146.
5. G. Elion, Science, 1989, 244, 41-47.
6. R. Brem, I. Daehn and P. Karran, DNA Repair, 2011, 10,
869-876.
7. X. Zhang, G. Jeffs, X. Ren, P. O’Donovan, B. Montaner, C.
M. Perrett, P. Karran and Y.-Z. Xu, DNA Repair, 2007, 6, 344-354.
8. S. Euvrard , J. Kanitakis and A. Claudy N. Engl. J. Med.,
2003, 348, 1681-1691.
9. M. Pollum, L. Martínez-Fernández and C. E.
Crespo-Hernández, Top. Curr. Chem., 2015, 355, 245-327.
10. S. Matsika, Top. Curr. Chem., 2015, 355, 209-243.
11. S. Mai, M. Pollum, L. Martínez-Fernández, N. Dunn, P. Marquetand, I. Corral, C. E. Crespo-Hernández and L. González, Nat. Commun., 2016, 7, 13077.
12. Y. Harada, C. Okabe, T. Kobayashi, T. Suzuki, T. Ichimura,
N. Nishi and Y.-Z. Xu, J. Phys. Chem. Lett., 2010, 1, 480-484.
13. M. Pollum, S. Jockusch and C. E. Crespo-Hernández, J. Am. Chem. Soc., 2014, 136, 17930-17933.
14. C. Reichardt and C. E. Crespo-Hernández, J. Phys. Chem.
Lett., 2010, 1, 2239-2243.
15. S. Bai and M. Barbatti, J. Phys. Chem. A, 2016, 120,
6342-6350.
16. J. Jiang, T.-s. Zhang, J.-d. Xue, X. Zheng, G. Cui and W.-h. Fang, J. Chem. Phys., 2015, 143, 175103.
17. S. Mai, P. Marquetand and L. González, J. Phys. Chem. A,
2015, 119, 9524-9533.
18. G. Cui and W. Thiel, J. Phys. Chem. Lett., 2014, 5,
2682-2687.
19. J. P. Gobbo and A. C. Borin, Comput. Theor. Chem., 2014,
1040–1041, 195-201.
20. G. Cui and W.-h. Fang, J. Chem. Phys., 2013, 138,
044315.
21. J. P. Gobbo and A. C. Borin, J. Phys. Chem. A, 2013, 117,
5589-5596.
22. S. Mai, P. Marquetand and L. González, J. Phys. Chem. Lett., 2016, 7, 1978-1983.
23. L. Martínez-Fernández, I. Corral, G. Granucci and M. Persico, Chem. Sci., 2014, 5, 1336-1347.
24. V. Vendrell-Criado, J. A. Saez, V. Lhiaubet-Vallet, M. C. Cuquerella and M. A. Miranda, Photochem. Photobiol. Sci., 2013, 12, 1460-1465.
25. K. Taras-Goślińska, G. Burdziński and G. Wenska, J.
Photochem. Photobiol. A, 2014, 275, 89-95.
26. J. Seliger, V. Žagar, M. Latosińska and J. N. Latosińska, J. Phys. Chem. B, 2012, 116, 8793-8804.
27. J. Finley, P. A. Malmqvist, B. O. Roos and L. Serrano-Andrés, Chem. Phys. Lett., 1998, 288, 299-306.
28. O. B. Roos, V. Veryazov and P.-O. Widmark, Theor.
Chem. Acc., 2003, 111, 345-351.
29. G. Ghigo, B. O. Roos and P.-A. Malmqvist, Chem. Phys.
Lett., 2004, 396, 142-149.
30. P. Å. Malmqvist, B. O. Roos and B. Schimmelpfennig, Chem. Phys. Lett., 2002, 357, 230-240.
31. S. Grimme and M. Waletzke, J. Chem. Phys., 1999, 111,
5645-5655.
32. R. Ahlrichs, M. Bär, M. Häser, H. Horn and C. Kölmel, Chem. Phys. Lett., 1989, 162, 165-169.
33. I. Lyskov, M. Kleinschmidt and C. M. Marian, J. Chem. Phys., 2016, 144, 034104.
34. A. D. Becke, J. Chem. Phys., 1993, 98, 1372-1377.
35. P. J. Stephens, F. J. Devlin, C. F. Chabalowski and M. J.
Frisch, J. Phys. Chem., 1994, 98, 11623-11627.
36. A. D. Becke, J. Chem. Phys., 1993, 98, 5648-5652.
37. T. Yanai, D. P. Tew and N. C. Handy, Chem. Phys. Lett.,
2004, 393, 51-57.
38. J.-D. Chai and M. Head-Gordon, Phys. Chem. Chem.
Phys., 2008, 10, 6615-6620.
39. W. J. Hehre, R. Ditchfield. and J. A. Pople, J. Chem. Phys., 1972, 56, 2257-2261.
40. M. J. Frisch, G. W. Trucks, H. B. Schlegel, G. E. Scuseria, M. A. Robb, J. R. Cheeseman, G. Scalmani, V. Barone, B. Mennucci, G. A. Petersson, H. Nakatsuji, M. Caricato, X. Li, H. P. Hratchian, A. F. Izmaylov, J. Bloino, G. Zheng, J. L. Sonnenberg, M. Hada, M. Ehara, K. Toyota, R. Fukuda, J. Hasegawa, M. Ishida, T. Nakajima, Y. Honda, O. Kitao, H. Nakai, T. Vreven, J. Montgomery, J. A., J. E. Peralta, F. Ogliaro, M. Bearpark, J. J. Heyd, E. Brothers, K. N. Kudin, V. N. Staroverov, R. Kobayashi, J. Normand, K. Raghavachari, A. Rendell, J. C. Burant, S. S. Iyengar, J. Tomasi, M. Cossi, N. Rega, N. J. Millam, M. Klene, J. E. Knox, J. B. Cross, V. Bakken, C. Adamo, J. Jaramillo, R. Gomperts, R. E. Stratmann, O. Yazyev, A. J. Austin, R. Cammi, C. Pomelli, J. W. Ochterski, R. L. Martin, K. Morokuma, V. G. Zakrzewski, G. A. Voth, P. Salvador, J. J. Dannenberg, S. Dapprich, A. D. Daniels, Ö. Farkas, J. B. Foresman, J. V. Ortiz, J. Cioslowski and D. J. Fox, Gaussian 09, Revision D.01. Gaussian, Inc., Wallingford CT, 2013.
41. J. Schirmer, Phys. Rev. A, 1982, 26, 2395-2416.
42. O. Christiansen, H. Koch and P. Jorgensen, Chem. Phys.
43. B. G. Levine, J. D. Coe and T. J. Martínez, J. Phys. Chem. B, 2008, 112, 405-413.
44. M. Barbatti and H. Lischka, Phys. Chem. Chem. Phys., 2015, 17, 15452-15459.
45. Q. Ou and J. E. Subotnik, J. Phys. Chem. C, 2013, 117, 19839-19849.
46. H. Eyring, J. Chem. Phys., 1935, 3, 107-115.
47. S. R. Yost, E. Hontz, S. Yeganeh and T. Van Voorhis, J. Phys. Chem. C, 2012, 116, 17369-17377.
48. C. M. Marian, WIREs: Comp. Mol. Sci., 2012, 2, 187-203.
49. R. A. Marcus, J. Chem. Phys., 1984, 81, 4494-4500.
50. M. Barbatti, M. Ruckenbauer, J. J. Szymczak, A. J. A. Aquino and H. Lischka, Phys. Chem. Chem. Phys., 2008, 10, 482-494.
51. D. Cremer and J. A. Pople, J. Am. Chem. Soc., 1975, 97,
1354-1358.
52. G. L. Cui and W. H. Fang, J. Chem. Phys., 2013, 138, 044315.
53. B. O. Roos, K. Andersson and M. P. Fulscher, Chem. Phys.
Lett., 1992, 192, 5-13.
54. L. Martínez-Fernández, L. González and I. Corral, Chem.