HAL Id: hal-00861197
https://hal.inria.fr/hal-00861197
Submitted on 12 Sep 2013
HAL is a multi-disciplinary open access
archive for the deposit and dissemination of
sci-entific research documents, whether they are
pub-lished or not. The documents may come from
teaching and research institutions in France or
abroad, or from public or private research centers.
L’archive ouverte pluridisciplinaire HAL, est
destinée au dépôt et à la diffusion de documents
scientifiques de niveau recherche, publiés ou non,
émanant des établissements d’enseignement et de
recherche français ou étrangers, des laboratoires
publics ou privés.
tailoring by users
Claudia Detraux, Dominique Scapin
To cite this version:
Claudia Detraux, Dominique Scapin. Personal information systems usability and contents tailoring by
users. EEE13 - The 2013 International Conference on e-Learning, e-Business, Enterprise Information
Systems, and e-Government, Jul 2013, Las Vegas, United States. pp.155-161. �hal-00861197�
Personal information systems usability and contents
tailoring by users
C. Detraux
1and D. L. Scapin
11
INRIA, Domaine de Voluceau, 78153, Le Chesnay Cedex, France
Abstract - This paper describes an experiment on the
usability of a new personal information management system on internet (PIMI). The goals are to evaluate its usability, and to assess user tailoring as an evaluation technique. Thirty users participated to the study : a first part consisted in a standard user test (SUT) and a second part was a usability test with tailoring by users (UTT). Overall, a total of 51 usability problems were diagnosed. Among those, 32 resulted from SUT, and 19 from UTT. Part of the latter (11) are additional to the ones identified during SUT, and to those diagnosed previously by usability inspection (UI with Ergonomic Criteria). The active involvement of users through customization scenarios appear to provide additional cues for usability assessment, and for design (new generic usability recommendations).
Keywords: Usability evaluation; evaluation methods; user
tailoring; personal information systems; e-gov.
1 Introduction
Personal information management systems (PIMs) and tools are now widely offered on internet and smartphones to support our daily lives, as citizen, employees, stakeholders, family members, friends, etc. Such novel systems and tools need to be usable, especially for reaching the goal of various government initiatives for “paperless” administrative procedures. The study presented here has been conducted with that goal, in a ANR-PIMI project which aims at developing a Personal Information Space on Internet for supporting remote e-procedures (getting a passport, paying taxes, obtaining social services, etc.). This study follows up on previous work that contributed to the iterative design of the current prototype. An initial research [1] carried out several usability studies: 1 administrative forms analysis; 3 "focus groups" on information storage, and on sharing; 1 online questionnaire on the same topics for a wider range of audience; 1 "card-sorting" study to validate categories created by users and to organize their information. All the design/ evaluation iterative steps led to a PIMI mock-up, taking into account users' needs as they were collected. Another research [2] complemented the approach through an experiment to validate the information content and structure of the mock-up that was partly modifiable. The results allowed to validate the item structure for the future personal space,
and started assessing user modifications as evaluation cues, and provided usability recommendations. Going further, in the current study, the goal is twofold: evaluate the usability of the advanced PIMI prototype (in terms of contents and structure), and investigate the role of various methods in usability problems diagnosis. In the experiment, a standard user test (SUT) and a test with tailoring (UTT) are compared. The results are then compared to a previous usability inspection (UI). This paper first reviews some aspects of the literature on PIMs, on user tailoring, and on usability methods comparisons. Then, the experiment method, procedure, material, participants, and main results are presented. The conclusion discusses lessons learned and directions for future work.
2 Other Work
Personal Information Management Systems
(PIMs) refers to studies on how users manage their data and personal documents. From a usability point of view, the literature is not yet very rich. Some are partly covered in CSCW conferences [3], of course mainly on cooperation, groups, social interactions; and on societal aspects in [4]. Other papers are more directly concerned with usability for individuals, such as « user's personal digital ecosystem » in [5], or about the evolution of usage with tablets in [6], or on privacy in [7], and [8]. Also contributions concerned facilitated form-filling in [9], web search in [10], and supporting flexibility between devices in [11]. Some studies attempted, through longitudinal studies, to understand how people make notes and archive their information in [12], or looked at mobile practices in [13]. However, very little can be found on usability assessment, as reported in [2, op.cit.], in which, besides a review of 15 PIM tools, highlights are provided about the organization and information retrieval aspects among which hierarchical structures seem still to be the most widespread and users favorite [14] [15] [16] [17], but that also show users difficulties in creating consistent and meaningful hierarchical structures, and in naming categories/items. Our current experiment attempts to go further on those issues of personal information structure and naming.
User tailoring. Previous work [2, op.cit.] reviewed
novel contributions were found beyond [18] [19] [20] [21] on user modifications in systems design/development, its usability and impact on usability measurements. On the other hand, many papers relate to other issues, such as recommender systems [22], social networks [23], games [24], physical environments [25], e-learning [26], etc. In short, very few experimental results exist about user modifications as a means of usability evaluation. This study on a prototype intends to complement this by providing new empirical results.
Usability evaluation methods (UEMs) are numerous
(see [27]). Comparing them is very complex and lengthy, especially when following guidelines and criteria such as in [28] [29]. In a thorough literature review [30] issues were reported (see [31] [28 & 29, op.cit] [32]), such as using appropriate metrics, problem severity, whether putative usability problems extracted in analyses are genuine, thoroughness, problem similarity, and usability problem interpretation. In the current study, we attempted to alleviate these difficulties through a thorough problem coding. However, while we used a rather large set of participants in the experiment, the usability inspection carried out was only co-conducted by 2 experts, unlike the above study [30, op.cit.].
3 Experiment
The goal of the experiment is to evaluate the PIMI prototype through information on the intuitive user behavior. The specific objectives are to verify: the usability of the user interface when entering/ filling information; finding items; modifying contents (categories/ sections names, items display order, deactivating items); the understandability of current naming of categories, sections, and items; the appropriateness of the information structure; and the level of tailoring that users intuitively perform; and its role on usability problems diagnosis.
3.1 Method and procedure
The sessions were conducted individually and supervised by the experimenter. They were conducted in the participants’ own working or study environment (offices for researchers and administrative staff; computer room for students). This allowed easy access to their personal belongings (bags, wallets, diaries, personal or work computers) for the tasks required. The prototype was presented on a laptop computer and sessions recorded with a screen capture software (video and sound). A pilot test was conducted with one subject to assess the experimenter’s discourse and to calibrate scenarios duration (in order, for the experiment to last less than one hour). The sessions were conducted in three main phases: - Initially: presentation of the project, of the experiment objectives, and of the prototype (how to navigate, enter,
save and modify the PIMI). The participants were encouraged to think aloud about their difficulties in relation to the task scenarios, the tool, the data.
- A phase of work on the tasks and scenarios: in a first
part, 4 task scenarios were proposed consecutively:
Scenario 1: personal identification tasks (e.g., enter name,
identity card information, address, phone); Scenario 2: tasks about professional contacts and student curriculum.;
Scenario 3: data entry tasks on two types of forms; Scenario 4: to verify whether proposed redundancies are
understood, accepted and the path(s) followed to find them. In a second part, two steps were proposed: a first step where a scenario required to make changes according to the instructions (function "Custom PIMI" or "Customization Options" to "Enter and View Information"). A second step required the participants to browse the entire prototype structure to make the changes they wished.
- Finally, a questionnaire allowed the participants to comment on the prototype, and on the difficulties they had. The questions were "closed" (yes-no or list of options). However, the experimenter encouraged the participants to justify their answers orally (audio recording) or in writing.
3.2 Material
Information items. The latest results from a previous
study [2] resulted in a structure of information items with 10 categories, with 35 sub-categories: Identity (personal identity, ID papers, family); Work (current work/ affiliation details, career, student curriculum, and professional contacts); Papers (ID papers, salary sheets, social security card); Contacts (personal & professional); Agenda (personal & professional); Transportation (private, public); Codes (entry codes, locks, phones, passwords, websites, credit cards); Finance (income and benefits, investments, loans, bank accounts); Taxes (income tax reference, tax deductions, tax bracket, property tax, housing tax); Health (social security & health insurance, physicians, medical records, emergency contact person), for a total of 73 information items.
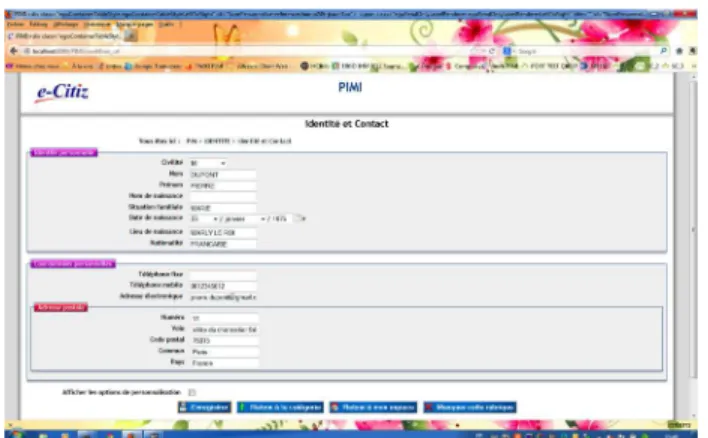
Prototype. The PIMI prototype (PC V0.3) was
available locally with a Firefox browser on a Windows platform. Figure 1 shows a screen shot of the prototype.
Experimenter’s equipment : video screen capture
software: NCH Software : it allows recording the entire sessions through video capture of the screen, as well as all the user comments (with the participants’ authorization). Observation checklists cards are also completed by the experimenter during the sessions to gather the most relevant information on various aspects explained in the scenario descriptions.
Participants’ equipment : laptop with prototype and
scenarios and tasks to perform. Additional forms: when participants did not have expected data, the experimenter provided them with business cards of a specialist doctor, of a colleague, etc. Uploadable files required in the scenarios are installed (e.g., fictitious identity card.jpg, academic career.pdf). Final questionnaire with questions about the prototype, its use and opinions on such personal information systems, with a specific part on tailoring and associated involvement of participants.
Figure 1. A Screenshot of PIMI Prototype
3.3 Participants
The sessions were conducted with 30 participants: 10 researchers (computer science institute); 10 administrative staff (computer science institute and university); and 10 university students. They were 16 male (53.3%) and 14 female (46.6%). The average age was 36.06 years (s.d. 16.8 y). For researchers, 8 were male (80%) and 2 female (20%). Age average was 47.5 years (s.d. 17.48 y). For administrative staff, 9 were female (90%) and 1 male (10%). Age average was 41.2 years (s.d 11.4 y). For students, 7 were male (70%) and 3 female (30%). Age average was 19.5 years (s.d. 1.17 y).
4 Results
Session duration averaged 46.93 mn. (s.d. 10.16). In
the category researchers, it was 46.3 mn. (s.d. 8.38). For "administrative staff", it was 51.9 mn. (s.d 11.76). For "students", it was 42.6 mn. (s.d. 8.69).
Analyses are based on observed difficulties and errors, as well as participants comments. Difficulties include delays finding information, idle time, messy navigation; Errors include wrong or unsyntactical actions; Comments are expressed by participants during sessions, or in a questionnaire. Most comments reinforce the observed difficulties or errors. It is noticeable that the problems were diagnosed from: observed errors and difficulties (33%), participants’ comments (27%), and 40% from both.
Concerning participants groups, no differences were found in terms of errors for SUT (students: 43/124,
administratives: 42/124, researchers: 39/124). On the other hand, for UTT, students modified much more (90 modifications, i.e., 19 naming, 37 masking, and 34 order), while 75 for the administratives (i.e., 16, naming, 32 masking, and 34 order), and 50 for the researchers (i.e., 7 naming, 34 masking, and 9 order). Noticeably, answers to the questionnaire showed that the 5 participant’s negative opinion on tailoring easiness are 3 researchers and 2 administratives. Overall, it seems that younger users (students) incline more at suggesting and tailoring.
Difficulties in finding information. In Scenario 1,
16,1% participants had difficulties finding the item « Parents ». In Scenario 2, only 3,2% had difficulties finding the item « Professional Contacts ». In Scenario 3, 58,1% could not find the items « Social Security» and « Specialized Physician », and 19,4% had trouble finding them. In Scenario 4, 33,3% had trouble finding « I.D.» (attached file), and 3,3% could not find it at all. In other words, accessing categories and sub-categories is not a problem, unlike finding individual items.
Naming issues. The terms participants had a few
understanding difficulties with are : (in personal identifications) family situation (6/30), birth name (3/30),
birth location (1/8) ; (in colleagues’ information) number (11/30) ; (in student curriculum) university curriculum and courses (2/30) ; (in social security) beneficiary (8/30), coverage period (25/30), number (11/30) ; (in other health
specialists) personalized name (28/30). To summarize, a
few terms are either not well chosen, or lack precision, or are not presented in a sufficient context.
Navigation difficulties : 19/30 participants had least 1
difficulty (only one had 4 (total 33, average 1,1 ; s.d. 1,15). Some difficulties led to errors : in Scenario 1, 7/30 had difficulties, and 3 errors ; in Scenario 2, 5/30 difficulties, and 2 errors ; in Scenario 3, 4/30 difficulties, and 2 errors ; in Scenario 4, 5/30 difficulties, and 1 error ; in Scenario 5.1 (modification) 7/30 difficulties, and 3 errors ; in Scenario 5.2 (modification) 5/30 difficulties, and 4 errors. Usability problems are mainly related to navigation buttons, and lack of short-cuts.
Saving forms led to 30 difficulties : 70% participants had
at least 1 difficulty, and 3 participants with 3 difficulties. They concerned : scenario 1 (13 difficulties including 2 that led to error) ; scenario 2 (7 difficulties including 4 that led to error) ; scenario 3 (9 difficulties including 2 that led to error) ; scenario 4 was not concerned by the save function ; scenario 5.1. (none); scenario 5.2. led to 1 error. The issues here relate to lack of feedback, and naming confusions.
Errors confirm the issues above. A total of 124 errors was observed through the experiment (average 4,13 per participant ; sd 2,17) : Scenario 1 : average 1,13 ; sd 1,25, with at least 1 error for 18 participants, and 5 for 1 participant ; Scenario 2 : average 1,3 ; sd 1,2, with at least 1 error for 20 participants, and 4 for 1 participant ; Scenario 3 : average 1,3 ; sd 1,05, with at least 1 error for 23
participants, and 5 for 1 participant ; Scenario 4 : only 1 error ; Scenario 5.1 : 3 errors for 3 participants (1 each) ; Scenario 5.2 : 8 errors (average 0,26 ; sd. 0,69), with at least 1 error for 5 participants, and 3 for 1.
4.1 Personalization
To study the way people modify their personal information content and structure, 2 scenarios were proposed along 2 distinct steps : Step 1 followed a set of modification instructions the participants completed. The goal was to familiarize the participants with the tailoring functions, and to observe their potential difficulties. Step 2 was at the participants’ initiative : they were asked to modify the PIMI content and structure as they wished.
4.1.1 Modifications by instructions
Paths followed : For naming, 63,3 % participants went
directly to the tailoring function, while 6,7% went to each category; the other 30% chose to start first with categories, then concluded with the tailoring function. For masking categories, 86,7 % participants went directly to the tailoring function, while 13,3% participants used both ways.
Difficulties : For naming changes, 90 % participants had
no trouble ; only 6,7% took a little time and only 3,3% did not succeed. For masking categories, 56,7 % had no trouble ; 36,7% took a little time and only 6,7% did not succeed. For order modification 43,3 % had no trouble ;
36,7% took a little time. For reinitializing the default structure, there was no major difficulty, 96,7 % did it
easily, only 3,3% took a bit more time.
4.1.2 User initiative modifications
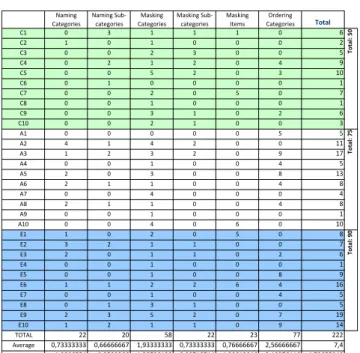
Table 1 shows a total de 222 modifications (researchers C1 to C10, administrative A1 to A10, students (E1 to E10), with an average of 7,4 per participant (sd: 4,79).
Table 1 : User Initiative Modifications
All participants made modifications: from just 1 by 4 participants, up to 17 by 1 participant. Table 1 also shows the most common modifications (103 masking modifications, 77 categories order modifications, and 42 naming modifications).
- for Naming, 22 modifications concerned categories (40 % participants), and 20 sub-categories (40 % participants). - for Masking, 58 modifications concerned categories (93,3 % participants), 22 sub-categories (14,3 % participants), and 23 items (3,2 % participants).
- for Order modifications, 50% participants made at least 2 modifications (maximum 9 modifications).
Finally, despite the fact the tailoring function did not offer that, a set of modifications were expressed by 47 % participants : adding categories or sub-categories (33 %) ; splitting a category (0.6 %) ; moving sub-categories (0.6 %) ; distinguishing data entry from data retrieval (0.3 %) ; changing the color coding, the character size (0.6 %).
4.2 Questionnaire Results
At the end of the scenarios sessions, the participants were asked to answer a questionnaire consisting of two parts: a first part with specific questions about tailoring, and a second part with more general questions about the PIMI prototype, and improvements they would like to see.
Part 1 : questions on tailoring
Most participants (83.3%) liked the capability of modifying the structure of their personal Information space. Most participants (93.3%) also found it easy for categories naming modifications, and for sub-categories naming modifications (80%). It was also easy for masking categories and sub-categories (93.3%). It was judged much less easy for modifying categories order (36.7%). In addition, the participants suggested other types of modifications that were not implemented in the prototype, such as : adding new categories and sub-categories (9/20) ; changing the visual design, e.g., colors, formats (4/30) ; and providing forms horizontally (2/30).
Part 2 : general questions and improvements
A slight majority of the participants (60%) feel ready to use a system like the PIMI prototype. Their motivation is mainly the capability of centralizing all their data, and limit paper use. For those who felt less ready (33.3%) and those not ready at all (6.7%), their main concern are security and trust. Most participants (80%) said they did nor experience difficulties in using the prototype. Only a few expressed difficulties either moderate (16.7%) or strong (3.3%). In addition, 25/30 participants (86,2%) made suggestions for improvement, basically attempting to alleviate some of the usability problems found earlier.
From a more methodological point of view, it is noticeable that, overall, the various usability evaluations conducted in this study led to the diagnosis of a larger set of usability problems than simply asking users through a questionnaire. !"#$%&' (")*&+,$*-!"#$%&'./01 2")*&+,$*-3"-4$%&' (")*&+,$*-3"-4$%&'./01 2")*&+,$*-' 3"-4$%&''''''' 5)*#-6,7*,$%&'''''' (")*&+,$*- !"#$%& (8 9 : 8 8 8 9 ; (< 8 9 8 9 9 9 < (: 9 9 < : 9 9 = (> 9 < 8 < 9 > ? (= 9 9 = < 9 : 89 (; 9 8 9 9 9 9 8 (@ 9 9 < 9 = 9 @ (A 9 9 8 9 9 9 8 (? 9 9 : 8 9 < ; (89 9 9 < 8 9 9 : B8 9 9 9 9 9 = = B< > 8 > < 9 9 88 B: 8 < : < 9 ? 8@ B> 9 9 8 9 9 > = B= < 9 : 9 9 A 8: B; < 8 8 9 9 > A B@ 9 9 > 9 9 9 > BA < 8 8 9 9 > A B? 9 9 8 9 9 9 8 B89 9 9 > 9 ; 9 89 C8 8 9 < 9 = 9 A C< : < 8 8 9 9 @ C: < 9 8 8 9 < ; C> 9 9 8 9 9 9 8 C= 9 9 8 9 9 A ? C; 8 8 < < ; > 8; C@ 9 9 8 9 9 > = CA 9 8 : 8 9 9 = C? < : = < 9 @ 8? C89 8 < 8 8 9 ? 8> D6DBE << <9 =A << <: @@ <<< BF*,"&*' 9G@::::::: 9G;;;;;;;@ 8G?::::::: 9G@::::::: 9G@;;;;;;@ <G=;;;;;;@ @G>
.HIH 8G9A9;==> 9G?=A?<;; 8G:A@?;8:A 9G?9@8A@8> 8G?9;8:9>; :G89:@;88; >G@?;==9>A
! " # $ %' &( ) &&&&&&&&&&&&&&&&&&&&&&&&&&&&&&&&&&&&&&&&&&&&&&&&&! " # $ %' &* ) ! " # $ %' &+ *
However, the participants’ answers, particularly through their suggestions confirmed part of the problems identified.
5 Discussion
User tailoring
:
The active participation in that session was strong: a total of 222 modifications were made, and all participants made at least one change with a maximum of 17 for one participant (average 7,4 modifications per participant, sd. 4,79).The modifications can be characterized by 4 main goals: to simplify (through masking and changing names); to clarify (through the change of names); to facilitate access (through the change order categories); to secure (through masking). Some methodological lessons can be learned:
- participants’ modifications help identify additional usability problems.
- the participants felt having a more important role, express themselves more, provide criticisms, advice and express their preferences. In short, they take ownership of the system, even strengthening their opinion on some usability issues that did not seem too "troublesome" initially. - considering the need for today's systems being used for a wider audience, varying in terms of age, sex, occupation, skills, and contexts, it is effective to provide tailoring functions for the users (e.g., for vocabulary, techniques, navigation needs).
In short, facilitating users’ role as “actors” rather than “passive” participants has strong merits.
Usability Methods comparison: Figure 1 shows the
number of usability problems diagnosed through the 3 usability methods (Standard Usability Testing (SUT), Usability Testing with Tailoring (UTT), and Usability Inspection (UI).
Overall, there are no real significant differences in the usability problems nature, except the obvious different interaction states in which they occurred, due to the task scenarios (modification states for UTT, and data entry states for SUT). However:
- There is about the same number of specific usability problems for each evaluation technique : 9 for UI (26% of total) ; 11 for SUT (34% of total) ; 11 for UTT (58% of total). In percentage though, UTT has the highest score of specific problems.
- There are many (highest score) problems common to UI and SUT (21, i.e., 62% of UI and 66% of SUT).
- There are much less problems common to UI and UTT (8, i.e., 24% of UI and 42% of UTT).
- There are even less problems common to SUT and UTT (4, i.e., 12% of SUT. and 21% of UTT).
- There are very few problems common 3 ways to UI, SUT and UTT (4, i.e., 12% of UI, 12% of SUT and 21% of UTT).
Figure 1 – Usability problems per evaluation method Also, it can be noticed that :
- (for their 4 common ones) there is no problem common to SUT and UTT that is not also diagnosed with UI.
- (for their 21 common ones) 17 problems have been diagnosed with both SUT and UI, but only 4 also diagnosed with UTT.
- (for their 8 common ones) 4 problems have been diagnosed with both UTT and UI, and 4 also diagnosed with SUT.
Unlike previous findings in [25, op.cit.], SUT and UTT do not seem to lead to more problem diversity than UI. However, it shows that SUT and UTT seems particularly efficient for the diagnosis of problems that require a particular state of interaction to be detectable. On the other hand, UI supports the identification of problems directly observable, often related to learnability and basic usability.
!
6 Conclusion
This paper reported research work associated with the usability evaluation of a prototype for personal information management. The experiment, with 30 participants (researchers, administrative, and students), followed 4 classical task scenarios for user testing, and 1 scenario allowing participants’ tailoring of the prototype information structure and content.
First some limits should be pointed out, such as:
- For both SUT and UTT, the experimenter’s presence may have hindered access to some prototype functions (e.g., on-line help) as it was just simpler to ask the experimenter. - Also, except in the modification scenario, participants remained focused on the tasks, not exploring further. User monitoring through time may be useful.
- A varied set of usability problems has been diagnosed. However, there was no control on the usability flaws,
resulting (involuntarily) from the design by a partner company specialized in e-government applications and tools design. This prevents of course from generalizing fully to all other applications of this kind. In the future, it would be interesting to introduce voluntarily a large set of usability flaws over all states of the application, with a full variation of usability problem types, in order to have a control on the total number of problems, their nature and location, therefore allowing to extract the full set of diagnoses according to each evaluation technique ... but
that is quite complex to do and very time consuming.
- only the information structure and content of the prototype were evaluated, but not yet its e-procedures which will be implemented later this year.
The results allowed the diagnosis of 51 usability problems and led to recommendations for improving the final version of the prototype.
From a methodological point of view, we investigated the relative role of the two evaluation methods used in the experiment (standard user test (SUT) and user test with tailoring (UTT)). Additionally, the results were also compared to results from a usability inspection (UI). The three evaluation techniques are quite complementary, but direct involvement of the users through a tailoring scenario enriches the evaluation, pointing at unexpected paths, function use, understanding of concepts, etc.
While usability inspection based on Ergonomic Criteria allowed to make a general diagnosis for usability problems (several types and in many states of the interface), user test allowed to identify similar types of problems, but with a more detailed focus, despite only on a fewer interaction states.
Using tailoring scenarios allows users to express themselves more about the system by showing their preferences and thus promoting a more collaborative design and evaluation process.
Overall, the active and direct participation of users by providing new structures, terms, pathways, and functions lead to very rich usability cues for evaluation and design. For future research work, several issues seem worth investigating:
- security and trust is still an issue, even though a positive perception seems facilitated by user involvement in tailoring structure and content, but little is known yet about the full picture, with e-procedures.
- real usage: one must find ways of actually evaluating real use through innovative and intelligent tools for collecting real-time user data, including on evolutionary tailoring. - mobility: PIMs, such as the prototype evaluated in our study with a PC, will obviously need to be used on smartphones and other tablets. A mobile PIMI version is being developed, but its usability, and compatibility with PC version, including its plasticity will need to be assessed.
Acknowledgement: This research was supported by the
ANR project PIMI.
7 References
[1] D. L. Scapin, P. Marie-Dessoude , M. Winckler, C. Detraux. Personal Information Systems: User Views and Information Categorization, in "Proc. Centric2011-4th. Intl. Conf. on Advances in Human-oriented and Personalized Mechanisms, Technologies, and Services", Barcelona, Spain, 2011.
[2] C. Detraux, D. L. Scapin. User Modifications as Usability Evaluation Cues for a Personal Information Space, in EEE2012, Intl. Conf. on e-Learning, e-Business, Enterprise Information Systems, and e-Government", Las Vegas, USA, 2012.
[3] CSCW13-1. Proc. of the 2013 ACM Conference on Computer Supported Cooperative Work v.1 / Amy Bruckman / Scott Counts / Cliff Lampe / Loren Terveen San Antonio, Texas 2013-02-23 2013-02-27 2013 ACM n.141 p.1566 [4] Oakley, R. L. and Salam, A. F. Cyber Citizens and Cyber Deviance: Exploring Social and Technical Factors as Antecedents to Cyber Deviance and the Implications for Cyber Citizenship. Proc. of the 2012 AIS SIGHCI Workshop on HCI Research in MIS 2012-12-16 p.7.
[5] Kay, J., Kummerfeld, B. Creating personalized systems that people can scrutinize and control: Drivers, principles and experience. ACM Transactions on Interactive Intelligent Systems 2012-12 v.2 n.4 p.24
[6] Buttfield-Addison, P., Lueg, C., Ellis, C., and Manning, J, "Everything goes into or out of the iPad": the iPad, information scraps and personal information management. Proc. of 2012 Australian CHI Conference 2012-11-26 p.61-67. [7] Ploderer, B. Smith, W., Howard, S., Pearce, J., and Borland, R.. Things you don't want to know about yourself: ambivalence about tracking and sharing personal information for behaviour change. Proc. of 2012 Australian Computer-Human Interaction Conference 2012-11-26 p.489-492 [8] Rawassizadeh, R. Towards sharing life-log information with society / Behaviour and Information Technology 2012-11 v.31 n.11 p.1057-1067 .
[9] Winckler, M., Gaits, V., Vo, D.-B., Firmenich, S., and Rossi, G. An approach and tool support for assisting users to fill-in web forms with personal information New frontiers in documentation II / ACM 29th Intl. Conf. on Design of Communication 2011-10-03 p.195-202.
[10] Nitsche, M., and Nuernberger, A. InFrame-Browsing: Enhancing Standard Web Search Poster Papers. Proc. of Symposium on HCI and Information Retrieval 2012-10-04 p.16
[11] Ardito, C., Costabile, M. F., Desolda, G., Matera, M. Piccinno, A., and Picozzi, M. Composition of situational
interactive spaces by end users: a case for cultural heritage Living history Proc. 7th Nordic Conference on HCI 2012-10-14 p.79-88.
[12] Van Kleek, Max G., Styke, W., Schraefel, M. C., Karger, D. Finders/keepers: a longitudinal study of people managing information scraps in a micro-note tool Reading & writing / Proc. ACM CHI 2011 2011-05-07 v.1 p.2907-2916 [13] Lindroth, T., and Bergquist, M. Breadcrumbs of interaction: situating personal information management Proc. Fifth Nordic Conference on HCI 2008-10-10 p.266-273. [14] F. Evequoz and D. Lalanne, “I thought you would show me how to do it - studying and supporting PIM strategy changes”. PIM Workshop, ASIS&T 2009, 35-42.
[15] S. Henderson. and A. Srinivasan, “An empirical analysis of personal digital document structures”, Proc. HCI International 2009, Berlin, Heidelberg: Springer-Verlag, 2009, pp. 394–403.
[16] S. Henderson, “Guidelines for the design of personal document management user interfaces”. PIM Workshop, ASIS&T 2009, 2009, pp. 65-72.
[17] K. Voit, K. Andrews and W. Slany, “Why personal information management (PIM) technologies are not widespread”. PIM Workshop, ASIS&T 2009. (2009) 60-64. [18] A. I. Mørch and N. D. Mehandjiev, “Tailoring as collaboration: the mediating tole of multiple representations and application units”. Computer Supported Cooperative Work. 9(1) (2000): 75-100.
[19] L. Zhu, I. Vaghi, B. R. Barriceli, “A meta-reflective wiki for collaborative design”. Proc. of the 7th International Symposium on Wikis and Open Collaboration (WikiSym'11).ACM, (2011), 53-62.
[20] R. Demunieux, V. Ganneau, G. Calvary and E. Gegovska, “Les interfaces plastiques : premiers retours utilisateurs, évaluations en laboratoire” .Ergo-IA 2008. 117-124.
[21] C. Dörner, F. Yetim, V. Pipek and V. Wulf, “Supporting business process experts in tailoring business processes”. Interact. Comput. 23, 3 (2011), 226-238.
[22] Heung-Nam, K., Majdi, R., and El Saddik, A. Tailoring recommendations to groups of users: a graph walk-based approach. Proc. of the 2013 International Conference on Intelligent User Interfaces 2013-03-19 v.1 p.15-24
[23] Zimmerman, A., And Lorentz, A. LISTEN: a user-adaptive audio-augmented museum guide Special issue on
Personalizing Cultural Heritage Exploration. User Modeling and User-Adapted Interaction 2008-11 v.18 n.5 p.389-416 [24] Gamberini, L., Spagnolli, A., Carradi, N., Jacucci, G., Tusa, G., Mikkola, T., Zamboni, L., and Hoggan, E. Tailoring Feedback to Users' Actions in a Persuasive Game for Household Electricity Conservation. Proc. of the 2012 International Conference on Persuasive Technology 2012-06-06 p.100-111.
[25] Mirri, S., Salomoni, P., and Prandi, C. Augment browsing and standard profiling for enhancing web accessibility. Proc. of the 2011 International Cross-Disciplinary Conference on Web Accessibility (W4A) 2011-03-28 v.2 p.5.
[26] Kolås, L. & Staupe, A. (2007). A Personalized E-learning Interface. In: The Proceedings of the international IEEE Conference on Computer as a tool. Eurocon 2007 (pp. 2670-2675). Poland: IEEE Computer Society.
[27] D. L. Scapin, E. Law, Nigel Bevan, and the WG1 contributors (2008). Final Report MAUSE COST 294 WG 1 :Critical Review and Analysis of Individual UEMs. COST-294 Project MAUSE (December 2008)
[28] Gray, W. D. and Salzman, M. C., 1998, Damaged merchandise? A review of experiments that compare usability evaluation methods. Human-Computer Interaction, 13, pp. 203-261.
[29] Hartson, H. R., Andre, T. S. and Williges, R. C., 2001, Criteria for evaluating usability evaluation methods. International Journal of Human-Computer Interaction, 13, pp. 373-410.
[30] Bach, C. and Scapin, D. L.. Comparing Inspections and User Testing for the Evaluation of Virtual Environments, in "International Journal of Human-Computer Interaction", 2010, vol. 26, no 8, p. 786-824
[31] Cockton, G., Woolrych, A., Hall, L., and Hidemarch, M., 2003, Changing Analysts' Tunes: The Surprising Impact of a New Instrument for Usability Inspection Method Assessment. In Proc. of People and Computers XVII: Designing for Society, Springer Verlag, pp. 145-162.
[32] Hornbæk, K. and Frøkjær, E., 2005, Comparing usability problems and redesign proposals as input to practical systems development. In Proc. of ACM Conference on Human Factors in Computing Systems, (New York, NY: ACM Press), pp. 391-400.