Analysis of the Optical Coupling of Wavelength-Shifting Fibers to Organic Liquid Scintillator Filled Fluoropolymer Tubes for
Industrial and Nuclear Security Applications by
CHAD C. SCHOOLS
B.S. Physics, Worcester Polytechnic Institute, 1994
M.S. Engineering Management, University of Missouri-Rolla, 1999 M.S. Nuclear Engineering, Air Force Institute of Technology, 2005
SUBMITTED TO THE DEPARTMENT OF NUCLEAR SCIENCE AND ENGINEERING IN PARTIAL FULFILLMENT OF THE REQUIREMENTS FOR THE DEGREE OF
DOCTOR OF PHILOSOPHY IN NUCLEAR SCIENCE AND ENGINEERING
AT THE MASSACHUSETTS INSTITE
MASSACHUSETTS INSTITUTE OF TECHNOLOGY OF TECHNOLOGY
JUNE 2014
JUL2 9 2014
C 2014 Massachusetts Institute of Technology. All rights reserved.
LI
BRARI ES
Sianature redacted
Ar
F!_s
Signature of Author:
,</ Department of Nuclear Science and Engineering, May 2014 Certified By:
S
Certified By: Certified By: Certified By: Accepted By:Signature red acted
ignature redacted
Richard Lanza Senior Research Scientist Thesis Supervisor
R. Scott Kemp Assistant Professor of Nuclear Science and Engineering
Signature redacted
Thesis Readerignature redacted
Gordon Kohse Principal Research Engineer Thesis Reader Tancredi Botto Principal Research Scientist, Schlumberger-Doll Research
Signature redactedReader
Mujid S. Kazimi TEPCO Professor of Nuclear Engineering Chairman, Department Committee on Graduate Students
Page-Analysis of the Optical Coupling of Wavelength-Shifting Fibers to Organic Liquid Scintillator Filled Fluoropolymer Tubes for
Industrial and Nuclear Security Applications by
CHAD C. SCHOOLS
Submitted to the Department of Nuclear Science and Engineering On May 16, 2014
in Partial Fulfillment of the Requirements for
the Degree of Doctor of Philosophy in Nuclear Science and Engineering Abstract
Industrial and nuclear security applications continue to push radiation detection development into new and exciting frontiers. In this work, an innovative detection module is developed and tested for use in a cosmic ray imaging (CRI) system designed for oil field characterization and is evaluated for its potential use in a fast neutron detection system for nuclear security applications. By measuring density changes in the reservoir, the CRI system will provide real-time information about steam chamber development during the enhanced oil field recovery process known as steam assisted gravity drainage (SAGD). The ability to monitor the development of the steam chamber region has the potential to provide important information, which could be used to optimize the growth and uniformity of the underground steam chamber and minimize costs. The organic liquid scintillator based detection modules also detect fast neutrons. During the initial characterization of an unidentified radioactive source, it is important to have the capability to determine if special nuclear material (SNM) is present and if it is configured to produce a nuclear yield. The emission of multiple neutrons during a single fission makes it possible to use this unique timing characteristic to identify SNM. The number of specialists trained to handle nuclear devices is limited making this determination a critical step in properly responding to the situation.
The detector module consists of a 5 mm diameter by 2-meter long fluoropolymer tube filled with organic liquid scintillator (OLS), optically read-out using wavelength shifting (WLS) fibers. The 1:400 ratio of diameter to length makes light collection from the organic scintillator very challenging. Over ten configurations of OLS, fluoropolymer tubes, and WLS fibers were tested. The final configuration consisted of two 2mm BCF-91A WLS fibers optically coupled to the outside of an optically transparent fluorinated ethylene propylene (FEP) tube filled with a commercial OLS (EJ-309). Cosmic ray muons produce large light pulses in the OLS of which a portion reaches the external WLS fibers. The WLS fibers re-emits the light at longer wavelengths and acts as a multi-mode light guide channeling the signal to photomultiplier tubes located at each end of the WLS fibers. This module demonstrated excellent detection efficiency with less than 5% signal reduction, at any point along the module,
due to optical attenuation. Timing analysis of the WLS fiber signals also provided coarse position determination, 40 cm, which opens design options not previously available.
An important characteristic required of neutron detectors for nuclear security applications is the ability to discriminate fast neutron and gamma ray events. Initial tests have demonstrated the capability of our module to discriminate neutron and gamma rays by applying the rise time pulse shape discrimination (PSD) method to the WLS fiber signals. EJ-309 is
well known for its PSD capabilities. Coupling this desirable characteristic with loss free, low
attenuation optical read-out through a WLS fiber has the potential to broaden significantly
liquid scintillator applications.
Thesis Supervisor: Richard Lanza
Title: Senior Research Scientist
Acknowledgments
I would like to thank my thesis committee members, Dr. Richard Lanza, Dr. R. Scott Kemp, Dr. Gordon Kohse, and Dr. Tancredi Botto for all of their guidance and mentorship. I am very thankful to the Schlumberger nuclear research team, Brad Roscoe, Tancredi Botto, Angel Manzur and Jim Haug. Their unlimited support made this possible. I would also like to thank my truly amazing family, Kerri, Jacob, Luke, Jared, and Isaac for their love, support, and sacrifice.
Table of Contents
Abstract ... 3
Acknow ledgm ents... 5
Table of Contents ... 6
List of Figures ... 10
List of Tables...17
1. Introduction... 18
1.1. M otivation... 18
1.1.1. Cosm ic Ray Im aging for SAGD ... 18
1.1.2. Fast Neutron Detection for Nuclear Security ... 22
1.2. Problem Statem ent ... 24
1.3. Importance of this W ork ... 24
1.4. Organization of this Thesis ... 25
2. Radiation Detection Using Organic Liquid Scintillators... 26
2.1. The Scintillation Process in Organic Liquid Scintillators... 27
2.2. The Effects of Excitation Density - Pulse Shape Discrimination...30
2.3. Scintillation Light from Muons, Neutrons, and Gamma Rays ... 33
2.3.1. M uon Source and their Interactions... 34
2.3.2. Neutron Sources and their Interactions... 36
2.3.3. Gamma Rays and their Interactions... 41
2.3.4. Summary of Expected Scintillation Light ... 44
3.1. Important Principles of Light Propagation... 47
3.2. Model of Light Propagation... 50
3.2.1. Light Propagation in Plastic Fibers... 50
3.2.2. Description of Simulation...51
3.2.3. Analytical Estimation ... 55
3.2.4. Comparing Modeled, Analytical, and Experimental Data...58
3.3. Modeling the Wavelength-Shifting Fiber Read-out...63
3.3.1. Properties of Wavelength Shifting Fibers... 63
3.3.2. Expected Light Collection Using WLS Fiber... 67
4. Detector Module Fabrication and Testing ... 70
4.1. Detector Module Materials ... 70
4.1.1. Choice of Organic Liquid Scintillators...70
4.1.2. Choice of Fluoropolymer Tubes ... 73
4.1.3. Choice of Wavelength Shifting Fibers... 74
4.2. Sample Detection Module Testing...75
4.2.1. Results for an Internal 2mm Diameter WLS Read-out... 76
4.2.2. Results for a Single 2mm WLS fiber - External ... 79
4.2.3. Results for Multiple WLS Fiber - External...82
4.3. Module Testing Summary... 84
4.4. Individual Detector Module Testing ... 84
5. D etecting M uons... 88
5.1.1. Experim ental Setup... 88
5.1.2. Results... 89
5.2. Evaluating the Full-Length Response of the Detection Module...91
5.2.1. Experim ental Setup... 91
5.2.2. Results... 93
5.3. Determining Interaction Position along Detection Module ... 98
5.3.1. Measurement of Light Exiting Wall of Fluoropolymer Tube...99
5.3.2. Pulse Tim ing M ethod ... 100
6. Detecting Neutrons ... 104
6.1. Experim ental Setup ... 104
6.2. D igital Pulse Shape Discrim ination A lgorithm s...107
6.2.1. Charge Ratio ... 108
6.2.2. Pulse Gradient Analysis M ethod ... 113
6.2.3. Rise Tim e M ethod ... 118
6.2.4. Pulse Shape D iscrim ination Sum m ary ... 123
6.3. Fast N eutron Detection Efficiency...124
7. Conclusions and Future W ork ... 125
7.1. Status of W ork Priorities...125
7.1.1. Cosm ic Ray Im ager ... 125
7.1.2. Fast N eutron Detector...126
7.2. Future W ork ... 127
Page-List of Figures
Figure 1.1. Crossed-helical design of SDR cosmic ray imaging (CRI) system. No fibers cross more than once in the I-meter length of the system. Coincident muon hits in adjacent rings determine the muon path. Reproduced with the permission of Schlumberger. 20 Figure 1.2. The muon interaction position is localized at the crossing point of adjacent fibers that experience a coincident event. The blue parallelogram determines the uncertainty in the position determination. The active length of the tool is L, the diameter of a ring of fibers is D, the individual fiber diameter is d, and the angle between fibers in adjacent rings is a. Reproduced with the permission of Schlumberger...21 Figure 1.3. When an unknown neutron source has been identified, it is necessary to determine
rapidly if special nuclear material is present and if it is in a configuration to produce a nuclear yield. A flexible OLS based detection system could provide a low cost alternative to expensive systems based on scarce 3
He. ... 23 Figure 2.1. Energy diagram for an organic liquid scintillator. A ternary system consists primarily of solvent molecules [X], with small quantities of primary solute molecules [Y], and secondary solute molecules [Z]. Solid green lines are excitations to higher states. Solid blue arrows are radiative transitions, fluorescence. Red dashed arrows are non-radiative transitions ... 28 Figure 2.2. Absorption and emission spectra for bis-MSB, a common secondary solute. The small region of overlap are the wavelengths where self-absorption can occur. Image is taken from V iren. ... ... ... 29 Figure 2.3. Spatial distribution of excitations and ionizations in organic scintillator. Particles with high specific energy loss create a track of high activation density along its path and secondary regions called blobs and spurs. Particles with low specific energy loss only create the blobs and spurs. Image is taken from Laustriat ... 30 Figure 2.4. Specific energy loss for protons (0-10 MeV)1 5
, electrons (0-1 MeV)1 5, and muon
(1-100 GeV)16 in toluene (C7H8). Ionization quenching of luminescence increases with increased specific energy loss ... 31 Figure 2.5. Comparison of scintillation light from electrons and protons in a xylene based organic scintillator. Ionization quenching provides alternate paths to internal degradation resulting in reduced prompt fluorescence for higher specific energy loss particles like protons. A 1 MeVee proton has the same light production as a 1 MeV electron but has an incident energy of 3 MeV. Image taken from Craun and Smith.18 ... 3 2 Figure 2.6. Differential and integrated curves showing the time dependence of gamma ray versus neutron response in a xylene based liquid scintillator. The time dependence can be used to differentiate incident radiation based upon its specific energy loss (dE/dx). Images taken from Kuchnir et al.1 9 . . . .33 Figure 2.7. The cosmic ray muon angular distribution is proportional to the square of the cosine of the zenith angle. Each colored section represents 25% of the incident muons. Fifty percent are incident at zenith angles less than 37.5". The black line is at 450. Integration over all angles gives a muon flux of-1 min- cm-2
Figure 2.8. Estimating the muon path length through a horizontal tube. Based on the muon angular distribution at sea level the simulation randomly chooses a muon path and determines the path length through the tube. The mean path length is determine to be 86 3 % of the diam eter ... 36 Figure 2.9. Hypothetical implosion-type nuclear weapon made of concentric sphere shells with a hollow center. The fissile core consists of 4 kg of weapons-grade plutonium with a thickness of 1.23 cm and an outer radius of 7 cm. The tamper is made of depleted uranium. Measurements provided are the thickness of each shell giving an overall outer diameter of 46 cm. Reproduced from Fetter, et al..8 ... . . .. . . . .. . . .. . . . . 37 Figure 2.10. Neutron energy distribution for spontaneous fission of 240Pu and 2
12Cf, neutron-induced fission in 239Pu, and alpha-neutron interaction (a,n) in Am-Be. The fission energy spectrum is defined by the Watt spectrum.2 3
In the Am-Be neutron source an alpha particle from the 2 41Am interacts with the Be to produce a neutron .24...39
Figure 2.11. Elastic scatter neutron cross-section for hydrogen and carbon. Elastic scatter cross-section dominates at all energies of interest. In the fission neutron energy region (0.1 MeV to 10 MeV), the cross-sections remain almost constant at 20 barns for hydrogen and 5 barns for carbon as shown in the inset. ... 40 Figure 2.12. Scintillation light produced in EJ-309 as a function of recoil proton energy. The range of proton energy is based on the incident neutrons from 2 40Pu and Am-Be
interacting with hydrogen. The reduced scintillation light in EJ-309 due to the high specific energy loss of protons is based on data published in 2013 by Enqvist et al.2 7
... 4 1 Figure 2.13. Attenuation coefficients in organic liquid scintillator for 1 keV to 5 MeV gamma
rays.2 9 Compton scatter is the primary interaction for gamma ray energies between
0.1 MeV and 1.0 MeV. Klein-Nishina calculation shown for comparison...43 Figure 2.14. Compton continuum for a 1 MeV gamma ray. The Klein-Nishina formula
describes the angular distribution of Compton scattering, and therefore, the Compton electron energy distribution. The maximum energy transfer occurs when the gamma ray is back scattered and corresponds to the Compton edge. This is the maximum energy deposited in the liquid scintillator assuming the probability of multiple Compton scatters in the small detector module is very low...44 Figure 3.1. Diagram of light incident on the boundary between two materials with indices of
refraction ni and n2. The transmitted light obeys the law of refraction. The direction of the reflected light will depend on the nature of the boundary. In specular reflection,
A, = a. In diffuse reflection, the reflected angle is random is random in nature...47 Figure 3.2. Plots of reflection coefficients based on Fresnel's formulas for boundaries between EJ-309 (n = 1.57) and PTFE (n = 1.37). Top: Light entering EJ-309, having a higher index of refraction than PTFE, will not experience TIR. Bottom: Light entering PTFE, having a lower index of refraction than EJ-309, will undergo TIR at incidence angles greater than the critical angle,
Oc,
i.e., for Oi> Oc, R= 100%. ... 49 Figure 3.3. Measurements of optical properties of common reflectors. Left: Experimental setup to determine the reflective properties where OL is the laser angle of incidence, and OD and < describe the position of the detectors that measure the reflected laser light. Image taken from Janecek and Moses.3 4 Right: Measurement of PTFE reflectivity asa function of OD at 4=0 c for laser angles of incidence equal to 420, 500, 580, 660, and
74'. PTFE shows a predominantly diffuse reflectivity with specular properties at larger
laser angles of incidence. Image taken from Janecek and Moses.31...50 Figure 3.4. Schematic of organic liquid scintillator filled fluoropolymer tube (not to scale).52 Figure 3.5. Flow diagram for light propagation model. Blue items are simulation m odifications discussed in section 3.3.1 ... 54
Figure 3.6. Example of photon paths in PTFE tubing from an isotropic point source located in the center of the tube. Green lines represent the photon paths and the red points are outer w all transm issions... 55 Figure 3.7. Discretization of the angle 0 for an analytical approximation of signal attenuation. The angles are grouped based on the number of specular reflections, n. Photons emitted at larger 0 experience more reflections before reaching the end of the tube...56 Figure 3.8. Analytical characterization of light losses in OLS filled PTFE tubing assuming
specular reflections with -90% reflectivity and a bulk attenuation length of 1 meter. Large 0 photons, 0 > 100, contribute the majority of the signal for the first 30 cm while the small 0 photons, 0 < 100, contribute the majority of the signal for the last 50 cm. The signal is attenuated by more than an order of magnitude within 90 cm. See text for additional inform ation. ... 58 Figure 3.9. A portion of the light escaping the OLS filled PTFE tube is captured by a H8500 PMT that triggers the acquisition of the end PMTs. ... 59 Figure 3.10. Left and right PMT signals using an OLS filled PTFE tubing with a Sr-90 source located 75 cm from the left PMT. The left PMT signal demonstrates the signals significant attenuation in just 75 cm. More than 40% of the left PMT signals fall below a measurable cutoff while only 3% of the right PMT signals were below a measurable cu to ff ... 6 1 Figure 3.11. One meter long EJ-309 filled PTFE tube (4AWG). Comparison of modeled, analytical, and experimental data. The large attenuation in the first 50 cm makes reading the OLS light at the end of the tube impractical. ... 62 Figure 3.12. Saint-Gobain wavelength shifting fiber BCF-91A diagram.38 Photons entering the WLS fiber can be absorbed and re-emitted isotropically at longer wavelengths. Only photons re-emitted such that their incident angle at the core-cladding interface is greater than the critical angle are channeled down the fiber...64 Figure 3.13. Example of WLS fiber capturing OLS light produced by a muon. As scintillation
light is produced in the OLS a portion will enter the WLS fiber. The probability that the light will be absorbed depends on the path length of the light through the WLS fiber, e.g., xi and x2 ... 64 Figure 3.14. Mean Free Path in Saint-Gobain WLS fiber as a function incident photon wavelength.46 The mean free path for a 425 nm wavelength photon, the peak wavelength for many common OLS, in the BCF9 lA is 0.21 mm, i.e., near the minimum mean free path as required for optimal photon absorption and re-emission...65 Figure 3.15. EJ-309 emission spectrum2 1
and Saint-Gobain BCF-91A WLS fiber absorption and emission spectra.38 Emission and absorption are well matched to maximize
wavelength shifting. Small overlap between WLS fiber emission and absorption m inim izes self-absorption. ... 66 Figure 3.16. Example of modeled configuration with 2mm diameter WLS inside OLS filled A W G 4 PTFE tube ... 68
Figure 3.17. Sr-90 and Cs137 spectra collected using a 2mm WLS inside an OLS filled PTFE tube. Modeled signal for a 0.5 MeVee, 1.0 MeVee, and 2.2 MeVee, marked with dashed lines, are included for comparison. ... 69 Figure 4.1. The WLS fiber polystyrene core was dissolved by EJ-309 at room temperature
leaving behind the outer PMMA cladding...72 Figure 4.2. PMMA tubing before (top) and after (bottom) being submerged in EJ-305 for six
m onth s...72
Figure 4.3. Spool of 2 mm diameter BCF-91A wavelength shifting fiber manufactured by Saint-Gobain Ceramics & Plastics, Inc... 74 Figure 4.4. Example of WLS fiber before (left) and after (right) sanding and polishing...75 Figure 4.5. Multiple WLS fiber configurations are sanded and polished together to improve
the optical connection to the PMT. A white Teflon collar (right) was used to hold the three 1 mm diameter WLS fibers together...75 Figure 4.6. Experimental setup for sample module testing. A H8500 PMT was used to monitor
light escaping the side of the OLS filled tube. In order to capture events localized at the source, only two pixels of the H8500 were used. The WLS light was captured by a R6095 PMT and recorded when the H8500 signal was above an established threshold. ... 7 6 Figure 4.7. Teflon caps at each end of the fluoropolymer tube provide a seal around a single WLS fiber and the tube. Clear EJ-309 inside the tube appears yellow due to the subm erged W LS fiber. ... 77
Figure 4.8. Spectra from Sr-90 using a 2mm WLS fiber inside FEP and PTFE tubing filled w ith E J-309 . ... 78 Figure 4.9. The external application of WLS fiber read-out allows for different configuration to optim ize the OLS light collected... 79 Figure 4.10. Spectra from Sr-90 using external 2mm WLS fiber. Configurations include four combinations of AWG4 FEP and PTFE tubing with EJ-305 and EJ-309. Note that the optical clarity of FEP (96% transparent) compared to PTFE(opaque) does not appear to be a critical factor at the 0.51 mm wall thickness. The external configuration signals are approximately 1/3 of the internal configuration signals seen in Figure 4.8...81 Figure 4.11. Spectra from Sr-90 using external multiple 1 m and 2mm diameter WLS fibers
with FEP and PTFE tubing filled with EJ-309. The external configuration provides the ability to increase the number of WLS fibers with the potential to increase further the length of the m odule... 83 Figure 4.12. Two-meter detection module testing. The H8500 PMT and a Sr-90 source are placed at the 1.5 cm openings in the white Teflon tape which are positioned every 20 cm along the detection module. High voltage supplies provide separate bias to the H8500 and two R6095 PMTs located in dark boxes at each end of the module. Signals
from each PMT are connected to a Fan in/out module and then connected to the CAEN V 175 1 d igitizer...86 Figure 4.13. Attenuation length determination for a two-meter long detection module. The
initial 80-100 cm can be characterized with an attenuation length of X1 = 0.8 0.1 m
and the final 100 cm can be characterized with an attenuation length of X2 = 2.8 0.7 m. Previous data from OLS filled PTFE, shown in black, has 7 times less signal at 1-m eter...87
Figure 5.1. OLS module versus plastic fiber muon detection efficiency experimental setup. All plastic scintillator (1" x 1" x 4") events above 200 mV triggered the collection of the OLS module and plastic fiber signal. All OLS module and plastic fiber events above 30 mV were counted as muon events. ... 89 Figure 5.2. Comparison of OLS module and plastic fiber pulse height spectra. The OLS module and plastic fiber signals were collected when a large rectangular scintillator (trigger) measured an event above -200 mV. Of the 140,000 triggered events, less than 20,000 were coincident with OLS module or plastic fiber signals over 30 mV. ... 90 Figure 5.3. Signal processing for characterizing the detection module response to muons...92 Figure 5.4. Detection module's response to muons at 20 cm from the left PMT. No more than 0.2% of triggered events are undetected by the either the left or right PMT...95 Figure 5.5. Detection module's response to muons at 60 cm from the left PMT. No more than
0.3% of triggered events are undetected by the either the left or right PMT...95 Figure 5.6. Detection module's response to muons at 100 cm from the left PMT. No more
than 0.2% of triggered events are undetected by the either the left or right PMT. ... 96 Figure 5.7. Detection module's response to muons at 140 cm from the left PMT. No more than 0.5% of triggered events are undetected by the either the left or right PMT. ... 96 Figure 5.8. Detection module's response to muons at 180 cm from the left PMT. No more than 0.4% of triggered events are undetected by the either the left or right PMT. ... 97 Figure 5.9. A pixelated H8500 PMT was used to measure the distribution of light escaping the side of a FEP tube. The top row of a H8500 PMT consists of eight pixels. 90Sr pulse height spectra are collected from each pixel for the source placed at the five location identified . ... 99 Figure 5.10. Light escaping the side of the side of the fluoropolymer tube is localized around the interaction point. Shown are the average pulse height for each pixel for three different source locations. The maximum pulse height is found facing the source location and rapidly decreases within two pixels. This corresponds to an effective 24 mm region in which light escapes a localized interaction point...100 Figure 5.11. Position determination using pulse arrival time at left and right PMTs...101 Figure 5.12. Timing information from muon data was used to determine the interaction
lo cation ... 102 Figure 5.13. Analysis of timing information ability to discriminate between two potential interaction points separated by 100 cm. Less than 0.25% of events occurring 100 cm apart will be misidentified when using timing data from both fibers in coincidence. ... 10 3
Figure 6.1. Experimental setup for fast neutron detection application. Above: Equipment placed inside lightproof container. One R6095 PMT is used to evaluate the pulse shape discrimination directly in the EJ-309 and the second R6095 PMT is used to measure the WLS fiber signal. A lead shield was used to reduce the AmBe gamma rays reaching the OLS filled tube. Below: The electronics included a V1751 digitizer, a DT5720 digitizer (not shown), and a V6521 high voltage power supply. ... 106 Figure 6.2. Neutron and gamma ray pulses collected from OLS filled FEP tube. The extended tail of the neutron pulse is the basis of pulse shape discrimination. Degradation in the timing or amplitude of the pulses results in degraded pulse shape discrimination capability. Multi-point moving average filters are commonly used to reduce noise before applying PSD algorithm s. ... 108 Figure 6.3. The charge ratio method applied to light escaping the side of the EJ-309 filled tube for an AmBe source compared to a 60Co source using the V1751 digitizer. The discrimination line was graphically identified and resulted in a FOM=0.53...109 Figure 6.4. The charge ratio method applied to light escaping the side of the EJ-309 filled tube
for an AmBe source compared to a 60Co source using the DT5720 digitizer. The discrimination line was graphically identified and resulted in a FOM=0.52...110 Figure 6.5. The charge ratio method applied to WLS fiber signal for an AmBe source compared
to a 60Co source using the VI 751 digitizer. The WLS fiber signal shows no clear pulse shape discrim ination...111 Figure 6.6. The charge ratio method applied to WLS fiber signal for an AmBe source compared
to a 60Co source using the DT5720 digitizer. The WLS fiber signal shows no clear pulse shape discrim ination...112 Figure 6.7. The pulse gradient analysis (PGA) method applied to light escaping the side of the
EJ-309 filled tube for an AmBe source compared to a 60Co source using the V1751 digitizer. The discrimination line was graphically identified and resulted in a F O M = 0 .40...114
Figure 6.8. The pulse gradient analysis (PGA) method applied to light escaping the side of the EJ-309 filled tube for an AmBe source compared to a 60Co source using the DT5720 digitizer. The discrimination line was graphically identified and resulted in a F O M = 0 .40 ... 115 Figure 6.9. Pulse gradient analysis (PGA) method applied to WLS fiber signal for an AmBe source compared to a 60Co source using the V1751 digitizer. The WLS fiber signal shows no clear pulse shape discrim ination. ... 116 Figure 6.10. Pulse gradient analysis (PGA) method applied to WLS fiber signal for an AmBe source compared to a 60Co source using the DT5720 digitizer. The WLS fiber signal shows no clear pulse shape discrim ination. ... 117 Figure 6.11. Rise time method of pulse shape discrimination measures the time required for an integrated pulse to reach 80% of its maximum. ... 118 Figure 6.12. The rise time method applied to light escaping the side of the EJ-309 filled tube for an AmBe source compared to a 6 0Co source using the V1751 digitizer. The
Figure 6.13. Rise time method applied to light escaping the side of the EJ-309 filled tube for an AmBe source compared to a 60Co source using the DT5720 digitizer. The discrimination line was graphically identified and resulted in a FOM=0.58...120 Figure 6.14. The rise time method applied to the WLS fiber signal for an AmBe source
compared to a 60Co source using the V1751 digitizer. The discrimination line was graphically identified and resulted in a FOM =0.45. ... 121 Figure 6.15. The rise time method applied to the WLS fiber signal for an AmBe source compared to a 60Co source using the DT5720 digitizer. The discrimination line was graphically identified and resulted in a FOM =0.43. ... 122 Figure 7.1. Fluoropolymer tubes can be extruded in many forms opening up many configurations to be considered (not to scale). The WLS fibers are placed in pre-made grooves or channels simplifying the manufacturing of the modules...128
List of Tables
Table 2.1. Estimated Neutron Source Escaping Surface of a Plutonium Based Nuclear
W eapon .2 ... 38
Table 2.2. Estimated Light Production for Muons, Neutrons, and Gamma Rays ... 45
Table 4.1. Sample Detection Module Configurations Tested... 70
Table 4.2. Physical Properties of Organic Liquid Scintillators. ... 71
Table 4.3. Physical Properties of Fluoropolymer Tubes." ... 73
Table 4.4. Testing Summary of Internal Configurations with Single 2mm WLS Fiber...78
Table 4.5. Testing Summary of External Configurations with Single 2mm diameter WLS F ib er...8 1 Table 4.6. Testing Summary of External Configurations with Multiple 1mm and 2mm D iam eter W LS Fibers. ... 83
Table 5.1. Muon Detection Efficiency Comparison Data. ... 91
1. Introduction
A wide range of industrial and government applications continue to push radiation detection development into new and exciting frontiers. Advanced detection systems require innovative solutions to meet technical specifications such as efficiency, angular resolution, energy resolution, and timing resolution while performing under demanding operational constraints such as a wide range of temperatures, varying background radiation, mechanical shock, dimensions, and weight. Technology advancements in the areas of signal processing, optical light read-out, detection materials, equipment miniaturization, and computer model simulations enable these concepts to become a reality.1'2 In this work, an innovative detection
module is developed and tested for use in a cosmic ray imaging system designed for oil field characterization and is evaluated for its potential use in a fast neutron detection system for nuclear security applications.
1.1. Motivation
1.1.1. Cosmic Ray Imaging for SAGD
Canada's heavy-oil reserve, one of the largest in the world, has an estimated 175 billion barrels of which 80% are too deep for open pit mining.3
Research on in-situ methods using steam to extract the heavy oil from the sand began in the 1970s but it wasn't until 2002 that the first production from a commercial steam assisted gravity drainage (SAGD) project was realized.4 Now (2014), over 50% of the oil Canada produces is from in-situ methods like SAGD, with continued growth expected. The SAGD method uses two horizontal wells separated by approximately 5 meters. Steam, pumped at high pressures into the top well (aka the injector well), penetrates the reservoir. In doing so, it heats up the local bitumen until its viscosity is low enough to allow it to flow by gravity into the lower well (aka the producer
well). The mobilized oil or bitumen is then pumped from the production well to the surface for processing. Natural gas consumption for steam production accounts for 60% to 70% of the total operation costs for SAGD plants, making steam management an important aspect of SAGD operations.3
The ability to monitor the development of the steam chamber region has the potential to provide important information to the operator, which could be used to optimize the growth and uniformity of the underground steam chamber and minimize costs.
As part of this thesis, a cosmic ray imaging (CRI) system has been developed at Schlumberger-Doll-Research (SDR) Center with the goal of providing in-situ and near-real-time information about steam chamber development in a SAGD field.
Cosmic ray muons continually penetrate the earth's surface and their flux is attenuated as they travel underground. As a SAGD steam chamber develops, the bitumen is replaced with steam, decreasing the density in the reservoir. Muons passing through this lower density region are attenuated less, resulting in an increased muon flux in that direction. The density across the field can be monitored in real time by measuring the muon intensity and direction.
This technique of muon imaging has been used in several other applications including studies of the interior of volcanos.5'6 SDR has developed a prototype device that was tested with Suncor Energy Inc. in a SAGD observation well at MacKay River, in the Ft. McMurray region of northern Alberta, Canada.7 The intent of the field test was to demonstrate the deployment capability, verify the stability of the system in an operational environment, and establish constant remote data monitoring. Based on the data collected and Monte-Carlo modelling, improved muon detection rates, i.e., increased area, is required to identify density changes more rapidly and accurately.
The operational constraints of downhole monitoring and the required geometries for a CRI borehole detector limits the available options to improve the muon detection rate or the angular resolution of the density mapping. The CRI design requires many long-thin detection
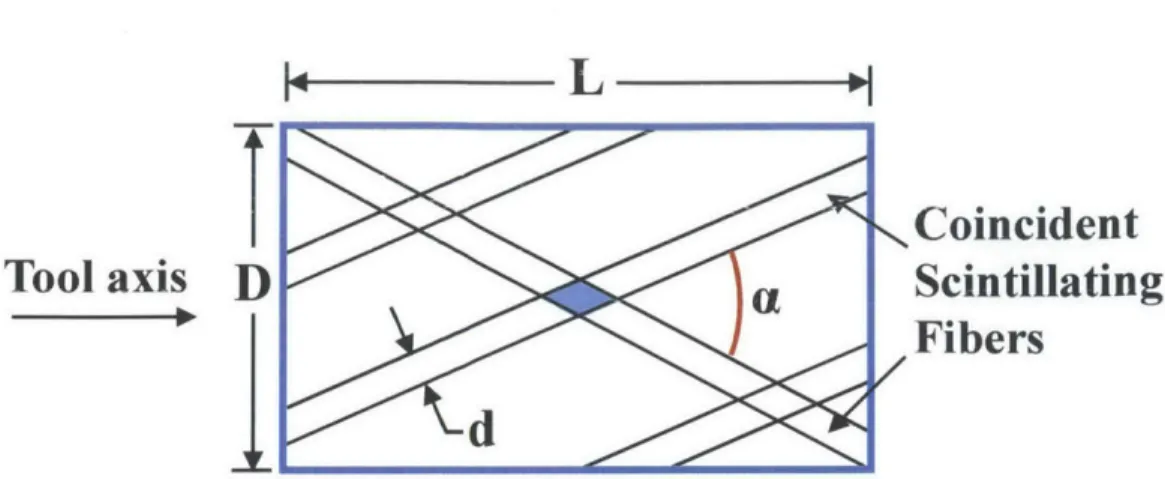
modules as shown in Figure 1.1. The crossed helical pattern allows the position along the axis of the tool to be determined by observing coincident events in adjacent rings. Adjacent ring fibers cross only once in the length of the tool. When a coincident event occurs, the interaction position is localized at the crossing point of the two coincident fibers as shown in Figure 1.2. The blue parallelogram defines the uncertainty in the position determination and depends on the active length of the tool, L, the diameter of the fiber rings, D, and the diameter of the individual fibers, d. When there is at least two pairs of coincident fibers the muon trajectory is reconstructed using their crossing points. The angular resolution of the density mapping worsens with position uncertainty. There is a tradeoff between an increase in the muon detection rate, that is proportional to the active area D x L, and the degradation in angular resolution as L is increased. It is important to recognize that a valid muon event can be easily discriminated from background gamma ray and neutron events since we require a hit in at least four fibers.
Figure 1.1. Crossed-helical design of SDR cosmic ray imaging (CRI) system. No fibers cross more than once in the 1-meter length of the system. Coincident muon hits in adjacent rings determine the muon path. Reproduced with the permission of Schlumberger.
|-
L
-:j
I
Coincident
Tool axis D
Scintillating
Fibers
d
Figure 1.2. The muon interaction position is localized at the crossing point of adjacent fibers that experience a coincident event. The blue parallelogram determines the uncertainty in the position determination. The active length of the tool is L, the diameter of a ring of fibers is D, the individual fiber diameter is d, and the angle between fibers in adjacent rings is a. Reproduced with the permission of Schlumberger.
The initial CRI design used a fluoropolymer tubing, PTFE (polytetrafluoroethylene), filled with organic liquid scintillator (OLS) with the concept that the design would provide a large optical signal with flexible dimensions. However, the OLS filled PTFE tubes demonstrated a very poor attenuation length making them impossible to use. With the pressing need for an operational prototype, a system with an outer diameter of 3.5 inches was constructed using 5-millimeter diameter by 1-meter long plastic scintillating fibers. This system was suitable for initial testing but future designs require the muon count rate to be maximized to reduce statistical uncertainties of the density mapping. Although plastic scintillators provide a large signal and good attenuation, they do not readily provide the flexibility to increase the length of the system since as the length of the plastic fiber increase, they are more susceptible to damage and the cost of manufacturing increases. In turn, the use of multiple one-meter systems requires each system to have its own light collection and electronics, which is cost prohibitive. Therefore, a practical system for SDR required an efficient muon detection module that provided a measurable signal at lengths of 2-meters or greater.
1.1.2. Fast Neutron Detection for Nuclear Security
While developing the detection module for the cosmic ray imager, its potential as a fast neutron detector for nuclear security also became apparent. With so many diverse commercial applications using radioactive sources and a complex and varying background radiation, it is difficult to distinguish between benign sources of radiation and a nuclear device that could produce an explosive yield of 10 kilotons (kt) or greater. The number of specialist trained to handle nuclear devices is limited, making the characterization of a neutron source as special nuclear material (SNM) as early as possible a critical step in properly responding to the incident. As one would expect, this is not a trivial matter considering the vast configurations of nuclear weapons and radioactive materials.
In general, the primary fissile isotopes of concern are uranium-235 (2
11U) and plutonium-239 (2 39
Pu). In practical scenarios, the neutron signature from a 23 5U-based weapon is undetectable.8 Therefore, we focus on the detection of neutrons from 239Pu-based weapon.
Weapons grade plutonium (WgPu) is produced by irradiating uranium-238 (2 3 8U) in a nuclear reactor and consists primarily of 2 39
Pu. WgPu will also have small amounts of other isotopes including plutonium-240 (2 40Pu). Given the typical amount of 2 40
Pu present and its relatively high spontaneous fission rate, this is the primary source of neutrons from WgPu. Although the fission neutrons will have a unique energy spectrum, this will be difficult to measure since portable neutron spectrometers are difficult to make.
Current systems primarily rely on multiplicity counting, a technique that relies on the unique coincidence signature that arises from multiple neutrons being produced in each spontaneous or induced fission. These systems, notably the NPOD9' 10 developed at Los Alamos National Laboratory (LANL) and the Fission Meter" developed by Livermore National Laboratory (LLNL) and commercialized by ORTEC, use large quantities of
helium-3 (helium-3He) detectors and rely on moderation to thermalize the fast fission neutrons before capturing them. The time required to moderate the neutrons significantly degrades the coincidence timing capabilities requiring longer collection times. In addition, the existing 3He shortage makes wide deployment of the NPOD or Fission Meter impossible. Developing a fast neutron detector, such as the one shown in Figure 1.3, that is low cost non-3He based and that can deploy with local first responders, has the potential to provide new rapid characterization capabilities that will guide the intelligent deployment of our limited personnel trained to respond to and render-safe nuclear weapons.
Figure 1.3. When an unknown neutron source has been identified, it is necessary to determine rapidly if special nuclear material is present and if it is in a configuration to produce a nuclear yield. A flexible OLS based detection system could provide a low cost alternative to expensive systems based on scarce 3He.
1.2. Problem Statement
The primary goals of this work are to develop an alternative detection module for cosmic ray imaging with the following characteristics:
o Operate at a continuous length of at least two meters with comparable muon detection efficiency to conventional plastic fibers,
o Have enough flexibility to conform to the helical CRI geometry,
o Have the potential to survive multi-year deployment without maintenance, and o The ability to provide interaction position along module would be an additional
(but not required) benefit.
Additional requirements for fast neutron detection are secondary to the CRI requirements. This portion of my research will evaluate the CRI detection module for use in a fast neutron detector with the following criteria:
o Maximize fast neutron detection efficiency to minimize data collection times, o Have the potential to discriminate between neutron and gamma ray events, and o Have a scalable form factor able to conform to operational scenarios.
1.3. Importance of this Work
Scintillation light collection in long-thin geometries has always been a challenge. In the development of a detection module for cosmic ray imaging, a simple, cost effective, and scalable solution was built and tested. This not only provides the building blocks for a scalable cosmic ray imager, it also opens a wide range of detection designs that may not have been considered without this capability. The potential to discriminate neutron and gamma ray events based on the WLS fiber read-out further expands its possibilities. Current nuclear security
multiplicity counters rely on large quantities of scarce 3He. The ability to detect fast neutrons and discriminate gamma ray background makes these organic liquid scintillator filled fluoropolymer tubes a viable alternative to the current 3He systems.
1.4. Organization of this Thesis
This thesis is organized into seven chapters. The first chapter discusses the motivation to seek a detection module that meets requirements for a cosmic ray imaging system and a fast neutron detector. The second chapter provides the technical background of detecting muons, neutrons, and gamma rays with an organic liquid scintillator. An estimate of the scintillation light from each source is also calculated. In Chapter 3, a model of light propagation in fluoropolymer tubes and of light collection in wavelength shifting fibers is used to estimate expected signals. Chapter 4 outlines the construction and initial testing of the detection modules. Chapter 5 analyzes the detection modules performance detecting muons for the CRI application. Chapter 6 analyzes the detection modules performance detecting neutrons for the fast neutron detector application. Finally, the conclusions from this work and recommendations for future research are provided in Chapter 7.
2. Radiation Detection Using Organic Liquid Scintillators
The advantages of organic liquid scintillators (OLS) over other options, such as plastics or high-pressure gases, are many. First, viable OLS options produce more scintillation light (characteristic visible and ultraviolet light) than the plastic fibers while having a faster decay time resulting in more accurate timing measurements. Second, the liquid scintillator can also be held in almost any size or shape container that allows the scintillation light to be collected directly or through a wavelength shifter. Next, the bulk costs of OLS makes it the most inexpensive option available. Finally, OLS have the added benefit of being an efficient fast neutron detector and some OLS have neutron-gamma ray discrimination capabilities.There are, of course, some disadvantages of using liquid scintillators that need to be considered and compensated for. First, creating a leak-proof system can present some challenges and some liquid scintillators have flashpoints as low as 26*C/790F. For long-term applications, airtight systems are required to prevent dissolved oxygen from degrading the light output over time. Some liquid scintillators are also toxic, which may limit their application where the potential for human contact is more likely. With the wide range of commercially available OLS and the many systems currently employing them, these disadvantages can be mitigated.
Generally, OLS are benzene-based compounds with valence electrons occupying a-and a-molecular orbitals. The a-orbitals are strongly centered with the molecule but the n-orbitals can be delocalized. When the i-electron spins are fully paired the molecule is in a singlet state and when they are unpaired it is in a triplet state. Energy deposited by incident radiation results in electrons jumping to higher energy singlet and triplet states through different processes that will be described later. Transitions between these i-electronic states produce the scintillation light that is converted through a photomultiplier to the electrical
signals measured.1 2 There are two principle types of liquid scintillators, binary and ternary systems. In both systems, there is a solvent, such as toluene or p-xylene, which is the primary constituent of the system and where the incident radiation deposits its energy. In a binary system, the solvent dissolves a small concentration of solute, such as p-terphenyl. This primary solute produces the fluorescence after the deposited energy is transferred from the solvent. In a ternary system, a secondary solute, such as POPOP (1,4-Bis-(2-(5-phenyloxazoly))-benzene), acts as a wavelength shifter absorbing the primary solute's fluorescence and re-emitting at longer wavelengths.1 2
In this chapter, we review the scintillation light from the interactions of muons, neutrons, and gamma rays inside an OLS. First, we describe the population of various singlet and triplet ir-electronic states of a ternary system and the associated radiative and non-radiative processes. Next, the effect of excitation density, i.e., the spatial distribution of excitation and ionization, on the population of excited singlet and triplet states and their subsequent de-excitation is discussed. Then, we present descriptions of the muon, neutron, and gamma ray sources of importance to this work and finally the expected scintillation light from each.
2.1. The Scintillation Process in Organic Liquid Scintillators
As described earlier, a ternary system consists primarily of solvent molecules [X], with small quantities of primary solute molecules [Y], and secondary solute molecules [Z]. The scintillation process starts with a charged particle exciting and ionizing X. Figure 2.1 shows a general energy level diagram for X, Y, and Z and the main transitions that can occur. Transitions from higher states to lower states are radiative if they emit light, shown as solid blue arrows, or non-radiative if they do not emit light, shown as dashed red arrows. Excitations, shown as solid green arrows, result in the population of excited singlet states of Six, S2X, and
molecular vibrations is on the order of picoseconds resulting in the rapid non-radiative transitions from higher energy states, called internal degradation, to Six. The X and Y combination is chosen to maximize non-radiative transitions from Six to excited states of Y, shown with a horizontal red arrow. Similarly, the internal degradation to Siy from higher states happens rapidly. Unlike the X and Y combination, the Y and Z combination is chosen to maximize radiative transitions from Siy to the excited states of Z, shown with a solid blue arrow connecting Soy and Soz. After the rapid internal degradation from higher states to Siz, the secondary solute produces prompt fluorescence, which is the largest contribution to the total scintillation light. The fluorescence is at longer wavelengths reducing re-absorption in X or Y. These radiative transitions also decay to higher energy vibrational states Sonz emitting longer wavelength photons and further reducing the potential for self-absorption in Z. Figure
2.2 shows the absorption and emission spectra of the common secondary solute bis-MSB.
S3 x SX 2 1 - -.---. S2 S13 --- -4 --- -12X - -. Aj
S
-- --- 2 S12Y ---Siy Sz I12Z S11Z -- - - . 5 03X 3.. 01Y S:-
IFsox
SOY IOZ
Figure 2.1. Energy diagram for an organic liquid scintillator. A ternary system consists primarily of solvent molecules [XI, with small quantities of primary solute molecules lY], and secondary solute molecules IZI. Solid green lines are excitations to higher states. Solid blue arrows are radiative transitions, fluorescence. Red dashed arrows are non-radiative transitions.
1 W0.8 0 .6
0o.4
0.2 0 250 300 350 400 450 500 550 600Wavelength (nm)
Figure 2.2. Absorption and emission spectra for bis-MSB, a common secondary solute. The small region of overlap are the wavelengths where self-absorption can occur. Image is taken from Viren."
In addition to excited singlet states, inter-system crossing and ion recombination populate excited triplet states, which are not shown. The inter-system crossing is a low probability process in which Six relaxes to lower energy excited triplet state. Ion recombination preferentially populates excited triplet states over excited singlet states three to one. Higher excited triplet states also undergo internal degradation rapidly transitioning to Tix. Radiative transitions from Tix to Sox, called phosphorescence, are forbidden with lifetimes from microsecond to seconds and its contributions are considered insignificant relative to fluorescence. Another possible transition is the annihilation of two triplet states,
Tix+Tix - Sox+ Six (2.1)
producing additional excited singlet states. These Six states decay with the same rate and spectrum as the prompt fluorescence but is delayed by the migration time of the triplet states and considered the main contributor to delayed fluorescence. The density of ionization and excitation affects the internal degradation and triplet annihilation processes.
-
bis-MSB emission
bis-MSB absorpton
2.2. The Effects of Excitation Density
-
Pulse Shape Discrimination
In 1968, Laustriat described the spatial distribution of the energy deposition as shown in Figure 2.3. Particles with high specific energy loss, dE/dx, in the solvent will produce regions of high activation along its track and in "spurs" and "blobs" outside the track. Particles with low dE/dx in the solvent will not create a region of high activation along its track. The extent of these high activation regions produce two effects, ionization quenching and increased triplet annihilation, that change the scintillation light profile and can be used to discriminate incident radiation based on its specific energy loss. The specific energy loss for muons, protons, and electrons are shown in Figure 2.4. Although the exact mechanism that suppresses the prompt fluorescence is still disputed, the quenching appears to occur before the lowest excited state Siz is populated.1 2 The high density of ionization appears to provide alternate paths for the higher singlet states that do not lead to the lowest excited state Siz.
0
0
Excitat0
G
G
lonizat Spur- - _0
'/ High a0
' densit3 -ray 0 00
00
Track +
/particle
- pathion ion
ctivation yregions
Figure 2.3. Spatial distribution of excitations and ionizations in organic scintillator. Particles with high specific energy loss create a track of high activation density along its path and secondary regions called blobs and spurs. Particles with low specific energy loss only create the blobs and spurs. Image is taken from Laustriat.1 4
Specific Energy Loss (dE/dx) in Toulene 500 e Proton (E x 10 MeV) m Electron (E x I MeV) + Muon (E x 100 GeV) 10050 -5 0.0 0.2 0.4 0.6 0.8 1.0 Ehergy (E)
Figure 2.4. Specific energy loss for protons (0-10 MeV)'5, electrons (0-1 MeV)15, and muon (1-100 GeV) in toluene (C7H8). Ionization quenching of luminescence increases with increased specific
energy loss.
Birks' semi-empirical formula is commonly used to describe the reduced scintillation response per unit path length dL/dx as a function of dE/dx:
d E
d L SdE
dx
=(2.1)
dx
(1+kBd
k dx)where S is the scintillation efficiency and kB describes the fraction of the excitations that are quenched.'7 Craun and Smith added a second order quenching term improving the fit for
particle with larger specific energy loss.'8 Increased ionization quenching due to higher specific energy loss leads to a lower scintillation yield as shown in Figure 2.5. The term MeV electron equivalent (MeVee) has been introduced to quantify the light yield of heavy charged particles. A one MeVee proton would have an incident energy of several MeV.
NE-213
ELECTRON . W -a U) aY
~1
MeVee Proton
04 PROT NE PARAMETERaxaa 02- WO PARAMETER-ATA POINTSI
100 10'PARTICLE ENERGY (MeV)
Figure 2.5. Comparison of scintillation light from electrons and protons in a xylene based organic scintillator. Ionization quenching provides alternate paths to internal degradation resulting in reduced prompt fluorescence for higher specific energy loss particles like protons. A
1 MeVee proton has the
same light production as a I MeV electron but has an incident energy of 3 MeV. Image taken from Craun and Smith."The second effect introduced in regions of high activation is increased triplet annihilation. As described in Section 2.1, excited triplet states are primarily populated by ion recombination. Regions of high ionization lead to higher densities of triplet states increasing the delayed fluorescence contribution to the total scintillation light. Figure 2.6 shows the differential and integral pulses in a xylene based liquid scintillator (NE213) from a gamma ray and a neutron interaction. The scattered proton from the neutron interaction has a larger specific energy loss than the scattered electron from the gamma ray interaction. The resulting delayed fluorescence remains a small fraction of the total scintillation light but this difference in pulse shape can be detected with common pulse shape discrimination techniques and provide
the means to discriminate incident radiation based on its specific energy loss. It is generally accepted that the population of the long-lived triplet states is the source of the delayed fluorescence and any processes that inhibit (quench) this population will degrade the pulse shape discrimination capability. Many organic scintillators have inherent processes that quench the population of triplet states and therefore do not exhibit the pulse shape discrimination capability. Oxygen dissolved in the scintillator reduces the overall scintillation light and can quench the delayed fluorescence resulting in degraded or destroyed pulse shape discrimination capability.12,14,17 Oxygen degassing in liquid scintillators can be achieved by nitrogen bubbling. -- 10 2NE213 WE213 z 0 U 06 04
~I0
TIME 4lsec)Figure 2.6. Differential and integrated curves showing the time dependence of gamma ray versus neutron response in a xylene based liquid scintillator. The time dependence can be used to differentiate incident radiation based upon its specific energy loss (dE/dx). Images taken from Kuchnir et al.1'
2.3. Scintillation Light from Muons, Neutrons, and Gamma Rays
The final scintillation light from muon, neutron, and gamma ray interactions will vary significantly based upon their energy and the path length in the scintillator including the effects due to the incident angle. In this section, we will describe the expected angular and energy distributions for each type of incident radiation, the types and probabilities of interactions inside the scintillator, and estimate the expected scintillation light. The muon angular and
energy distributions are well documented and originate from cosmic ray interactions in the Earth's atmosphere. The neutron and gamma ray distributions will be based on a simple implosion-type nuclear weapon, which will be compared to an Americium-Beryllium (Am-Be) source, a common industrial neutron source
2.3.1. Muon Source and their Interactions
Terrestrial muons are a result of pion and kaon decay following a primary cosmic ray's interaction in the upper atmosphere. This initial interaction produces many short-lived particles in a hadronic cascade, but the muon's mass, energy, and half-life generally allow it to travel through the remainder of the Earth's atmosphere and penetrate the Earth's surface. Muons passing through the atmosphere at large zenith angles have longer path lengths and are less likely to reach the surface. The final muon distribution at surface has been well characterized and the angular distribution is found to be proportional to the square of the cosine of the zenith angle, P(8) oc cos26.
As shown in Figure 2.7, the muon flux is predominately vertical with fifty percent of muons incident at zenith angles less than 37.50*. This results in a commonly quoted muon flux of 1 muon min- cm-2
at sea level.20
With a mean lifetime of 2.2 ps very few muons would survive the trip through the atmosphere but since muons are produced at relativistic energies they experience a time dilation and some live long enough to penetrate over a thousand meters into the Earth's surface. The mean energy at sea level is approximately 4 GeV and increases with increasing depth. Similar to electrons, muon primary interactions of interest in matter are collisional (Bethe-Bloch) or radiative (Bremsstrahlung).16 The muon, being 200 times heavier than the electron,
generally does not experience the same large angle scattering when interacting with orbital electrons. The specific energy loss remains relatively constant at 2.3 MeV cm2
/g in the 1-10 GeV region.16 With a low and constant specific energy loss, the scintillation light per
distance, dL/dx, will also be constant. For EJ-309 an OLS from Eljen Technology" the muon
scintillation light per unit of distance is:
dL dL dE pons MeV cm2 g hotons
- = E p:~ 11,500 photons
2.3
0.964 - ~ 25,500 dx dE dx MeV g cm3 cm (2.2)1.0
1
-0.5 0.5 -0.5 0.5 -1.0 1.0Figure 2.7. The cosmic ray muon angular distribution is proportional to the square of the cosine of the zenith angle. Each colored section represents 25% of the incident muons. Fifty percent are incident at zenith angles less than 37.5'. The black line is at 45'. Integration over all angles gives a muon flux of-1 min' cm2.
The angular distribution of muons determines the expected path through a horizontal tube, the orientation during all laboratory testing, of a given diameter. A simulation was written to randomly sample the muon angular distribution P(6) oc cos26 and determine if the sampled
muon trajectory crossed the tube. As shown in Figure 2.8, when a muon intersects the tube, the simulation records its path length and then finds the mean path length of all muons passing through the tube. The mean path length is determined to be (86 3)% of the horizontal tube
diameter. Therefore, a 5mm diameter tube filled with EJ-309 will have a mean scintillation light of approximately (11,.000 400) photons.
\
Zj
1--T
-2-2 0
X
Figure 2.8. Estimating the muon path length through a horizontal tube. Based on the muon angular distribution at sea level the simulation randomly chooses a muon path and determines the path length through the tube. The mean path length is determine to be 86 3 % of the diameter.
2.3.2. Neutron Sources and their Interactions
When authorities locate an unknown neutron source, the ability to determine if it is a nuclear yield producing device or not is critical to formulating the proper government response. The most common nuclear yield-producing material that has a prominent neutron signature is plutonium. It is important to recognize that highly enriched uranium (HEU) produces an almost undetectable -2 neutrons s-1 kg- 1.8 At ten meters away, this results in an un-attenuated flux of 1.5 neutrons m-2
min-', significantly below the fluctuating background of 60 neutrons m-2
min-' from cosmic rays. Weapons grade plutonium (WgPu), in contrast, emits 56,000 neutrons s-' kg-1. Fetter et al. describes four hypothetical implosion-type, nuclear weapon designs using either HEU or WgPu as the fissile core, and either tungsten or depleted uranium as the tamper.8 In my analysis, I will use the WgPu core with a depleted uranium tamper model