HAL Id: hal-01469030
https://hal-amu.archives-ouvertes.fr/hal-01469030
Submitted on 16 Feb 2017HAL is a multi-disciplinary open access
archive for the deposit and dissemination of sci-entific research documents, whether they are pub-lished or not. The documents may come from teaching and research institutions in France or abroad, or from public or private research centers.
L’archive ouverte pluridisciplinaire HAL, est destinée au dépôt et à la diffusion de documents scientifiques de niveau recherche, publiés ou non, émanant des établissements d’enseignement et de recherche français ou étrangers, des laboratoires publics ou privés.
to memorize and recognize unfamiliar voices
Virginia Aglieri, Rebecca Watson, Cyril Pernet, Marianne Latinus, Lúcia
Garrido, Pascal Belin
To cite this version:
Virginia Aglieri, Rebecca Watson, Cyril Pernet, Marianne Latinus, Lúcia Garrido, et al.. The Glasgow Voice Memory Test: assessing the ability to memorize and recognize unfamiliar voices. Behavior Research Methods, Psychonomic Society, Inc, 2017, 49 (1), pp.97-110. �10.3758/s13428-015-0689-6�. �hal-01469030�
The Glasgow Voice Memory Test: assessing the ability to memorize and recognize unfamiliar voices
Aglieri Virginia1, Watson Rebecca2,3, Pernet Cyril4, Latinus Marianne 1,5, Garrido Lúcia6, Belin Pascal1,2
1
Institut des Neurosciences de la Timone, UMR 7289, CNRS and Université Aix-Marseille, Marseille, France
2
Centre for Cognitive Neuroimaging, Institute of Neuroscience and Psychology, University of Glasgow, Glasgow, UK
3
Faculty of Psychology and Neuroscience, Maastricht University, Maastricht, Netherlands
4
Centre for Clinical Brain Sciences, The University of Edinburgh, UK
5
Unité Mixte de recherche UMR Inserm U930, Université François-Rabelais de Tours, Tours, France
6
Department of Psychology, Brunel University, London, UK
Abstract
Methods. 1120 subjects as well as a developmental phonagnosic subject (KH) along with age-matched controls performed the Glasgow Voice Memory Test, which assesses the ability
to encode and immediately recognize, through an old/new judgment, both unfamiliar voices (delivered as vowels, making language requirements minimal) and bell sounds. The inclusion
of non-vocal stimuli allows the detection of significant dissociations between the two categories (vocal vs non-vocal stimuli).
Results. The distributions of accuracy and sensitivity scores (d’) reflected a wide range of individual differences in voice recognition performance in the population. As expected, KH
showed a dissociation between the recognition of voices and bell sounds, her performance being significantly poorer than matched controls for voices but not for bells.
Conclusion. By providing normative data of a large sample and by testing a developmental phonagnosic subject, we demonstrated that the Glasgow Voice Memory Test, available online and accessible from all over the world, can be a valid screening tool (~ 5 min) for a preliminary detection of potential cases of phonagnosia and of “super recognizers” for voices.
Introduction
The ability to recognize familiar faces and match two identical facial configurations between them varies from subject to subject, showing a broad spectrum of individual differences in the normal population. At the lowest extreme of this distribution, there are subjects characterized by an impaired performance in recognizing faces, which have been extensively documented in the literature (Avidan et al., 2014; Avidan, Hasson, Malach, & Behrmann, 2005; Avidan & Behrmann, 2009; Behrmann, Avidan, Gao, & Black, 2007). This deficit, referred to as prosopagnosia, or “face-blindness”, can be present at birth (“developmental phonagnosia”) or acquired after lesions occurring in the ventro-temporal cortex (Barton, 2008). At the opposite extreme, there are individuals with extremely good performance in recognizing faces (“super recognizers”) (Russell, Duchaine, & Nakayama, 2009). To test subjects’ performances, a number of standardized tests are nowadays available such as the Cambridge Face Memory Test (CFMT), which targets the ability to recognize the same face from different points of view and under noisy configurations (e.g. Gaussian noise added to the pictures); therefore, this test recruits a stage of processing which does not require any judgment on the familiarity of the stimuli (Duchaine & Nakayama, 2006). Since its validation in a sample of normal and prosopagnosic subjects, the CFMT has allowed the comparison between different research findings in the domain of face recognition and it has been used to assess individual differences in face recognition (L. T. Germine, Duchaine, & Nakayama, 2011; Hedley, Brewer, & Young, 2011).
To date it still remains unclear if the same broad spectrum of performances can be observed in the normal population for the vocal domain. There are evidences that environmental factors contribute to the improvement of the abilities to recognize voices; for instance, an extensive musical training seems to be related to significant higher accuracy in discriminating different voice timbres (Chartrand & Belin, 2006; Chartrand, Peretz, & Belin, 2008). Furthermore, cases of developmental phonagnosia have been recently described, pointing out that in the general population there could be a specific deficit for the recognition of vocal stimuli which does not result from any neurological lesion (Garrido et al., 2009; Herald, Xu, Biederman, Amir, & Shilowich, 2014; Roswandowitz et al., 2014). Developmental phonagnosia can be viewed as the equivalent of developmental prosopagnosia in the vocal domain and its investigation is fundamental to better understand models of person-recognition, particularly in the light of recent findings of multisensory integration of facial and vocal cues in person-recognition processes (von Kriegstein et al., 2008; von Kriegstein, Kleinschmidt, & Giraud, 2006). Similarly to prosopagnosia, acquired phonagnosia can be observed either for familiar voices (D. R. Van Lancker, Kreiman, & Cummings, 1989; D. R. Van Lancker & Canter, 1982) or non-familiar voices (Jones et al, in revision ) in patients with specific lesions of the right parietal vs. right inferior frontal cortices.
Despite these known deficits, there is no agreement on which tests to use to reliably detect and document voice deficits. Indeed, no test validation in phonagnosic and normal subjects has been performed so far. The tests used in previous research on vocal processing were usually created for the purpose of the study and, often, dependent on the language of participants; if on the one hand, language dependency has the advantage to make a test of voice processing more ecological since voice is usually coupled with speech and since familiarity with a language has been found to facilitate voice recognition(Fleming, Giordano,
Caldara, & Belin, 2014), on the other hand, it has the disadvantage to prevent the investigation of those voice perception processes segregated from speech. Furthermore, if the aim of the study is to gather data from many subjects of different ages and cultures, stimuli containing minimal verbal information seem the best choice.
Another methodological issue is that studies investigating acquired phonagnosia in brain-lesioned patients used both discrimination and recognition tasks (Hailstone, Crutch, Vestergaard, Patterson, & Warren, 2010; Neuner & Schweinberger, 2000; Van Lancker, Cummings, Kreiman, & Dobkin, 1988), but there is evidence that these processes could have different neural substrates (D. Van Lancker & Kreiman, 1987), preventing a systematic comparison between them. We here decided to validate a recognition task mostly because it has been previously demonstrated that the performance at the Glasgow Voice Memory Test (GVMT) correlates with degree of activation of temporal voice areas (TVAs) (Watson, Latinus, Bestelmeyer, Crabbe, & Belin, 2012), while it still remains unclear which areas are more involved in discrimination tasks.
Given the need for standardization and reproducibility in the field of voice processing, we here present the GVMT validated in a sample of 1120 subjects gathered online in comparison with the first published case of developmental phonagnosia, KH (Garrido et al., 2009). This brief test (5 minutes) targets perceptual and memory aspects of vocal processing by comparing the performance obtained in encoding both vocal stimuli and bell sounds and immediately judging the stimuli as familiar or unfamiliar. This allows us to evaluate performance level at voice encoding and familiarity recognition, and look at potentially significant dissociations between the vocal and non-vocal domains (Crawford & Garthwaite, 2005). The inclusion of the same task repeated for both voices and bell sounds is in line with the idea behind the development of the Cambridge Car Memory Test (CCMT; Dennett et al., 2012), which requires to learn and recognize cars with the same procedure used in the
Cambridge Face Memory Test. Cars, as bells, are stimuli that allow to investigate the ability to discriminate different examples within an object category. According to the data gathered in a large sample of subjects, the CFMT and the CCMT seem to tap into different processes (Dennett et al., 2012).
The GVMT is currently available online (http://experiments.psy.gla.ac.uk/) and, hence, easily accessible from all over the world. The use of online testing has received particular attention in the last few years, because it allows gathering big samples of data and overcoming the problem of low power due to small samples. It has been previously demonstrated that performance of subjects tested on the Cambridge Memory Face Test in its online version are similar to those of subjects performing the same test in the laboratory, in more controlled conditions (L. Germine et al., 2012). One of the main strengths of GVMT is that of presenting vocal stimuli characterized by minimal verbal information (the vowel /a/), which makes it an optimal tool not only for comparing the performance of subjects of different nationalities, but also to be used (in a not online version) in all kind of neurological patients, including aphasic ones.
By analyzing the data gathered online from a large and heterogeneous sample of subjects, we expected to observe a wide range of individual differences in voice recognition abilities, as has been observed for faces. Furthermore, we hypothesized that the developmental phonagnosic subject KH would show a significant poorer performance compared to matched controls in voice recognition but not in the recognition of bells, demonstrating the validity of the GVMT. Finally, norms are presented in the appendix allowing to compare any new subject to our sample.
Methods
1120 adults aged 18 upwards performed the test online (743 females; M=26.7 years, SD = 11.1, range [18-86]). There were in total 59 different nationalities. In order to take part to the experiment, it was required to first register to the website by giving informed consent. Participants were asked to indicate their age, if they had a twin (in this case, to provide his/her email) and to self-assess their hearing abilities (normal, impaired or presence of hearing deficits such as tinnitus). Only participants that stated to have normal hearing abilities were included in the test. The instructions for the experiment were then displayed (“Your task is to listen to a series of eight voices and try to remember them. This will be followed by another series of voices that will test your memory. For each one of those new voices, you will have to indicate if it belongs to the first series you have been trying to remember. This will be repeated for ringing bells”). A sound test was made available in order to try if the speakers of the device used were correctly operating. Upon completion, participants were given their own score as well as an indication of how well they performed compared to the general population (in percentage). This is the only information that subjects taking the GVMT could obtain, printed on the screen once the test is completed and then always accessible in their reserved area. The study was approved by the local ethics committee, and was run according to the Helsinski guidelines.
Lab validation of the GVMT
In order to demonstrate the validity of the online test, we also compared the results obtained online to those obtained at the same test performed in the controlled environment of the laboratory. Hence, we gathered the results of 63 subjects (26 males; 34 females; M=26.7 years, SD = 6.43, range [18-74]) that performed the GVMT in Glasgow (38 subjects) and in Montreal (25 subjects). These subjects were rewarded for their participation.
KH is a right handed woman aged 62 at the time of testing, who reported to be unable to recognize voices of famous people and of her friends and family. Her case has been fully described in Garrido et al., (2009). She was tested against a control group composed of 6 women matched for age (M=58 years, range [52-68]) and relative level of education. The participation of KH was on a voluntary basis. The participants of the control group were rewarded at the usual rate paid by University of Glasgow (£6 per hour).
Stimuli
A total of 16 voices (8 male) with a mean duration of 487 ms and the recorded sounds of 16 different bells of mean duration of 1110 ms were used. Voice stimuli (only the French vowel /a/) were obtained from recordings performed in Montreal. The native language of all speakers was Canadian French. Recordings (16 bit, 44.1kHz) of the speakers were made in the multi-channel recording studio of Secteur ElectroAcoustique in the Faculté de musique, Université de Montreal, using two Bruel & Kjaer 4006 microphones (Bruel & Kjaer; Nærum, Denmark), a Digidesign 888/24 analog/digital converter and the Pro Tools 6.4 recording software (both Avid Technology; Tewksbury, MA, USA). Bell sounds were obtained from a public internet source containing sounds free from copyright (www.findsounds.com).
Procedure
The test was structured into four phases: 1) encoding of voices; 2) recognition of voices; 3) encoding of bells; 4) recognition of bells.
1) Encoding of voices
Participants initially heard 8 voices (French vowel /a/ for all participants), each of them presented individually as a triplet. The first four voices delivered were of females, while the other four of males. Each voice was presented 3 times in a row, with an interstimulus interval (ISI) between the onsets of the sounds of 1500 ms; different triplets were separated by a 3000
ms silent gap. The presentation order during the encoding phase was the same for all subjects. In this phase, the same set of 8 voices was presented to all participants.
2) Recognition of voices
After the encoding phase ended, participants were asked to start the recognition phase whenever they were ready, while another sound-check was made available. During this phase, participants heard the 8 voices presented during the encoding phase and 8 new ones (4 of females and 4 of males). The set of 8 new voices was the same for all participants. Voices were presented in a random order. Subjects performed an old/new task on the stimuli: they had to decide whether the voice they heard had been presented in the encoding phase (‘old’) or if had not been presented (‘new’). The decision was self-paced. Between participants’ decision and the loading of the next sound there was an interval of 1000 ms.
3) Encoding of bells
During this phase, participants were instructed to listen to 8 different sounds of bells. The presentation procedure was the same as for the vocal stimuli.
4) Recognition of bells
After the encoding phase for bells ended, participants were asked to start the recognition phase. During this phase, participants heard the 8 bells presented during the encoding phase and 8 new ones. The set of 8 new bells was as well the same for all participants. Bells were here presented in a random order. Subjects performed an old/new task on the stimuli: they had to decide whether each voice had been presented in the encoding phase (‘old’) or not (‘new’). The decision was self-paced. Between participant’s decision and the loading of the next sound there was an interval of 1000ms.
Thus, instructions delivered and task demands were highly similar for the voice and the bells part of the GVMT.
For both tasks, we analyzed data in line with detection theory (Macmillan, 2002; Macmillan & Creelman, 2004), measuring hit rates (HR; a voice previously heard was correctly classified as old), false alarms (FA; a voice heard for the first time was classified as old), misses (an old voice considered new) and correct rejections (CR; a voice never heard was classified as new). We calculated the percent correct (PC), which takes into account both hit rates and correct rejections (PC= ( ((HR + 1 - FA) /2) *100 ) , and d’ (d prime), computed instead as the difference between standardized hit rates and false alarms. Hence, percent correct is a measure indicative of both sensitivity (proportion of actual positives correctly identified as such) and specificity (proportion of negatives correctly identified as such), while d’ is used as a measure of participants’ sensitivity to correctly identify a previously heard stimulus as old.
All statistical analyses applied to compare KH’s performance to matched controls followed the guidelines provide in Crawford & Howell (1998). The modified t-test is adapted for comparing one single case to a small group of control subjects. Furthermore, when testing a patient, it is important to show a significant dissociation between the performances obtained in two different tasks, likely tapping into different cognitive and neural processes. To test if KH was impaired in recognition of voices but not of bells, we ran a revised standardized difference test for dissociations (Crawford & Garthwaite, 2005). When needed, robust skipped correlations (Spearman) were computed to protect against the effect of marginal and bivariate outliers, since the data were not normally distributed (Pernet, Wilcox, & Rousselet, 2013). In this method, the acceptance or rejection of the null hypothesis is performed on bootstrap 95 % confidence intervals to protect against heteroscedasticity (e.g. if the CIs do not include 0, the null hypothesis of no correlation can be refused). Some of the analyses were performed on only 598 subjects (422 females; Mean age = 26.29, SD = 10.54). The data from 1120 subjects contained in fact two groups of data; the first group (522 data) were
stored in such a way that we were not anymore able to gather information on which trials corresponded to a male or female voice (since in the recognition phase, the sounds were randomized), as well as on the raw dichotomous variable of choice (old/new); these results were in fact stored directly as percent correct and d’ for the totality of voices, mixed for gender of the voice. At a certain point we changed the way of storing the online results such that the information on specific voices and the raw choice would have been available.
All the analyses were run in MATLAB (MATHWORKS Inc., Natick, MA) using statistical toolbox.
Results
The distributions of the scores of the 1120 subjects calculated as percent correct (PC) and d’ are showed in Fig. 1 (boxplots) & Fig. 2 (histograms). The Jarque-Bera test, which tests the null hypothesis that the data set has skewness and kurtosis matching a normal distribution (hence both these measures being equal to zero) (Gel & Gastwirth, 2008), revealed violation of normality for both percent correct and d’ scores, for both voices and bells (all p<0.001). More specifically, the distributions were all negatively skewed, having most of the scores clustered on the right (higher performance levels); this violation of skewness could indicate a ceiling effect. Referring to kurtosis values (k), the distribution of percent correct for voices was platykurtic (k<0), having a peak lower and broader than expected for normally distributed values, while for bell recognition was leptokurtic (k>0), having a central peak higher and sharper. The distributions for d’ scores for voices and bells were instead both platykurtic.
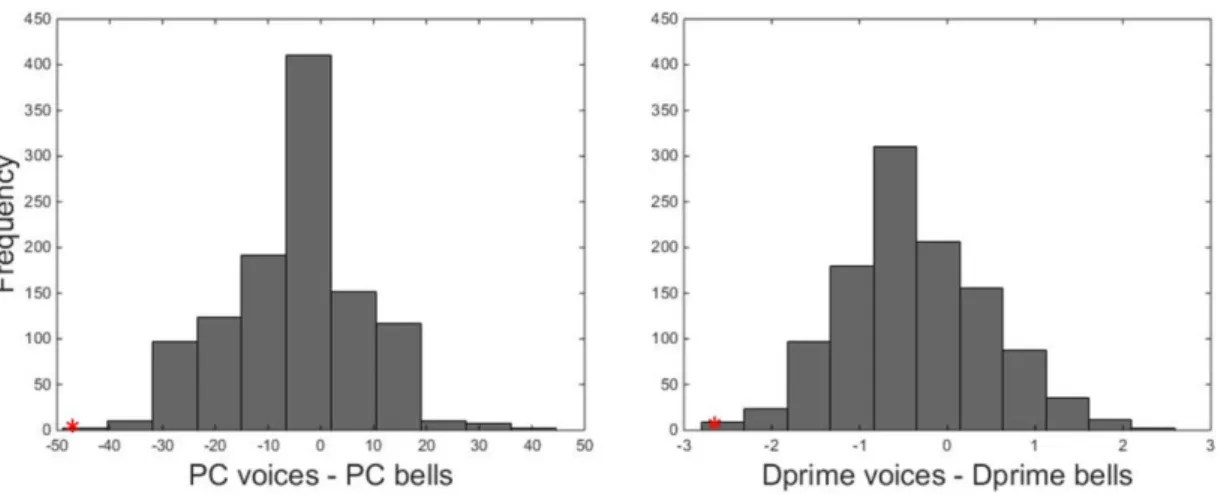
Since it is possible that a bad performance in voice recognition is accompanied by a comparable bad performance in recognition for bells, we also looked at the distribution of the differences between the two performances (voice – bells), which allows to focus on significant dissociations. This distribution (PC for voices – PC for bells; M= -5.24; SD =
12.82; CI (95%) = [-5.99, -4.49] ) was normal (Jarque-Bera test, p = 0.3). The difference between d’ scores for voices and bells (M = - 0.34; SD = 0.8268; CI (95%) = [-0.39, 0.29]) also followed a normal distribution (Jarque-Bera test; p=0.21) (Fig. 3 & 4).
Since both mean differences were negative, we assessed through a Wilcoxon matched-pair test if bells sounds were significantly better recognized than voices. The results show that this was the case for both percent correct (Z = -12.87, p<0.001, effect size: r = 0.27) and d’ (Z = -12.69, p<0.001, effect size: r = 0.28). Nevertheless, there was a significant positive correlation between the performance for voices and bells, both for percent correct scores (skipped Spearman correlation; ρ = 0.2, t = 6.98, CI (95%) = [0.14, 0.26]), and d’ scores (skipped Spearman correlation; ρ = 0.21, t = 7.33, CI (95%) = [0.16, 0.27]) (Fig. 8).
To investigate possible gender effects, we analyzed the data of the first set of 598 subjects. Before doing so, we checked with a t-test assuming unequal variances if there were statistical differences with the bigger sample of 1120 subjects. There were no differences between the performances in bell recognition (t( 1716) = -1,37, p = 0.2) but there was a significant difference between the performances in voice recognition (t (1716)= -3.42, p <0.001), being performance of the 598 subjects lower than the full sample. A mixed-effects repeated measures ANOVA on this smaller sample with scores as dependent measure, gender of the voice as within-subject factor and gender of the listener as between subject one, revealed a main effect of gender of the voice on percent correct scores (PC: F (1,596) =7.21, p=0.007, ηp2 = 0.01; d’: F (1,596) =6.5, p=0.01, ηp2 = 0.01). A post-hoc Wilcoxon signed-rank test revealed that the four female voices presented were better recalled than the four male ones independently of the gender of the listener (PC: Z= 3.81, p < 0.001; d’: 3.64; p <0.001). There was no significant difference between PC scores of male and female listeners (PC: F (1,596) = 0.051, p= 0.822, ηp2 <0.001; d’: F (1,596) = 0.13, p= 0.72, ηp2 = 0), but there was a marginally significant interaction between listeners’ and speakers’ gender (PC: F
(1,596) =4, p = 0.046, ηp2 = 0.006; d’: F (1,596) =3.72, p=0.05, ηp2 = 0.01). A Wilcoxon rank-sum test revealed that women recognized significantly better voices of the same gender (Z=4.02, p<0.001), while male and female voices were equally recognized by men (Z= 0.82, p = 0.41) (see Table 3 & Fig. 7).
No significant correlation was found between PC scores for voices and age of participants (Skipped Spearman correlation; ρ = 4.0132e-04, t = 0.0134, CI (95%) = [-0.07, 0.06] nor between PC scores for bells and age (Skipped Spearman correlation; ρ = 8.0259e-04, t = 0.027, CI (95%) = [-0.06, 0.06]). The same pattern was also observed for d’ scores for voices (Skipped Spearman correlation; ρ = 0.0087, t = 0.29, CI (95%) = [-0.05, 0.07]) and for bells (ρ = -0.014, t = -0.47, CI (95%) = [-0.078, 0.053]). Nevertheless, this result could have been influenced by the fact that most of our participants (81.34 %) were in the age range [18-30] and we only had few old participants (age range [61-86]; 3.4 %). Hence, we report the mean scores for different age ranges to account for possible effects of age, in particular on the mnemonic and attentive components of the task (Table ___).
Appendix 1 provides the detailed distributions of all the measures of interest by percentiles.
Observed
range All (N=1120) Females (N=743) Males (N=377)
Min Max M SD 95 % CI M SD 95 % CI M SD 95 % CI Age 18 86 26.7 11.10 [26, 27.3] 25.89 10.47 [25.13, 26.64] 28.17 12.11 [28.17, 26.94] PC voices (%) 37.5 100 78.15 10.95 [77.5, 78.79] 77.89 10.75 [77.12, 78.67] 78.65 11.33 [77.5, 79.79] D’ voices -0.67 3.07 1.66 0.69 [1.61, 1.7] 1.64 0.68 [1.59, 1.69] 1.69 0.72 [1.61, 1.76] PC bells (%) 43.75 100 83.39 9.97 [82.81, 83.98] 83.85 9.77 [82.45, 83.86] 83.16 10.33 [82.8, 84.9] D’ bells -0.35 3.07 1.99 0.64 [1.95, 2.03] 1.98 0.63 [1.93, 2.02] 2.02 0.66 [1.95, 2.09] PC voices – PC bells -43.75 43.75 -5.24 12.82 [-5.99, - 4.49] -5.26 12.82 [-6.19, -4.34] -5.21 12.85 [-6.51, -3.9] d’ voices – -2.74 2.56 -0.34 0.83 [-0.39 ,0.29] -0.34 0.82 [-0.4, -0.28] -0.33 0.83 [-0.42 ,0.25]
d’ bells
Table 1. Summary statistics of the online sample. Range, means, standard deviations (SD) and 95 %
confidence intervals observed for age and scores obtained in voices and bells recognition and their differences (PC= percent correct; d’=d primes).
18-30 (N = 911) 31-40 (N = 89) 41-50 (N = 51) 51-60 (N = 31) 61-70 (N = 30) 71-86 (N = 8) M SD 95 % CI M SD 95 % CI M SD 95 % CI M SD 95 % M SD 95 % M SD 95 % PC voices (%) 78.57 10.67 [77.88; 79.27] 78.65 10.85 [76.36; 80.94] 76.71 13.29 [72.98; 80.45] 74.39 10.25 [70.63; 78.15] 75 11.72 [70.62; 79.38] 59.37 7.47 [53.13; 65.62] D’ voices 1.68 0.68 [1.64; 1.72] 1.69 0.69 [1.55; 1.83] 1.57 0.84 [1.34; 1.81] 1.43 0.63 [1.20; 1.66] 1.48 0.74 [1.20; 1.76] 0.52 0.39 [0.19; 0.84] PC bells (%) 83.4 9.8 [82.76; 84.03] 83.7 10.39 [81.52;85.9] 84.31 9.38 [81.67; 86.95] 84.27 11.16 [80.18; 88.37] 80.42 11.92 [75.97; 84.87] 81.25 14.94 [68.76; 93.74] D’ bells 1.99 0.63 [1.95; 2.03] 2.02 0.65 [1.88; 2.16] 2.05 0.6 [1.88; 2.22] 2.06 0.72 [1.8; 2.33] 1.8 0.75 [75.97; 84.87] 1.88 0.93 [1.1; 2.67] PC voices –PC bells -4.82 12.55 [-5.64; -4.01] -5.06 13.15 [7.83; -2.28] -7.6 13.36 [-11.36; -3.84] -9.88 12.16 [-14.34; -5.42] -5.42 15.28 [-11.12; 0.29] -21.87 16.02 [-35.27; -8.48] d’ voices – d’ bells -0.31 0.81 [-0.36; -0.26] -0.33 0.84 [0.51; -0.15] -0.48 0.86 [-0.72; -0.24] -0.63 0.8 [-0.92; -0.34] -0.32 0.98 [-0.69; 0.04] -1.37 0.99 [-2.19; -0.54]
Table 2. Summary statistics of the online sample divided in different age ranges.
Female voice Male voice
PC SD d’ SD PC SD d’ SD All subjects (N=598)* 79.28 13.96 1.42 0.65 79.71 14.11 1.29 0.66
Females (N=422) 79.71 13.61 1.44 0.63 75.83 14.31 1.27 0.67
Males (N=176) 78.27 14.76 1.38 0.69 77.70 13.55 1.36 0.63
Table 3. Summary statistics for gender differences in voice recognition. Mean and standard deviations for
percent correct scores obtained in recognition of female and male voices, divided by gender of the listener.*This sample includes only those data from which it was possible to gather information on gender of voice stimuli.
In order to look at phonagnosic subjects as well as potential “super-recognizers” for voices, we looked at outliers in the distributions of the scores obtained for voice recognition. We chose as cut-off score 2 SDs above or beyond the mean, as already done by Roswandowitz et al., (2014). When analyzing percent correct scores, we detected 22 subjects with a performance on voice recognition 2 SDs below the mean (potential phonagnosics) and
no subjects performing 2 SDs above average (as argued before, this could reflect a ceiling effect). If d’ scores are taken into account, the subjects performing 2 SDs below average were as well 22, and this type of measures allowed to detect also 27 “super-recognizers”.
Since it is possible that a bad performance in voice recognition is accompanied by a comparable bad performance in recognition for bells, we also looked at the outliers in the distributions of the difference between the two performances (voice – bell). This distribution allows to reliably analyze standardized scores and to focus on significant dissociations. Subjects with a standardized difference between voice and bell recognition higher than 2 SDs (hence being percent correct for voices > percent correct for bells) were considered as particularly good in voice recognition, while those with a standardized difference in performance between voice and bell recognition lower than -2 SDs (hence being performance for voices < performance for bells) were considered as specifically impaired in voice recognition. Percent correct analysis revealed that, on 1120 subjects, 33 of them had a disproportionately worse performance in recognizing voices than bells and 19 the inverse pattern. According to d’ analysis, there were 20 subjects with significantly worse performance for voices than bells, while 24 that had better performance in voice recognition compared to bell recognition. We propose that potential phonagnosic subjects could have both a significantly bad performance in voice recognition and a dissociation between the performance on the two tasks; hence, these two groups could be intersected. When analyzing percent correct scores, we found 7 subjects with both a performance for voice recognition and a difference between the two performances below 2 SDs, while 3 subjects were detected by looking at d’ scores. PC voices PC voices – PC bells Intersection d’ voices d’ voices – d’ bells Intersection Potential phonagnosics (N/1120) 22 33 7 22 20 3 Potential super-recognizers (N/1120) 0 19 0 27 24 3
Table 4. Outliers detected through GVMT. Summary of the subjects detected as potentially phonagnosics or super-recognizers according, respectively, to the criterion of 2 SDs below or above average. The
intersection column comprehends those subjects that have both a performance for voices and a difference between performances (voices - bells) 2 SDs below or above average.
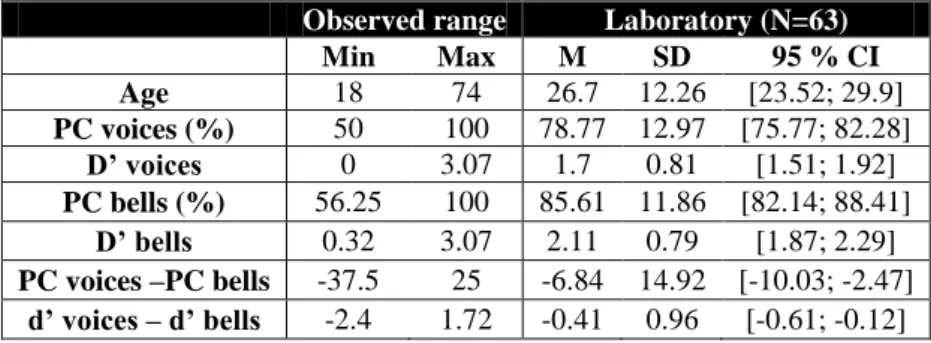
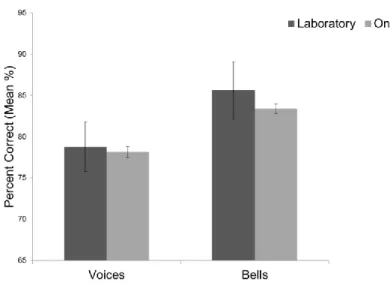
To control for confounds ascribed to the online nature of the test, we compared results of the online sample and the lab one with a t-test assuming unequal variances; the results revealed that there were no significant differences between the performance at voice recognition of subjects that performed the test in the lab and online, nor for percent correct (t (67.02) = 1.46, p =0.15, effect size = 0.17) nor for d’ (t (67.18) = 0.44, p = 0.66, effect size = 0.05). The comparison did not yield significance for bell recognition either (PC: t (67.06) = 0.37, p = 0.71, r = 0.04; d’: t (66.66) = 1.13, p = 0.26, effect size = 0.14).
Observed range Laboratory (N=63)
Min Max M SD 95 % CI Age 18 74 26.7 12.26 [23.52; 29.9] PC voices (%) 50 100 78.77 12.97 [75.77; 82.28] D’ voices 0 3.07 1.7 0.81 [1.51; 1.92] PC bells (%) 56.25 100 85.61 11.86 [82.14; 88.41] D’ bells 0.32 3.07 2.11 0.79 [1.87; 2.29] PC voices –PC bells -37.5 25 -6.84 14.92 [-10.03; -2.47] d’ voices – d’ bells -2.4 1.72 -0.41 0.96 [-0.61; -0.12]
Table 5. Summary statistics of the lab sample. Mean percent correct and d’ obtained by 63 subjects that
performed the test in the laboratory.
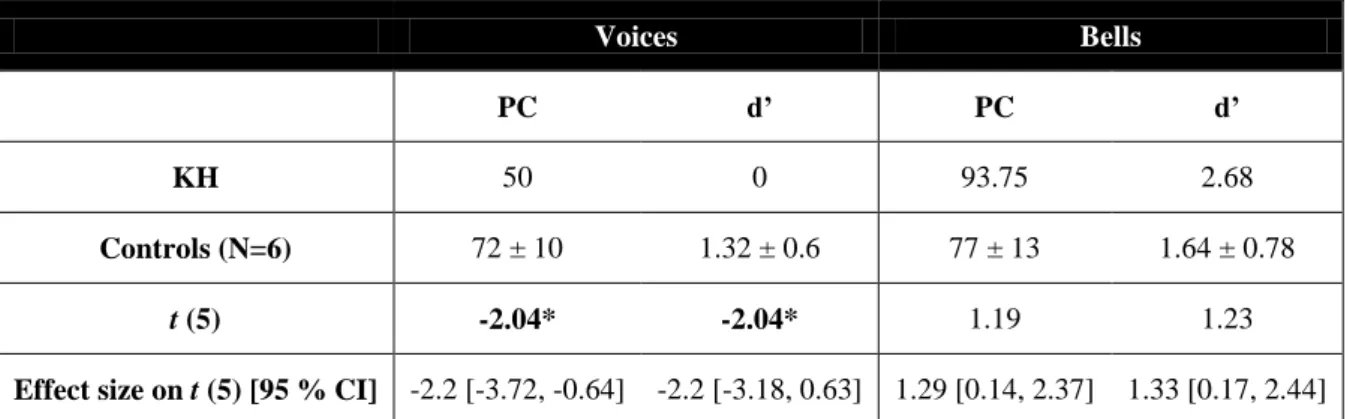
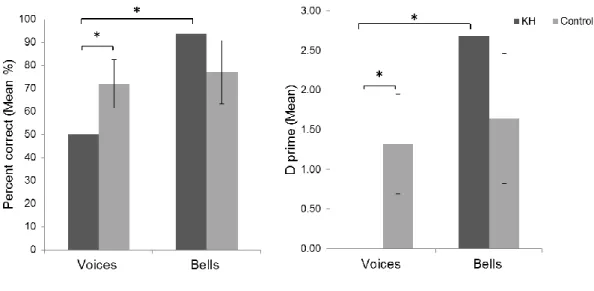
KH’s percent correct scores were significantly lower than those of age-matched controls for voice recognition (t (5) = -2.04; p = 0.049; effect size = -2.2) but not for bell recognition (t (5) = 1.19; p = 0.14; effect size =1.29) (see Table 2), as confirmed by the result of the revised standardized difference test for dissociations (t (5) = 2.85, p = 0.018). D’ for voices was significantly smaller for KH than for controls (t (5) = -2.04, p = 0.049; effect size = -2.2); d’ for bell recognition did not differ between KH and controls (t (5) = 1.23; p = 0.13; effect size = 1.33). The revised standardized difference test for dissociations confirmed a
significant dissociation in KH also for d’ scores (t (5) = 2.71, p = 0.02) (Fig. 6). Since there were no significant differences between results obtained in the lab and online, we compared KH’s scores with the online sample, showing that she was 2 SDs below mean for voice recognition and also for the difference between voice and bell recognition.
Voices Bells
PC d’ PC d’
KH 50 0 93.75 2.68
Controls (N=6) 72 ± 10 1.32 ± 0.6 77 ± 13 1.64 ± 0.78
t (5) -2.04* -2.04* 1.19 1.23
Effect size on t (5) [95 % CI] -2.2 [-3.72, -0.64] -2.2 [-3.18, 0.63] 1.29 [0.14, 2.37] 1.33 [0.17, 2.44]
Table 6. Mean and SDs of percent correct and d’ scores and results of the modified t-test (t (5)) comparing KH’s performance and matched controls. The negative values indicate that KH’s performance
was significantly poorer than for controls. The third row reports the results of the revised t-test for differences between a single case and controls. Values presented in bold are significant (one-tailed, p < 0.05). The effect
size is reported together with its relative confidence interval.
Figure 1. Boxplots representing performance distribution. Percent correct scores (left) and d’ scores (right)
for recognition of voices and bells. Red crosses represent scores corresponding to 2 SDs below or above the average. N=1120.
Figure 2. Histograms representing the distribution of performances. Percent correct scores (top) and d’
scores (bottom) for recognition of voices (left) and bells (right). The red asterisk indicates the performance obtained by the phonagnosic subject KH overlaid on the results of the 1120 subjects of the online test.
Figure 3. Boxplots for the distribution of the differences between performances. Differences between the
two performances (voice recognition – bell recognition) for PC (left) and d’ (right) scores in 1120 subjects. Red crosses represent scores 2 SDs below or above the average.
Figure 4. Distribution of the differences between the two performances (voice recognition – bell recognition) for both PC (left) and d’ (right) scores. Red asterisks indicate KH’s performance overlaid on the
results of the 1120 subjects of the online test.
Figure 5. Bar graphs representing mean PC and d’ scores for recognition of voices and bells, separated by gender of the listener. Error bars represent 95% confidence intervals.
Figure 6. Bar graphs representing PC (left) and d’ scores (right) of KH and matched controls. A
dissociation was observed between the recognition of voices and bell sounds. KH’s performance was significantly poorer than that of controls for recognition of voices but not of bells. Error bars represent 95%
confidence intervals (*p<0.05).
Figure 7. Bar graphs representing PC (left) and d’ (right) scores for voice recognition performances, separated by gender of the speaker and of the listener. Error bars represent 95% confidence intervals
Figure 8. Correlation between performance obtained in voice and bell recognition, for both percent correct (top) ad d primes (bottom). The red square represents KH’s performance overlaid on the results of the
online sample.
Figure 9. Bar graph representing the comparison of the results obtained online and in the laboratory.
When investigating individual differences, it is also advisable to compute measures of inter-rater reliability; this type of measure can in fact inform us on whether the participants classified voices and bells in a consistent way among them. Hence, we analyzed the dichotomous variable of choice (old or new voice/bell) of each participant for each voice (or bell) using a two-way random effects intra-class correlation (ICC) model computed on single items. Since we had access to this dichotomous variable of only one part of our subjects (N = 598), these analysis did not include the entire sample. The partial results point out to a fair agreement among 598 raters in the classification of voices (ICC coefficient = 0.38, CI (95%) = [0.25, 0.6], F (15) =373.89) and a moderate agreement in the classification of bells (ICC coefficient = 0.52, CI (95%) = [0.37, 0.72], F (15) = 645).
Furthermore, testing internal consistency reliability quantifies the interrelatedness of a set of items and it is fundamental for assessing that the different items of a test target the same construct (e.g. different voices all testing the ability to recognize voices). For this purpose, we also checked the internal consistency of the GVMT by looking again at the dichotomous variable of choice (old or new) for both categories of stimuli. The results point out to an optimal internal consistency of both constructs of voice (Cronbach’s alpha = 0.9973) and bell recognition (Cronbach’s alpha = 0.9984). These coefficients have also been computed on a smaller sample of subjects (N = 598).
Discussion
We here summarize the major results gathered in a sample of subjects that performed the GVMT online as well as in a developmental phonagnosic subject (KH) and matched controls.
GVMT: a tool for investigating individual differences in voice processing abilities
The normative data obtained in a sample of 1120 subjects of different ages and cultures highlights a wide range of individual differences in the ability to encode and
immediately recognize unfamiliar voices. Interestingly, the distributions of the differences for both PC and d’ showed that there were cases in which an extremely poor performance in voice recognition was accompanied by an extremely good performance in recognition of bells, meaning that this pattern cannot be ascribed to a general deficit in auditory processes or to difficulties posed by the task. In support of the fact that processes underlying voice are likely to be different from processes of other acoustical stimuli, it has been previously demonstrated that the contrast between vocal and environmental stimuli lead to the activation of specific areas in the temporal lobe and superior temporal sulcus, named the Temporal Voice Areas (TVAs; (Belin, Zatorre, Lafaille, Ahad, & Pike, 2000). Furthermore, the functional activity in the TVAs during passive listening of sounds compared to baseline (vocal + non vocal sounds >baseline) was found to predict the performance for voice recognition obtained in the GVMT (Watson et al., 2012). Hence, future studies should look at the functional activity in these areas while the GMVT is performed in order to associate individual differences in behavior to different patterns of neural activity.
According to the results of the inter-rater reliability analysis, it seems that there is slightly more variability in the way subjects classified the 16 vocal stimuli presented than the 16 environmental ones. There could be two explanations for this tendency: first, voices were always presented first, so subjects’ responses varied more because they were still not familiar with the task; second, the interaction between gender of the listener and of the voice could explain why there was more variability in responses for voices than for bells.
Gender differences
The big sample gathered on-line test also allowed us to reliably investigate gender differences in voice-related processes, even if they could have been affected by the fact that in our online sample, females outnumbered male participants (422 females in 598 subjects). According to our results, and for the specific stimuli we used, the female voices in the GVMT
were in general easier to recognize than male ones. Furthermore, for women it was easier to recognize voices of the same sex, while for males there was not such facilitation. This last result is in contrast a previous study that investigated gender differences; Skuk & Schweinberger (2013) found in fact that males identified more accurately voices of their own gender, while females equally performed for male and female voices. Nevertheless, Skuk & Schweinberger (2013) used voices of personally-known persons in an identification task, while in our study, the voices were heard for the first time and participants were only required to judge them as old or new. Our finding of better recognition of female voices by female listeners parallels instead the finding of women being more accurate in recognizing the emotional inclination of voices of the same sex, while males being worse in judging affective bursts of male voices (Belin, Fillion-Bilodeau, & Gosselin, 2008). Hence, it could mean that gender differences in voice perception are consistent across different stages of the model of voice perception proposed by Belin, Bestelmeyer, Latinus, & Watson, (2011). We did not find an effect of gender of the listener on recognition rates, meaning that men and women equally recognized voices, despite their possible differences in voice-related activation of TVAs (Ahrens, Awwad Shiekh Hasan, Giordano, & Belin, 2014).
GVMT: a reliable and valid screening test for the detection of phonagnosia
Our results suggest that the GVMT has optimal internal consistency reliability, meaning that the different items chosen (e.g. the 16 different voices and the 16 environmental stimuli) consistently test the same construct.
The GVMT seems also to be a valid test for the assessment of voice recognition abilities because KH, the first documented case of developmental phonagnosia (Garrido et al., 2009), presented a dissociation between recognition of voices and bells. She performed significantly worse than matched controls in voice recognition but better in the recognition of bells (even if this difference did not reach significance). Although there are no formal criteria
available to declare a subject as phonagnosic, the extensive assessment performed on KH in 2009 seemed to point out to the presence of a deficit in recognizing and discriminating voices in presence of intact auditory abilities and general sound processing. Garrido et al., (2009) observed in fact that KH was impaired in both recognition of voices of celebrities and discrimination of different vocal stimuli but that she was as good as matched controls in recognizing environmental sounds and in processing musical stimuli. Here, even a simple task such as an old/new judgment on voices and bells heard for the first time lead to similar results.
Since the GVMT seems to specifically detect a deficit in vocal processing, we propose that it could be used as an initial screening tool in finding potential phonagnosic subjects among both the general population (to investigate developmental phonagnosia) and neurological patients (to investigate acquired phonagnosia). According to these normative data, we propose that a cut-off score of 2 SDs below average for voice recognition could be used to define a subject as phonagnosic. If a subject shows a significant deficit in voice recognition, it would then be a good norm to check if the difference between performance in voice and bell recognition is also 2 SDs below the mean, in order to exclude that a poor performance is related to general difficulties in attentive or mnemonic processes. It is advisable, in any case, that a more extensive assessment tapping into higher stages of processing such as identity recognition as the one used by Garrido et al., (2009) and more recently by Roswandowitz et al., (2014) is also carried out to detect a specific impairment in the recognition of voices. To date, we cannot in fact confirm that the GVMT is sensitive to different types of phonagnosia. There seems in fact to exist an apperceptive form of phonagnosia, resulting in an impaired performance in perceptual matching tasks, and an associative phonagnosia, which refers to the inability to associate semantic information to a voice (Roswandowitz et al., 2014). According to the results in Roswandowitz et al., (2014), a
subject with apperceptive phonagnosia could be detected through a discrimination task which requires to perform a judgment of similarity between two voices; at the contrary, a subject with associative phonagnosia could present a spared performance in a discrimination task but would be significantly impaired in a test that requires to provide semantic information associated to the voice of a famous or personally known person. By looking at the performance of KH in the GVMT, it is not clear to which type of phonagnosia KH belongs; the test here presented, in fact, does not specifically assess voice discrimination or recognition. Rather, it tests the ability to activate a sense of familiarity toward a stimulus briefly presented for the first time.
Limitations
One of the criticisms that might be raised to the GVMT is that it taps more into short-term memory abilities than specific abilities to process vocal sounds. It cannot be excluded that there exists a sort of overlap between processes underlying voice and bell recognition, since they were significantly correlated. This moderate correlation could reflect similar cognitive demands in terms of memory (e.g. short-term retention of pitch) and attention, as it has been found in the visual domain, for memory for faces and cars (Dennett et al., 2012). Nevertheless, we observed significant dissociations between recognition of voices and bells such as in KH and in other subjects that performed the test online, meaning that voice and bell recognition are, to some extent, dissociable processes. What we cannot tell is which acoustical aspects contribute more to voice recognition (e.g. timbre of the voice) and to bell recognition instead (e.g. pitch being more characterizing).
According to our results, environmental sounds such as bells seem to be easier to recognize than voices. This finding should be carefully considered since it cannot be excluded that there was an order effect; the test for bells was in fact always presented after the test for voices, when subjects already familiarized with the procedure. Furthermore, we
used for all subjects the same set of voices during the learning phase and the same set of new voices in the recognition phasein order to minimize variability in performance related to the choice of the stimulus set; it is possible that changing the sets of voices and bells in the learning and recognition phase could have led to different results, but a comprehensive comparison of voices and bells perception was not the object of the test; rather, we wanted to provide a pair of tests maximally comparable across subjects.
Another explanation accounting for higher performance for the recognition of bells than voices is that bell sounds were simply characterized by more variability between them (e.g. very different pitch), while vocal sounds were more similar, in particular since the vowel presented was always the same.
Furthermore, the bell stimuli here used lasted longer than vocal ones, and it has been shown that voice recognition improves with increasing duration of vocal samples (Bricker & Pruzansky, 1976; Pollack, Pickett, & Sumby, 1954; Schweinberger, Herholz, & Sommer, 1997). It seems, though, that at the duration of 250 ms, voice recognition performance starts to exceed chance level, both when sentences (Schweinberger et al., 1997) and vowels (Compton, 1963) are used. Since our stimuli lasted in average 487 ms, we believe that they still carry important acoustic features allowing them to be memorized and later recognized. On the other side, it could be argued that these short stimuli that minimize linguistic information are less naturalistic than sentences. The choice of these stimuli was mainly guided by the need to make the test equally valid in many countries and by the fact that it is harder to control for linguistic abilities in an online test; we do not claim that the best way to test voice recognition is using minimal verbal information. Nevertheless, segregating voice from language can help to understand which aspects of voice recognition abilities are different from processes underlying speech comprehension. It seems in fact that the mechanisms underlying speaker recognition and speech comprehension are partly
dissociable, meaning that voice could still maintain its salient features even when not bringing speech (Lang, Kneidl, Hielscher-Fastabend, & Heckmann, 2009).
Another limitation of our study (and, in general, of online testing) is that we discarded the analysis of reaction times because they could be affected by different speeds of internet connections and operating systems and by the fact that subjects are not controlled by the experimenter; hence, we do not have any information on possible differences in processing time of the two types of stimuli, which would instead be useful to compute measures of speed/accuracy trade off, as previously done in prosopagnosic subjects (Busigny, Joubert, Felician, Ceccaldi, & Rossion, 2010). Furthermore, we could not control for the time occurred between the encoding and recognition phases; even if it is more likely that, being the test particularly short, participants completed it without taking long breaks, it cannot be excluded that this interval considerably varies among subjects. Nevertheless, the results of the comparison between data obtained in the laboratory and online suggest that this factor of confounding do not affect subjects’ performances.
Despite these limitations, a web-based experiment such as the one here presented can have a great potential in identifying cases of phonagnosia in the general population as it allows for the gathering of large samples of data, overcoming issues related to small sample sizes.
Acknowledgements
This work was supported by grants BB/E003958/1from BBSRC, large grant RES-060-25-0010 by ESRC/MRC, and grant AJE201214 by the Fondation pour la Recherche Medicale.
VA is supported by a PhD fellowship from the A*MIDEX foundation. We are grateful to Guylaine Bélizaire, Maude Urfer, Cyril Pernet and Marc Becirspahic for their contribution to
References
Ahrens, M.-M., Awwad Shiekh Hasan, B., Giordano, B. L., & Belin, P. (2014). Gender differences in the temporal voice areas. Auditory Cognitive Neuroscience, 8, 228.
http://doi.org/10.3389/fnins.2014.00228
Avidan, G., & Behrmann, M. (2009). Functional MRI Reveals Compromised Neural Integrity of the Face Processing Network in Congenital Prosopagnosia. Current Biology, 19(13), 1146–1150. http://doi.org/10.1016/j.cub.2009.04.060
Avidan, G., Hasson, U., Malach, R., & Behrmann, M. (2005). Detailed Exploration of Face-related Processing in Congenital Prosopagnosia: 2. Functional Neuroimaging Findings. Journal of Cognitive Neuroscience, 17(7), 1150–1167. http://doi.org/10.1162/0898929054475145 Avidan, G., Tanzer, M., Hadj-Bouziane, F., Liu, N., Ungerleider, L. G., & Behrmann, M. (2014).
Selective dissociation between core and extended regions of the face processing network in congenital prosopagnosia. Cerebral Cortex, 24(6), 1565–1578.
Barton, J. J. (2008). Structure and function in acquired prosopagnosia: lessons from a series of 10 patients with brain damage. Journal of Neuropsychology, 2(1), 197–225.
Behrmann, M., Avidan, G., Gao, F., & Black, S. (2007). Structural Imaging Reveals Anatomical Alterations in Inferotemporal Cortex in Congenital Prosopagnosia. Cerebral Cortex, 17(10), 2354–2363. http://doi.org/10.1093/cercor/bhl144
Belin, P., Zatorre, R. J., Lafaille, P., Ahad, P., & Pike, B. (2000). Voice-selective areas in human auditory cortex. Nature, 403(6767), 309–312.
Bricker, P. D., & Pruzansky, S. (1976). Speaker recognition. Contemporary Issues in Experimental Phonetics, 295–326.
Busigny, T., Joubert, S., Felician, O., Ceccaldi, M., & Rossion, B. (2010). Holistic perception of the individual face is specific and necessary: Evidence from an extensive case study of acquired prosopagnosia. Neuropsychologia, 48(14), 4057–4092.
Chartrand, J.-P., & Belin, P. (2006). Superior voice timbre processing in musicians. Neuroscience Letters, 405(3), 164–167. http://doi.org/10.1016/j.neulet.2006.06.053
Chartrand, J.-P., Peretz, I., & Belin, P. (2008). Auditory recognition expertise and domain specificity. Brain Research, 1220, 191–198.
Crawford, J. R., & Garthwaite, P. H. (2005). Testing for suspected impairments and dissociations in single-case studies in neuropsychology: evaluation of alternatives using monte carlo simulations and revised tests for dissociations. Neuropsychology, 19(3), 318.
Crawford, J. R., & Howell, D. C. (1998). Comparing an individual’s test score against norms derived from small samples. The Clinical Neuropsychologist, 12(4), 482–486.
Dennett, H. W., McKone, E., Tavashmi, R., Hall, A., Pidcock, M., Edwards, M., & Duchaine, B. (2012). The Cambridge Car Memory Test: A task matched in format to the Cambridge Face Memory Test, with norms, reliability, sex differences, dissociations from face memory, and expertise effects. Behavior Research Methods, 44(2), 587–605.
Duchaine, B., & Nakayama, K. (2006). The Cambridge Face Memory Test: Results for neurologically intact individuals and an investigation of its validity using inverted face stimuli and
prosopagnosic participants. Neuropsychologia, 44(4), 576–585.
Fleming, D., Giordano, B. L., Caldara, R., & Belin, P. (2014). A language-familiarity effect for speaker discrimination without comprehension. Proceedings of the National Academy of Sciences, 111(38), 13795–13798. http://doi.org/10.1073/pnas.1401383111
Garrido, L., Eisner, F., McGettigan, C., Stewart, L., Sauter, D., Hanley, J. R., … Duchaine, B. (2009). Developmental phonagnosia: a selective deficit of vocal identity recognition.
Neuropsychologia, 47(1), 123–131.
Gel, Y. R., & Gastwirth, J. L. (2008). A robust modification of the Jarque–Bera test of normality. Economics Letters, 99(1), 30–32.
Germine, L., Nakayama, K., Duchaine, B. C., Chabris, C. F., Chatterjee, G., & Wilmer, J. B. (2012). Is the Web as good as the lab? Comparable performance from Web and lab in
cognitive/perceptual experiments. Psychonomic Bulletin & Review, 19(5), 847–857.
Germine, L. T., Duchaine, B., & Nakayama, K. (2011). Where cognitive development and aging meet: Face learning ability peaks after age 30. Cognition, 118(2), 201–210.
Hailstone, J. C., Crutch, S. J., Vestergaard, M. D., Patterson, R. D., & Warren, J. D. (2010). Progressive associative phonagnosia: a neuropsychological analysis. Neuropsychologia, 48(4), 1104– 1114.
Hedley, D., Brewer, N., & Young, R. (2011). Face recognition performance of individuals with Asperger syndrome on the Cambridge Face Memory Test. Autism Research, 4(6), 449–455. Herald, S. B., Xu, X., Biederman, I., Amir, O., & Shilowich, B. E. (2014). Phonagnosia: A voice
homologue to prosopagnosia. Visual Cognition, (ahead-of-print), 1–3.
Kriegstein, K. von, Dogan, Ö., Grüter, M., Giraud, A.-L., Kell, C. A., Grüter, T., … Kiebel, S. J. (2008). Simulation of talking faces in the human brain improves auditory speech recognition. Proceedings of the National Academy of Sciences, 105(18), 6747–6752.
http://doi.org/10.1073/pnas.0710826105
Lancker, D. R. V., Kreiman, J., & Cummings, J. (1989). Voice perception deficits: Neuroanatomical correlates of phonagnosia. Journal of Clinical and Experimental Neuropsychology, 11(5), 665–674.
Lang, C. J., Kneidl, O., Hielscher-Fastabend, M., & Heckmann, J. G. (2009). Voice recognition in aphasic and non-aphasic stroke patients. Journal of Neurology, 256(8), 1303–1306. Macmillan, N. A. (2002). Signal detection theory. Stevens’ Handbook of Experimental Psychology.
Retrieved from http://onlinelibrary.wiley.com/doi/10.1002/0471214426.pas0402/full Macmillan, N. A., & Creelman, C. D. (2004). Detection theory: A user’s guide. Psychology press.
http://books.google.it/books?hl=it&lr=&id=P094AgAAQBAJ&oi=fnd&pg=PP1&dq=macmillan +creeman+&ots=bcqc6xRbeX&sig=_4Td9nzZ6_4Q22ZoVs6L91M3MRg
Neuner, F., & Schweinberger, S. R. (2000). Neuropsychological impairments in the recognition of faces, voices, and personal names. Brain and Cognition, 44(3), 342–366.
Pernet, C. R., Wilcox, R. R., & Rousselet, G. A. (2013). Robust correlation analyses: false positive and power validation using a new open source Matlab toolbox. Quantitative Psychology and Measurement, 3, 606. http://doi.org/10.3389/fpsyg.2012.00606
Pollack, I., Pickett, J. M., & Sumby, W. H. (1954). On the identification of speakers by voice. The Journal of the Acoustical Society of America, 26(3), 403–406.
Roswandowitz, C., Mathias, S. R., Hintz, F., Kreitewolf, J., Schelinski, S., & von Kriegstein, K. (2014). Two Cases of Selective Developmental Voice-Recognition Impairments. Current Biology. Retrieved from http://www.sciencedirect.com/science/article/pii/S0960982214010616 Russell, R., Duchaine, B., & Nakayama, K. (2009). Super-recognizers: People with extraordinary face
recognition ability. Psychonomic Bulletin & Review, 16(2), 252–257.
Schweinberger, S. R., Herholz, A., & Sommer, W. (1997). Recognizing Famous VoicesInfluence of Stimulus Duration and Different Types of Retrieval Cues. Journal of Speech, Language, and Hearing Research, 40(2), 453–463.
Skuk, V. G., & Schweinberger, S. R. (2013). Gender differences in familiar voice identification. Hearing Research, 296, 131–140.
Van Lancker, D., & Kreiman, J. (1987). Voice discrimination and recognition are separate abilities. Neuropsychologia, 25(5), 829–834.
Van Lancker, D. R., & Canter, G. J. (1982). Impairment of voice and face recognition in patients with hemispheric damage. Brain and Cognition, 1(2), 185–195.
Van Lancker, D. R., Cummings, J. L., Kreiman, J., & Dobkin, B. H. (1988). Phonagnosia: A Dissociation Between Familiar and Unfamiliar Voices. Cortex, 24(2), 195–209.
von Kriegstein, K., Kleinschmidt, A., & Giraud, A.-L. (2006). Voice recognition and cross-modal responses to familiar speakers’ voices in prosopagnosia. Cerebral Cortex, 16(9), 1314–1322. Watson, R., Latinus, M., Bestelmeyer, P. E., Crabbe, F., & Belin, P. (2012). Sound-induced activity in
voice-sensitive cortex predicts voice memory ability. Frontiers in Psychology, 3. Retrieved from http://www.ncbi.nlm.nih.gov/pmc/articles/PMC3317263/
Appendix I
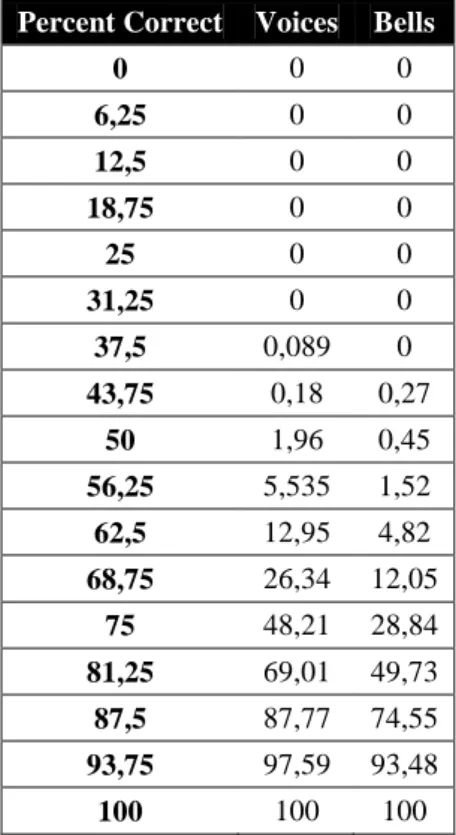
Percent Correct Voices Bells
0 0 0 6,25 0 0 12,5 0 0 18,75 0 0 25 0 0 31,25 0 0 37,5 0,089 0 43,75 0,18 0,27 50 1,96 0,45 56,25 5,535 1,52 62,5 12,95 4,82 68,75 26,34 12,05 75 48,21 28,84 81,25 69,01 49,73 87,5 87,77 74,55 93,75 97,59 93,48 100 100 100
Table 1. Quantiles for PC for voice and bell recognition. The first column reports possible scores divided in
17 intervals, while the other two the percentage of subjects that obtained the corresponding equal or lower score in voice and bell recognition (N subjects with = or < score / 1120).
d’ Score Voices Bells
0 1.96 0.45 0.38 5.09 1.43 0.57 5.53 1.52 0.77 12.05 4.2 0.96 12.95 4.82 1.15 25.45 11.78 1.34 26.34 12.05 1.73 48.21 28.84 2.11 69.02 49.73 2.30 87.77 74.55 2.49 87.77 74.55
2.68 97.59 93.48
2.88 97.59 93.48
3.07 100 100
Table 2. Quantiles for d’ for voice and bell recognition. The first column reports possible scores divided in
14 intervals, while the other two the percentage of subjects that obtained the corresponding equal or lower score in voice and bell recognition.
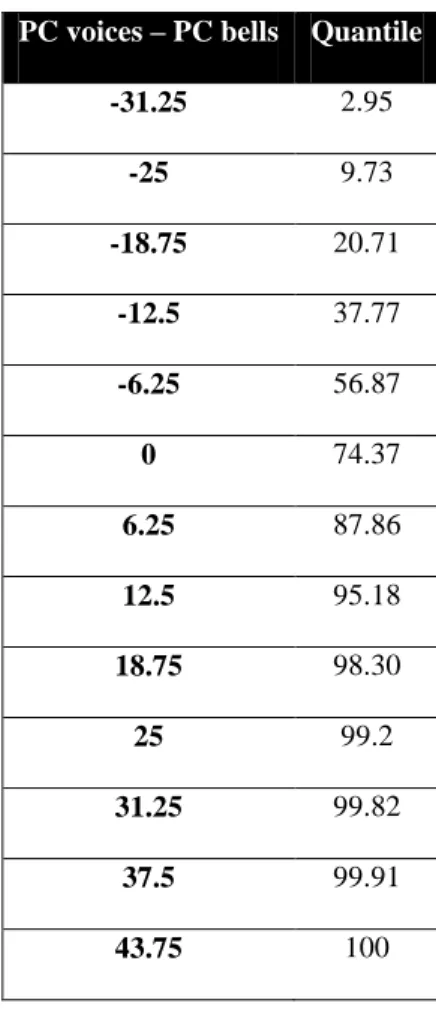
PC voices – PC bells Quantile
-31.25 2.95 -25 9.73 -18.75 20.71 -12.5 37.77 -6.25 56.87 0 74.37 6.25 87.86 12.5 95.18 18.75 98.30 25 99.2 31.25 99.82 37.5 99.91 43.75 100
Table 3. Quantiles for PC differences between voices and bells. The first column reports possible scores
divided in 13 intervals, while the other the percentage of subjects that obtained the corresponding equal or lower score.
D’ voices – d’ bells Quantile -2.08 1.07 -1.75 2.95 -1.42 9.37 -1.09 19.46 -0.76 34.64 -0.43 45.62 -0.1 58.03 0.23 74.46 0.56 87.86 0.89 94.2 1.22 96.96 1.55 98.48 1.88 99.37 2.21 99.91 2.87 100
Table 4. Quantiles for d’ differences between voices and bells. The first column reports possible scores
divided in 15 intervals, while the other the percentage of subjects that obtained the corresponding equal or lower score.