HAL Id: inserm-00530157
https://www.hal.inserm.fr/inserm-00530157
Submitted on 15 Sep 2011HAL is a multi-disciplinary open access archive for the deposit and dissemination of sci-entific research documents, whether they are pub-lished or not. The documents may come from teaching and research institutions in France or abroad, or from public or private research centers.
L’archive ouverte pluridisciplinaire HAL, est destinée au dépôt et à la diffusion de documents scientifiques de niveau recherche, publiés ou non, émanant des établissements d’enseignement et de recherche français ou étrangers, des laboratoires publics ou privés.
High alcohol consumption in middle-aged adults is
associated with poorer cognitive performance only in
the low socio-economic group. Results from the GAZEL
cohort study.
Séverine Sabia, Alice Guéguen, Claudine Berr, Lisa Berkman, Joël Ankri,
Marcel Goldberg, Marie Zins, Archana Singh-Manoux
To cite this version:
Séverine Sabia, Alice Guéguen, Claudine Berr, Lisa Berkman, Joël Ankri, et al.. High alcohol con-sumption in middle-aged adults is associated with poorer cognitive performance only in the low socio-economic group. Results from the GAZEL cohort study.. Addiction/British Journal of Addictions, 2011, 106 (1), pp.93-101. �10.1111/j.1360-0443.2010.03106.x�. �inserm-00530157�
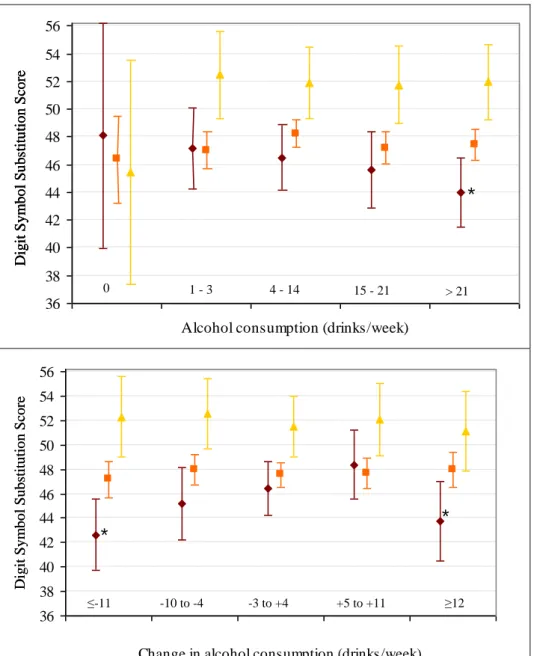
Figure S1. Analyses restricted to participants without depressive symptoms (CESD<16;
N=2992)
††
Adjusted for age, screening centre, marital status, and smoking history.
B. Non-depressed participants (CESD<16)36 38 40 42 44 46 48 50 52 54 56
Alcohol consumption (drinks/week)
D ig it -S y m b o l S u st it u ti o n S c o re 0 30 1 - 3 4 - 14 15 - 21 > 21 32 34 36 38 40 42 44 46 48 50 52 54
Alcohol consumption 10 years before cognitive exam (drinks/week)
D ig it-S y m b o l S u sti tu ti o n S c o r e Lower SEP (N=439) Intermediate SEP (N=1940) Higher SEP (N=613) D ig it Sy m b o l S u b st it u ti o n Sco re
*
B. Non-depressed participants (CESD<16)36 38 40 42 44 46 48 50 52 54 56
Alcohol consumption (drinks/week)
D ig it -S y m b o l S u st it u ti o n S c o re 0 30 1 - 3 4 - 14 15 - 21 > 21 32 34 36 38 40 42 44 46 48 50 52 54
Alcohol consumption 10 years before cognitive exam (drinks/week)
D ig it-S y m b o l S u sti tu ti o n S c o r e Lower SEP (N=439) Intermediate SEP (N=1940) Higher SEP (N=613) D ig it Sy m b o l S u b st it u ti o n Sco re
B. Non-depressed participants (CESD<16)
36 38 40 42 44 46 48 50 52 54 56
Alcohol consumption (drinks/week)
D ig it -S y m b o l S u st it u ti o n S c o re 0 30 1 - 3 4 - 14 15 - 21 > 21 32 34 36 38 40 42 44 46 48 50 52 54
Alcohol consumption 10 years before cognitive exam (drinks/week)
D ig it-S y m b o l S u sti tu ti o n S c o r e Lower SEP (N=439) Intermediate SEP (N=1940) Higher SEP (N=613) D ig it Sy m b o l S u b st it u ti o n Sco re
*
B. Non-depressed participants (CESD<16)
36 38 40 42 44 46 48 50 52 54 56
Change in alcohol consumption (drinks/week)
D ig it -S y m b o l S u st it u ti o n S c o re 30 32 34 36 38 40 42 44 46 48 50 52 54
Alcohol consumption 10 years before cognitive exam (drinks/week)
D ig it-S y m b o l S u sti tu ti o n S c o r e Lower SEP (N=439) Intermediate SEP (N=1940) Higher SEP (N=613) D ig it Sy m b o l S u b st it u ti o n Sco re ≤-11 -10 to -4 -3 to +4 +5 to +11 ≥12
*
*
Legend
30 32 34 36 38 40 42 44 46 48 50 52 54Alcohol consumption 10 years before cognitive exam (drinks/week)
D ig it-S y m b o l S u sti tu ti o n S c o r e Low (N=439) Intermediate (N=1940) Higher SEP (N=613)
Figure S2. Mean Digit-Symbol Substitution Test score
†and 95% Confidence Interval as a
function of categories of average alcohol consumption in different SEP groups estimated
using weighed regression.
††
Adjusted for age, screening centre, marital status, and smoking history.
36 38 40 42 44 46 48 50 52 54 56
Alcohol consumption (drinks/week)
D ig it -S y m b o l S u st it u ti o n S c o re 0 1 - 3 4 - 14 15 - 21 > 21 D ig it Sy m b o l S u b st it u ti o n Sco re
*
*
Legend
30 32 34 36 38 40 42 44 46 48 50 52 54Alcohol consumption 10 years before cognitive exam (drinks/week)
D ig it-S y m b o l S u sti tu ti o n S c o r e Low (N=684) Intermediate (N=2607) High (N=782) 32 34 36 38 40 42 44 46 48 50 52
Alcohol consumption (drinks/week)
D ig it -S y m b o l S u st it u ti o n S c o re 0 1 - 3 4 - 14 15 - 21 > 21 D ig it Sy m b o l S u b st it u ti o n Sco re
*
*
Legend
30 32 34 36 38 40 42 44 46 48 50 52 54Alcohol consumption 10 years before cognitive exam (drinks/week)
D ig it-S y m b o l S u sti tu ti o n S c o r e Low (N=171) Intermediate (N=2723) High (N=1179)
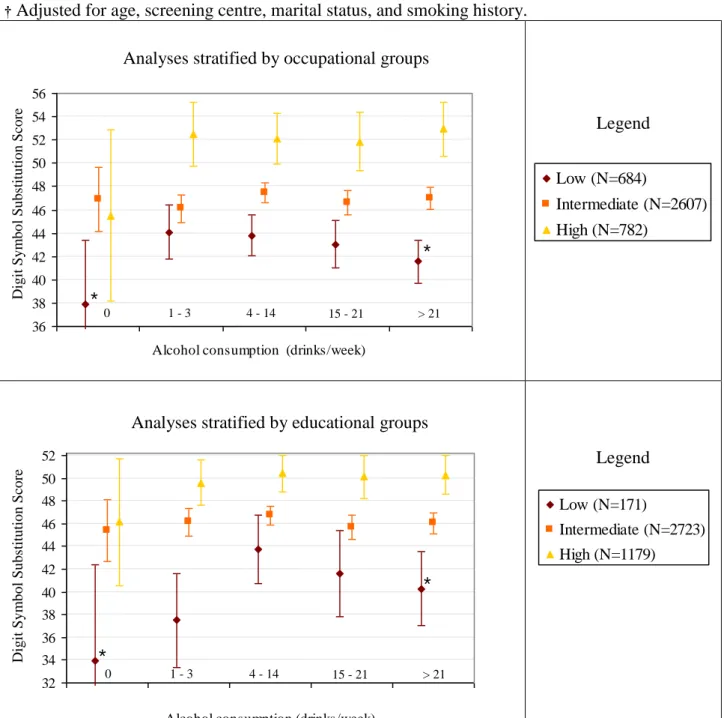
Analyses stratified by occupational groups
Figure S3. Mean Digit-Symbol Substitution Test score
†and 95% Confidence Interval as a
function of categories of trajectories of alcohol consumption in different SEP groups
estimated using weighed regression.
††
Adjusted for age, screening centre, marital status, and smoking history.
36 38 40 42 44 46 48 50 52 54 56
Change in alcohol consumption (drinks/week)
D ig it -S y m b o l S u st it u ti o n S c o re D ig it Sy m b o l S u b st it u ti o n Sco re ≤-11 -10 to -4 -3 to +4 +5 to +11 ≥12 * *
Legend
30 32 34 36 38 40 42 44 46 48 50 52 54Alcohol consumption 10 years before cognitive exam (drinks/week)
D ig it-S y m b o l S u sti tu ti o n S c o r e Low (N=684) Intermediate (N=2607) High (N=782) 34 36 38 40 42 44 46 48 50 52 54
Change in alcohol consumption (drinks/week)
D ig it -S y m b o l S u st it u ti o n S c o re D ig it Sy m b o l S u b st it u ti o n Sco re ≤-11 -10 to -4 -3 to +4 +5 to +11 ≥12
Legend
30 32 34 36 38 40 42 44 46 48 50 52 54Alcohol consumption 10 years before cognitive exam (drinks/week)
D ig it-S y m b o l S u sti tu ti o n S c o r e Low (N=171) Intermediate (N=2723) High (N=1179)