HAL Id: hal-01975294
https://hal.sorbonne-universite.fr/hal-01975294
Submitted on 29 Aug 2019
HAL is a multi-disciplinary open access
archive for the deposit and dissemination of
sci-entific research documents, whether they are
pub-lished or not. The documents may come from
teaching and research institutions in France or
abroad, or from public or private research centers.
L’archive ouverte pluridisciplinaire HAL, est
destinée au dépôt et à la diffusion de documents
scientifiques de niveau recherche, publiés ou non,
émanant des établissements d’enseignement et de
recherche français ou étrangers, des laboratoires
publics ou privés.
A metabolic function of FGFR3-TACC3 gene fusions in
cancer
Véronique Frattini, Stefano Pagnotta, Dr Tala, Jerry Fan, Marco Russo, Sang
Lee, Luciano Garofano, Jing Zhang, Peiguo Shi, Genevieve Lewis, et al.
To cite this version:
Véronique Frattini, Stefano Pagnotta, Dr Tala, Jerry Fan, Marco Russo, et al.. A metabolic function
of FGFR3-TACC3 gene fusions in cancer. Nature, Nature Publishing Group, 2018, 553 (7687),
pp.222-227. �10.1038/nature25171�. �hal-01975294�
A metabolic function of FGFR3-TACC3 gene fusions
in cancer
Véronique Frattini1*, Stefano M. Pagnotta1,2*, Tala1, jerry j. Fan3,4, Marco V. Russo1, Sang Bae Lee1, Luciano Garofano1,2,5,
jing Zhang1, Peiguo Shi1, Genevieve Lewis1, Heloise Sanson1, Vanessa Frederick1, Angelica M. Castano1, Luigi Cerulo2,5,
Delphine C. M. Rolland6, Raghvendra Mall7, Karima Mokhtari8,9,10, Kojo S. j. Elenitoba-johnson6, Marc Sanson8,10,11,
Xi Huang3,4, Michele Ceccarelli2,5, Anna Lasorella1,12,13§ & Antonio Iavarone1,12,14§
Chromosomal translocations that generate in-frame oncogenic gene fusions are notable examples of the success of targeted cancer therapies1–3. We have previously described gene fusions of
FGFR3-TACC3 (F3–T3) in 3% of human glioblastoma cases4. Subsequent studies have reported similar frequencies of F3–T3 in many other cancers, indicating that F3–T3 is a commonly occuring fusion across all tumour types5,6. F3–T3 fusions are potent oncogenes that confer sensitivity to FGFR inhibitors, but the downstream oncogenic signalling pathways remain unknown2,4–6. Here we show that human tumours with F3–T3 fusions cluster within transcriptional subgroups that are characterized by the activation of mitochondrial functions. F3–T3 activates oxidative phosphorylation and mitochondrial biogenesis and induces sensitivity to inhibitors of oxidative metabolism. Phosphorylation of the phosphopeptide PIN4 is an intermediate step in the signalling pathway of the activation of mitochondrial metabolism. The F3–T3–PIN4 axis triggers the biogenesis of peroxisomes and the synthesis of new proteins. The anabolic response converges on the PGC1α coactivator through the production of intracellular reactive oxygen species, which enables mitochondrial respiration and tumour growth. These data illustrate the oncogenic circuit engaged by F3–T3 and show that F3–T3-positive tumours rely on mitochondrial respiration, highlighting this pathway as a therapeutic opportunity for the treatment of tumours with F3–T3 fusions. We also provide insights into the genetic alterations that initiate the chain of metabolic responses that drive mitochondrial metabolism in cancer.
To investigate the transcriptional changes elicited by F3–T3, we expressed F3–T3 in immortalized human astrocytes and compared gene expression profiles of cells treated with a specific inhibitor against FGFR tyrosine kinase (TK, PD173074) or vehicle. Human astrocytes expressing F3–T3 were also compared to human astrocytes that expressed kinase-dead F3–T3 (F3–T3(K508M)) or were transduced with an empty vector (Extended Data Fig. 1a). Hierarchical clustering based on genes that were differentially expressed between F3–T3 human astrocytes and PD173074-treated F3–T3 cells showed that F3–T3 human astrocytes differed from the other three groups (Fig. 1a and Extended Data Fig. 1b). Analysis of a Gene Ontology enrichment map showed that, in addition to the expected enrichment for mitotic activity4, oxidative phosphorylation and mitochondrial biogenesis were
the most significant categories to be enriched in F3–T3 human astro-cytes for each of the three independent comparisons (Fig. 1b, Extended
Data Fig. 1c and Supplementary Table 1). We confirmed the expression changes of mitochondrial genes by quantitative PCR with reverse tran-scription (RT–qPCR) (Extended Data Fig. 1d).
Compared to human astrocytes expressing the empty vector or F3–T3(K508M), F3–T3 human astrocytes exhibited increased levels of mitochondrial DNA, mitochondrial mass (MitoTracker Red) and produced higher levels of ATP (Fig. 1c, d and Extended Data Fig. 1e). F3–T3 increased respiratory complex proteins (SDHB, UQCRC1 and ATP5A1) and the mitochondrial membrane transporter VDAC1 (Extended Data Fig. 1f). We also found higher levels of VDAC1 and NDUFS4 in tumours generated from mouse glioma stem cells (mGSCs) expressing human F3–T3 and small hairpin RNA (shRNA) against
Trp53 (shTrp53) (hereafter F3–T3;shTrp53) than in tumours formed
by mGSCs expressing oncogenic HRAS(12V) and shTrp53 (hereafter HRAS(12V);shTrp53)4,7 (Extended Data Fig. 1g). Introduction of F3–T3
in human astrocytes, RPE and U251 cells increased the basal and maximal oxygen consumption rate (OCR) of these cells compared to cells transduced with F3–T3(K508M) or empty vector and this effect was reversed by FGFR-TK inhibition with AZD4547 in cells expressing exogenous F3–T3 and human glioblastoma (GBM)-derived GSC1123 cells with endogenous F3–T34 (Fig. 1e and Extended Data Fig. 2a–d).
F3–T3 elicited only a mild increase in the extracellular acidification rate (ECAR), leading to an increase in the OCR:ECAR ratio (Extended Data Fig. 2e, f). After treatment with the inhibitor of ATP synthase oligomycin, F3–T3 human astrocytes displayed reduced ATP levels and cell growth (by more than 70%) but were resistant to the substi-tution of glucose with galactose in the culture medium, a condition that imposes oxidative metabolism and markedly affected cell growth of human astrocytes treated with vector (Extended Data Fig. 2g, h). A 72-h treatment with the mitochondrial inhibitors metformin, mena-dione or tigecycline impaired growth of GSC1123 cells but was inef-fective in GSC308 F3–T3-negative gliomaspheres4 (Fig. 1f). Similarly,
mitochondrial inhibitors reduced the viability of F3–T3;shTrp53 mGSCs but did not affect HRAS(12V);shTrp53 mGSCs (Fig. 1g and Extended Data Fig. 2i–k). However, tigecycline decreased COX1 and COX2, two respiratory complex subunits translated by mitochondrial ribosomes8, and mitochondrial inhibitors reduced ATP production,
indicating that these compounds were similarly active in both cell types (Extended Data Fig. 2l, m). We also found that treatment with tigecycline (50 mg kg−1) suppressed tumour growth of F3–T3;shTrp53
mGSCs glioma xenografts with a more than 50% reduction in tumour 1Institute for Cancer Genetics, Columbia University Medical Center, New York, New York 10032, USA. 2Department of Science and Technology, Universita’ degli Studi del Sannio, Benevento
82100, Italy. 3The Arthur and Sonia Labatt Brain Tumour Research Centre, Program in Developmental and Stem Cell Biology, The Hospital for Sick Children, Toronto, Ontario M5G 1A4, Canada. 4Department of Molecular Genetics, University of Toronto, Toronto, Ontario M5S 1A8, Canada. 5BIOGEM Istituto di Ricerche Genetiche ‘G. Salvatore’, Campo Reale, 83031 Ariano Irpino, Italy. 6Department of Pathology and Laboratory Medicine, Perelman School of Medicine at University of Pennsylvania, Philadelphia, Pennsylvania 19104-6100, USA. 7Qatar Computing Research
Institute (QCRI), Hamad Bin Khalifa University, Doha, Qatar. 8Sorbonne Universités UPMC Univ Paris 06, UMR S 1127, Inserm U 1127, CNRS UMR 7225, ICM, Paris 75013, France. 9AP-HP, Groupe
Hospitalier Pitié Salpêtrière, Laboratoire de Neuropathologie R Escourolle, Paris 75013, France. 10Onconeurotek, AP-HP, Paris 75013, France. 11AP-HP, Hôpital de la Pitié-Salpêtrière, Service de
Neurologie 2, Paris 75013, France. 12Department of Pathology and Cell Biology, Columbia University Medical Center, New York, New York 10032, USA. 13Department of Pediatrics, Columbia
University Medical Center, New York, New York 10032, USA. 14Department of Neurology, Columbia University Medical Center, New York, New York 10032, USA.
*These authors contributed equally to this work. §These authors jointly supervised this work.
volume after six days, the last day on which all controls were alive. At the end of the experiment (day 11), three of the eight mice in the control group had been euthanized, whereas all mice receiving tigecycline were alive (n = 10; Fig. 1h and Extended Data Fig. 2n).
To identify F3–T3 substrates that drive oxidative metabolism, we performed anti-phosphorylated tyrosine (phospho-tyrosine) immu-noprecipitation of tryptic digests of total cellular proteins from human astrocytes expressing F3–T3, F3–T3(K508M) or the empty vector, fol-lowed by identification of phosphopeptides by liquid chromatography– tandem mass spectrometry (Supplementary Table 2). As expected, F3–T3 showed the largest changes in phospho-tyrosine; Y647 in FGFR3 and Y684 in TACC3 showed the highest and second highest enrichment in phosphorylation, respectively. After the enrichment seen in F3–T3, the next most enriched phospho-tyrosine was Y122 of PIN4 (hereafter PIN4(Y122)), a poorly studied homologue of the cancer-driver PIN1 peptidyl-prolyl-trans-isomerase9–11 (Supplementary Table 2). This
residue (Y122) is conserved in PIN4 across evolution and we found that F3–T3 interacts with endogenous PIN4 (Extended Data Fig. 3a, b). Analysis of anti-phosphotyrosine immunoprecipitations revealed that only cells expressing active F3–T3 contained tyrosine- phosphorylated PIN4, PKM2, DLG3, C1orf50 and GOLGIN84, whereas tyrosine- phosphorylated HGS was also present in FGFR3-expressing cells (Fig. 2a and Extended Data Fig. 3c, d). Treatment of GSC1123 cells with AZD4547 removed constitutive tyrosine phosphorylation of F3–T3, PIN4, PKM2, GOLGIN84 and C1orf50, whereas phospho-ERK, phospho-Stat3 and phospho-AKT were not changed (Extended Data Fig. 3e, f). We confirmed F3–T3-specific tyrosine phosphorylation of exogenous wild-type PIN4, PKM2, GOLGIN84, DLG3 and C1orf50, but phosphorylation of the corresponding un-phosphorylatable tyrosine to alanine or phenylalanine phospho-mutants was greatly reduced (Extended Data Fig. 3g). We generated and validated a
phosphorylation-specific antibody against phosphorylated PIN4(Y122) (phospho-PIN4(Y122)). The antibody detected PIN4 in cells expressing F3–T3, but not in cells transduced with vector, FGFR3 or F3–T3(K508M) (Extended Data Fig. 3h, i). Phospho-PIN4(Y122) was readily detected in F3–T3;shTrp53 mGSCs and xenografts but was absent in HRAS(12V);shTrp53 mGSCs and corresponding tumours (Extended Data Fig. 4a, b). Immunostaining of phospho-PIN4(Y122) in primary human GBM revealed that tumours with F3–T3 (n = 14) expressed much higher levels of phospho-PIN4(Y122) than tumours lacking F3–T3 fusions (n = 35, 15 of which expressed EGFR–SEPT14, a different receptor tyrosine kinase gene fusion that signals through phospho-STAT312; Fig. 2b and Extended Data Fig. 4c).
Next, we expressed wild-type and the corresponding phospho- tyrosine mutants of PIN4, PKM2, DLG3, C1orf50 and GOLGIN84 in F3–T3 human astrocytes and measured oxidative metabolism. Expression of wild-type and tyrosine to alanine or phenylalanine mutants of PKM2, DLG3, C1orf50 and GOLGIN84 failed to affect the increased OCR profile of F3–T3 human astrocytes (Extended Data Fig. 4d–g). Conversely, PIN4(Y122F) but not wild-type PIN4 (PIN4(WT)) reverted basal and maximum OCR levels of F3–T3 human astrocytes to the levels of vector-expressing human astrocytes (Fig. 2c and Extended Data Fig. 4h). We observed similar effects in F3–T3 human astrocytes in which endogenous PIN4 had been silenced and replaced by the un-phosphorylatable PIN4(Y122F) phospho- mutant (Fig. 2d and Extended Data Fig. 4i). Expression of PIN4(Y122F) and PIN4(Y122A) phospho-mutants reversed the F3–T3-mediated increase in ATP (Extended Data Fig. 4j). Expression of PIN4(Y122F) also impaired soft agar clonogenicity (Fig. 2e).
To identify the gene expression signature associated with F3–T3 in human tumours, we benchmarked different statistical methods for the analysis of imbalanced datasets using synthetic data and the
c a Mitochondrial envelope Mitochondrial part Mitochondrial membrane Mitochondrial inner membrane Envelope Mitochondrion Organelle inner membrane Hallmark oxidative phosphorylation Organelle envelope b d e g ** * ** **** ** ** ** Days Tu m our volu me (fold change) 0 4 8 12 16 20 24 28 3 1 5 7 9 11 Vehicle Tigecycline (50 mg kg–1) 88 8 88 8 66 6 5 5 Vector DMSO F3–T3 DMSO F3–T3 AZD4547 F3–T3 K508M DMSO OCR (p mo l mi n –1 per 10 4 ce lls) g y 0 20 40 60 80 Time (min) 0 20 40 60 80 100 120 140 P < 0.001 P < 0.001 0 100 200 300 400 500 AT P (AU ×1 0 3) per 10 4 cell s Vector F3–T3 F3–T3(K508M) *** *** Vector F3–T3 F3–T3(K508M) m
tDNA (fold change)
** ** 0 0.5 1.0 1.5 2.0 2.5 3.0 f GSC1123 GSC308 *** *** *** Survival rati o Vehicle Metformin 1 mM Tigecycline 10 μM Menadione 5 μM * NS NS 0 0.3 0.6 0.9 1.2 1.5 Survival rati o F3–T3 HRAS(12V) *** *** NS NS Vehicle Tigecycline 4 μM Tigecycline 8 μM 0 0.2 0.4 0.6 0.8 1 1.2 F3–T3 PD173074 F3–T3(K508M) 4 2 0 –2 –4 F3–T3 Vector Oligomycin FCCP Rotenone h
Figure 1 | Activation of mitochondrial biogenesis and metabolism by F3–T3. a, Hierarchical clustering of differentially expressed genes (DEGs) between F3–T3 human astrocytes, F3–T3 human astrocytes treated with PD173074 (n = 5 biologically independent samples per group). Human astrocytes expressing the empty vector and F3–T3(K508M) (n = 3 biologically independent samples per group) are included as controls.
t-test P < 0.01 and MWW test P < 0.01. b, Enrichment map network
of statistically significant GO categories (Q < 10−6 in F3–T3 human
astrocytes versus F3–T3 human astrocytes treated with PD173074 and human astrocytes expressing F3–T3(K508M) or vector). Nodes represent GO terms and lines their connectivity. Node size is proportional to the significance of enrichment and line thickness indicates the fraction of genes shared between groups. c, qPCR of mitochondrial DNA (mtDNA)
in human astrocytes expressing F3–T3, F3–T3(K508M) or vector. d, Quantification of cellular ATP in human astrocytes as in c. e, OCR of F3–T3 human astrocytes treated with or without AZD4547. f, Survival ratio of GSC1123 and GSC308 cells following treatment with the indicated mitochondrial inhibitors. g, Survival ratio of F3–T3;shTrp53 and HRAS(12V);shTrp53 mGSCs treated with vehicle or tigecycline. h, Tumour volume in mice treated with vehicle (n = 8) or tigecycline (n = 10). Data are fold change ± s.e.m. of controls. The number of mice remaining in the study at each time point is indicated. Data are representative of two (f, g) or three (e) independent experiments. Data are fold change ± s.d. (c) or mean ± s.d. (d–g) of n = 3 technical replicates (e–g) or n = 6 (c) and n = 12 replicates (d) from two independent experiments. *P ≤ 0.05, **P ≤ 0.01, ***P ≤ 0.001, two-tailed t-test with unequal variance.
GBM transcriptome from The Cancer Genome Atlas (TCGA)13. The
combination of the easy ensemble (ee) undersampling technique and Mann–Whitney–Wilcoxon (MWW) test statistics (ee-MWW) exhibi-ted the best performance for correct identification of imbalanced samples and reproducible clustering (Supplementary Information and Supplementary Table 3). We used ee-MWW to generate a ranked list of genes discriminating F3–T3-positive samples in the GBM data-set of the TCGA and built a hierarchical cluster (confirmed by con-sensus clustering), including a small cluster of nine F3–T3-positive samples and nine fusion-like GBM (Fig. 3a, Extended Data Fig. 5a and Supplementary Table 4). The most significant biological processes enriched in F3–T3-positive GBM were mitochondrial categories (Fig. 3b and Extended Data Fig. 5b). Mitochondrial functions were also increased in fusion-like GBM, which were enriched for amplification and high expression of mitochondrial RNA polymerase (POLRMT, Extended Data Fig. 5c–e). Immunostaining of oxidative phospho-rylation biomarkers in an independent GBM cohort revealed that F3–T3-positive tumours expressed higher levels of mitochondrial proteins (Fig. 3c and Extended Data Fig. 5f). The ee-MWW method clustered tumours with other rare oncogenes (oncogenic RAS in GBM and invasive breast carcinoma, EGFR-SEPT14 gene fusion in GBM12)
and identified their associated biological functions (Extended Data Fig. 5g–i and Supplementary Table 5). Using ee-MWW, we detected small and homogeneous clusters of F3–T3-positive tumours enriched for mitochondrial categories in each tumour containing recurrent F3–T3 fusions in the TCGA dataset (pan-glioma, lung squamous cell carcinoma, head and neck squamous cell carcinoma, oesophageal carcinoma, urothelial bladder carcinoma and cervical squamous cell carcinoma and endocervical adenocarcinoma; Extended Data Fig. 6a–k
and Supplementary Table 6). The transcriptional similarity of F3–T3-positive glioma was confirmed by Topological Data Analysis14,15
(Extended Data Fig. 6l). Finally, expression of the F3–T3 fusion gene correlated with mitochondrial activities in the analysis of multiple cancer types (Extended Data Fig. 6m).
To identify the transcription factors that are causally related to the gene expression signature that is activated in F3–T3-positive glioma (master regulators)16, we assembled transcriptional networks from the
GBM and pan-glioma datasets using the regularized gradient boosting machine algorithm that was developed for the inference of gene regula-tory networks17. In both datasets, the two most active master regulators
of F3–T3-positive tumours were PPARGC1A and ESRRG (encoding the PGC1α transcriptional coactivator and the nuclear receptor ERRγ, respectively; Fig. 3d, Extended Data Fig. 6n and Supplementary Table 7). Expression of PPARGC1A and ESRRG mRNA was higher in F3–T3-positive than F3–T3-negative GBM (Extended Data Fig. 6o). Because PGC1α is a coactivator of the oestrogen-related receptor (ERR) subfamily of nuclear receptors and acts as a master regulator of mitochondrial biogenesis and metabolism18,19, we investigated whether
PGC1α and ERRγ enable the mitochondrial functions induced by F3–T3. Introduction of F3–T3 in human astrocytes expressing PIN4(WT) increased PPARGC1A mRNA and PGC1α protein and the expression of genes involved in reactive oxygen species (ROS) detoxification20 (Extended Data Fig. 7a–d and Supplementary
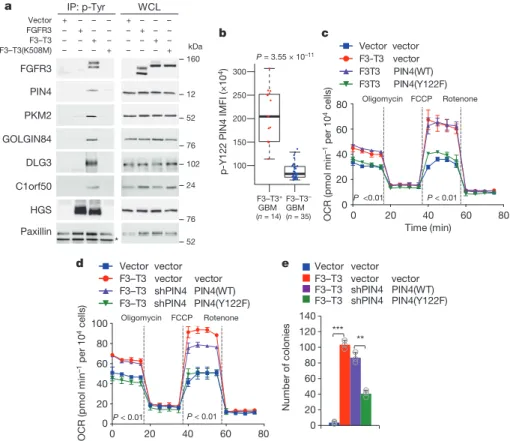
Table 7). Accordingly, PGC1α accumulated at higher levels in F3–T3-positive GSC1123 cells and F3–T3;shTrp53 mGSCs compared to F3–T3-negative GSC308 cells and HRAS(12V);shTrp53 mGSCs, respectively (Fig. 3e). However, replacement of PIN4 with the un- phosphorylatable Y122F mutant PIN4(Y122F) blunted C1orf50 PKM2 PIN4 GOLGIN84 Paxillin FGFR3 HGS DLG3 IP: p-Tyr WCL Vector FGFR3 F3–T3 F3–T3(K508M) * 52 160 + – – – – + – – – – + – – – – + + – – – – + – – – – + – – – – + 12 76 102 24 52 76 b F3–T3+ GBM F3–T3 – GBM p-Y 122 PIN4 IMFI (×10 4) 100 200 250 300 150 P = 3.55 × 10⁻¹¹ (n = 14) (n = 35) a d e c Vector vector F3–T3 vector vector F3–T3 shPIN4 PIN4(WT) F3–T3 shPIN4 PIN4(Y122F) OCR (p mo l mi n –1 per 10 4 cells) 0 20 40 60 80 Time (min) 0 20 40 60 80 100 P < 0.01 P < 0.01 Oligomycin FCCP Rotenone Vector vector F3-T3 vector F3T3 PIN4(WT) F3T3 PIN4(Y122F) OCR (pm ol mi n –1 per 10 4 cells) 0 20 40 60 80 Time (min) 0 20 40 60 80 P <0.01 P < 0.01 Oligomycin FCCP Rotenone Vector vector F3–T3 vector vector F3–T3 shPIN4 PIN4(WT) F3–T3 shPIN4 PIN4(Y122F) *** ** Num ber of co lonies 0 20 40 60 80 100 120 140 kDa
Figure 2 | Phosphorylation of PIN4 at Y122 affects mitochondrial metabolism. a, Immunoblot of phosphotyrosine immunoprecipitates from SF126 glioma cells (left) or whole-cell lysate (WCL, right). Paxillin is a loading control. IP, immunoprecipitation. b, Quantification of phospho-PIN4(Y122) integrated mean fluorescence intensity (IMFI) from F3–T3-positive and F3–T3-negative GBM. Box plot spans the first to third quartiles and whiskers show the 1.5× interquartile range.
P ≤ 0.0001, two-sided MWW test. c, OCR of F3–T3 human astrocytes
transduced with PIN4(WT), PIN4(Y122F) or vector. d, OCR of F3–T3 human astrocytes following silencing of PIN4 and reconstitution with PIN4(WT) or PIN4(Y122F). e, Soft agar colony-forming assay of human astrocytes treated as in d. Data in c–e are mean ± s.d. of one representative experiment with n = 3 technical replicates. Experiments were repeated three times with similar results. **P ≤ 0.01, ***P ≤ 0.001, two-tailed t-test with unequal variance.
F3–T3-mediated induction of PGC1α (Extended Data Fig. 7a, c). The inhibition of mitochondrial metabolism and reduction in soft agar clonogenicity by PIN4(Y122F) in F3–T3 human astrocytes were both rescued by overexpression of PGC1α(WT). Conversely, PGC1α(L2L3A), which contains mutations in the nuclear receptor boxes L2 and L3 that are critical for binding ERRγ18 could not rescue
F3–T3-mediated activation of mitochondrial metabolism in F3–T3 human astrocytes expressing PIN4(Y122F) (Fig. 3f and Extended
Data Fig. 7e, f). Finally, loss of PGC1α by shRNA and CRISPR–Cas9 gene editing reversed the activation of mitochondrial respiration by F3–T3 and depletion of ERRγ produced similar effects (Fig. 3g, h and Extended Data Fig. 7g–m). PGC1α silencing inhibited soft agar colony formation by F3–T3 human astrocytes and impaired self- renewal of GSC1123 cells (Extended Data Fig. 7n–p). Silencing of either PPARGC1A or ESRRG prevented tumour xenograft forma-tion of F3–T3 human astrocytes in mice (Fig. 3i and Extended Data
Vector F3–T3
F3–T3-shPIN4 PIN4(WT) F3–T3-shPIN4 PIN4(Y122F) F3–T3-shPIN4 PIN4(Y122F) PGC1α(WT) F3–T3-shPIN4 PIN4(Y122F) PGC1α(L2L3A) Oligomycin FCCP Rotenone 0 20 40 60 80 100 120 OCR (pm ol mi n –1 per 10 4 cells) Time (min) 20 40 60 80 0 P < 0.01 P < 0.01 0 50 100 150 200 250
OCR (pmol min
–1 per 10 4 cells) 20 40 60 80 0 Vector vector F3T3 vector F3T3 shPPARGC1A-1 F3T3 shPPARGC1A-2 Oligomycin FCCP Rotenone P < 0.001 P < 0.001 20 0 40 60 80
OCR (pmol min
–1 per 10 4 cells) Oligomycin FCCP Rotenone Vector vector F3–T3 vector F3–T3 shESRRG-2 F3–T3 shESRRG-1 Time (min) Time (min) 20 40 60 80 0 P < 0.001 P < 0.001 Mitochondrial envelope Organelle inner membrane Mitochondrial part Mitochondrial matrix Oxidative phosphorylation and metabolism Cellular respiration Electron transport chain Mitochondrial membrane part c a b 3 2 0 –2 –3 d e 0 200 400 600 800 1,000 1,200 1,400 (n = 13) (n = 34) P = 1.7 × 10⁻⁸ GBM GBM VDAC1 IMFI (×10 4) g f COX IV IMFI (×10 4) 100 300 500 700 (n = 14) (n = 35) P = 0.015 600 400 200 i h Tu m our volu me (1 0 6 μ m 3) 10 8 6 4 2 0 ****** ****** Repo-Gal4>eGFP-F3–T3 Repo-Gal4>eGFP-F3–T3 RNAi-KK100201 Repo-Gal4>eGFP-F3–T3 RNAi-GL01019 Repo-Gal4>eGFP-F3–T3 RNAi-HMS00857 Repo-Gal4>eGFP-F3–T3 RNAi-HMS00858 Repo-Gal4 eGFP-F3–T3 Repo-Gal4 eGFP-F3–T3 RNAi-KK100201 Repo-Gal4 eGFP-F3–T3 RNAi-HMS00857 Repo-Gal4 eGFP-F3–T3 RNAi-GL01019 Repo-Gal4 eGFP-F3–T3 RNAi-HMS00858 100 μm j PGC1 α GSC1123 GSC308 F3–T 3 RAS(12V) PGC1α α-Tubulin FGFR3 RAS(12V)–Flag 52 24 160 102 Vector mGSC hGSC k 0 7 14 21 28 *** *** Tumour volume (mm 3) Time (days) Control (n = 4) shPPARGC1A (n = 5) shESRRG (n = 5) *** *** P value
Samples ranked by MR activity
Mean activity MR 100 200 0 300 400 500 PPARGC1A PPP1R13B ESRRG NR2E1 NR3C2 ZIC2 ARHGEF12 DBX2 TBX3 STON1 ZHX3 ISG20 IFI16 IRF1 GBP1 0.8799 0.6415 0.6790 0.5476 0.7428 0.5647 0.6477 0.5847 0.5565 –0.6404 0.5349 –0.5211 –0.5187 –0.5593 –0.5585 2.69 × 10⁻⁶ 1.28 × 10⁻⁴ 5.67 × 10⁻⁶ 1.79 × 10⁻⁴ 1.17 × 10⁻⁵ 4.79 × 10⁻⁵ 5.72 × 10⁻⁵ 7.74 × 10⁻⁵ 3.06 × 10⁻⁴ 2.50 × 10⁻⁶ 5.63 × 10⁻⁴ 1.62 × 10⁻³ 1.59 × 10⁻³ 5.11 × 10⁻⁴ 4.98 × 10⁻⁴ 0 100 200 300 400 (n = 13) (n = 34) P = 1.5 × 10⁻⁵ NDUFS4 IMFI (×10 4) F3–T3+ F3–T3– GBM GBM F3–T3+ F3–T3– GBM GBM F3–T3+ F3–T3– kDa 0 600 1,200 1,800 2,400
Figure 3 | PGC1α and ERRγ are required for F3–T3-mediated mitochondrial metabolism and tumorigenesis. a, Hierarchical clustering of GBM (n = 534) and normal brain (n = 10) from the TCGA using DEGs in nine F3–T3-positive samples (red) versus the F3-T3-negative samples. b, Enrichment map network of statistically significant GO categories in nine F3–T3-positive samples (upper-tailed MWW-GST Q < 0.001, normalized enrichment score (NES) > 0.6). Nodes represent GO terms and lines their connectivity. Node size is proportional to number of genes in the GO category and line thickness indicates the fraction of genes shared between groups. c, Quantification of IMFI of VDAC1, NDUFS4 and COXIV in F3–T3-positive and F3–T3-negative GBM. Box plot spans the first to third quartiles and whiskers show the 1.5× interquartile range. P ≤ 0.0001 (VDAC and NDUFS4); P ≤ 0.05 (COXIV), two-sided MWW test. d, Master regulator (MR) activity in GBM. Grey curves represent the activity of each master regulator. Red or blue lines indicate individual F3-T3-positive GBM displaying high or low master regulator activity, respectively (n = 534). P value, two-sided MWW test for differential activity (left) and mean of the activity (right) of the master regulator in F3–T3-positive versus F3–T3-negative samples are indicated.
e, Immunoblot of PGC1α, in human (h) and mouse (m)GSCs. Human astrocytes transduced with PGC1α or vector are controls. f, OCR of F3–T3 human astrocytes following silencing of PIN4 and reconstitution with PIN4(WT) or PIN4(Y122F), in the presence or the absence of PGC1α(WT) or PGC1α(L2L3A). g, OCR of F3–T3 human astrocytes transduced with PPARGC1A shRNA. h, OCR of F3–T3 human astrocytes transduced with shESRRG. i, Tumour growth of F3–T3 human astrocytes transduced with vector (n = 4), PPARGC1A shRNA1 (n = 5) or ESRRG shRNA1 (n = 5). Tumour growth curves of individual mice are shown. j, Representative images of whole brain–ventral nerve cord complex optical projections from repo-Gal4>F3–T3 and repo-Gal4>F3–T3 with
srl RNAi Drosophila larvae. k, Quantification of tumour volume of repo-Gal4>F3–T3 and repo-repo-Gal4>F3–T3 with srl RNAi Drosophila larvae.
f–h, Data (mean ± s.d.) are from two experiments (f, n = 3 and n = 5 technical replicates, respectively, per experiment) or one (g, h, n = 4 technical replicates) experiment. k, Data are mean ± s.e.m. (n = 6–17 larvae) of one experiment. Experiments were repeated two to three times with similar results. **P ≤ 0.01, ***P ≤ 0.001, two-tailed t-test with unequal variance (f–k).
Fig. 7q) and impaired in vivo tumour growth of F3–T3;shTrp53 mGSCs but not HRAS(12V)shTrp53 mGSCs (Extended Data Fig. 7r–v). Next, we developed a brain tumour model in Drosophila by ectopi-cally expressing human F3–T3 using the glial-specific driver repo-Gal4 (ref. 21). repo-Gal4–F3–T3 transgenic flies manifested glial neoplasia with enlargement and malformation of the larval brain lobe and ventral nerve cord, leading to larval lethality (Extended Data Fig. 8a, b). Cell number and proliferation of glial cells were enhanced in repo-Gal4– F3–T3 flies (Extended Data Fig. 8c, d). Cell-autonomous RNA inter-ference (RNAi)-mediated knockdown of spargel (srl, the Drosophila
orthologue of PPARGC1A)22 in repo-Gal4–F3–T3 flies reduced
glial tumour volume and decreased the number of Repo+ glial cells,
without affecting repo-Gal4-driven F3–T3 protein expression in F3–T3-expressing flies or normal brain development in wild-type animals without F3–T3 (Fig. 3j, k and Extended Data Figs 8e–g, 9a–d).
srl knockdown did not rescue Repo-Gal4–F3–T3 animals to adult
viability, confirming that suppressors of glial neoplasia in Drosophila are infrequent rescuers of organismic lethality23 (Extended Data Fig. 9e).
srl knockdown in a Drosophila model of glioma driven by constitutively
active EGFR (dEGFRλ) and PI3K (Dp110CAAX) in the glial lineage24
resulted in minor to no effects on tumour volume, thus highlighting the specific sensitivity of F3–T3 tumorigenesis to the perturbation of
srl expression (Extended Data Fig. 9f, g). RNAi-mediated knockdown
of the Drosophila oestrogen-related receptor (ERR) also reduced F3–T3 glial tumour volume (Extended Data Fig. 9h, i).
To determine the mechanism by which phospho-PIN4(Y122) mediates F3–T3 signalling, we studied the subcellular compartmen-talization of PIN4 and phospho-PIN4(Y122) and sought to uncover the set of cellular proteins interacting with PIN4. Unphosphorylated PIN4 was diffusely localized in the cytoplasm and nuclear membrane whereas phospho-PIN4(Y122) was concentrated in larger cytoplasmic vesicle-like structures that co-localized with F3–T3 (Extended Data
a b c
f
d
e
PEX1DAPI PEX1DAPI
10 μm Vector F3–T3 g h i j k F3-T3 Vector p-PIN4PMP70DAPI p-PIN4 PMP70 p-PIN4 PMP70 10 μm p-PIN4PMP70DAPI 10 μm 10 μm PPARGC1A (f ol dc hang e) Vector F3–T3 F3–T3 NAC *** *** NS PEX1 IMFI(×10 4) 0 2 4 6 8 *** Vector F3–T3 n = 34 n = 29 Vector F3–T3 Num ber of peroxisom es per cell *** *** Day 4 Day 8 1,750 0 1,500 1,250 1,000 750 500 250 n = 13 n = 13 n = 13 n = 13 Nu mb er of peroxisom es per cell 0 Vector F3–T3 shPIN4 PIN4(WT) F3–T3 shPIN4 PIN4(Y122F) *** NS 200 400 600 800 1,000 n =19 n = 19 n = 19 *** Vector F3–T3 F3–T3 CHX Day 4 Day 8
OPP (MFI per ce
ll) *** *** NS *** *** NS 0 100 200 300 400 500 Vector F3–T3 F3–T3(K508M)
CellROX (MFI per cell
) * ** NS 30 40 50 60 70 80 90 100
CellROX (MFI per cell
) Vector F3–T3 F3–T3 NAC Day 4 Day 8 *** *** NS ** *** NS 0 30 60 90 120 150 Day 4 Day 8 PPARGC1A (fold change ) *** NS Vector F3–T3 0 0.5 1.0 1.5 2.0 2.5 3.0 3.5 0 0.5 1.00 1.5 2.0 2.5 3.0 3.5 2 m p-PIN4PMP70 F3–T3 Total PIN4PMP70 Vector 7 μm F3–T3 p-PIN4PMP70 PMP70 p-PIN4 Merge 2 μm PMP70 t-PIN4 Merge 2 μm
Figure 4 | Expression of F3–T3 fusion induces peroxisome biogenesis through phosphorylation of PIN4(Y122). a, Representative confocal micrographs of PEX1 immunostaining (red) and DAPI (blue) in vector and F3–T3-expressing human astrocytes. b, Quantification of PEX1 IMFI in samples stained as in a (n = 34 and 26 cells for vector and F3–T3, respectively). c, Representative confocal micrographs of double (top) and single (bottom) immunostaining for phospho-PIN4(Y122) (p-PIN4, red) and PMP70 (green) in vector and F3–T3-expressing human astrocytes. d, Quantification of peroxisome number per cell 4 and 8 days after F3–T3 expression in human astrocytes (n = 13 cells). e, Representative confocal micrographs of double immunostaining for total PIN4 (t-PIN4) and PMP70 in vector-expressing (left) or phospho-PIN4(Y122) and PMP70 in F3–T3-expressing (middle) human astrocytes. Arrowheads, PIN4(Y122)–PMP70 co-localization (bottom). Right, phospho-PIN4(Y122)–PMP70 co-localization (top) with corresponding spectral intensity profile (bottom); co-localization coefficients: Pearson’s correlation r = 0.935963; Mander’s overlap = 0.959905; Mander’s overlap coefficients k1= 0.934640, k2 = 0.985853; colocalization coefficients c1 = 1.000000, c2 = 0.999792. f, Quantification of peroxisome number per
cell in F3–T3 human astrocytes following silencing of PIN4 and expression of PIN4(WT) or PIN4(Y122F) (n = 19 cells). g, Quantification of protein biosynthesis by O-propargyl-puromycin (OPP) incorporation in human astrocytes that were treated as in d. Cycloheximide (CHX)-treated cultures are used as negative controls (n = 5 technical replicates). h, RT–qPCR of
PPARGC1A in human astrocytes that were treated as in d (n = 3 technical
replicates). i, Quantification of cellular ROS in vector-, F3–T3- and F3–T3-expressing human astrocytes. Bar graphs from one representative experiment (n = 4 technical replicates). j, Analysis of cellular ROS in human astrocytes that were treated as in d. Bar graphs from one representative experiment (n = 5 or 6 technical replicates). k, RT–qPCR of PPARGC1A in vector- or F3–T3-expressing cells that were treated with vehicle or N-acetyl-l-cysteine (NAC) (n = 3 technical replicates). Data are mean ± s.d. (g–k). P-values: b, d, f, two-sided MWW test; g–k, two-tailed
t-test with unequal variance. Box plots span the first to third quartiles
and whiskers indicate the smallest and largest values. Experiment in i was repeated twice; all other experiments were repeated three times with similar results.
Figs 3h, 10a, b). Using mass spectrometry analysis of PIN4 immuno-affinity complexes, we found that the peroxisomal biogenesis com-plex25 formed by PEX1 and PEX6 is the top ranking PIN4 interactor.
Other PIN4-associated proteins are implicated in vesicle formation and trafficking, nuclear and mitochondrial RNA metabolism and translation, ribosomal activity and nuclear pore/envelope functions (Extended Data Fig. 10c, d and Supplementary Table 8). Quantitative immunofluorescence revealed that PEX1 increased 2.7-fold in F3–T3 human astrocytes without changes in PEX1 mRNA (Fig. 4a, b and Extended Data Fig. 10e, f). To investigate whether F3–T3 signals through phospho-PIN4(Y122) to promote peroxisome biogenesis, we acutely transduced human astrocytes with a F3–T3-expressing lentivi-rus, and found that both phospho-PIN4(Y122) and the total number of PMP70-positive peroxi somes were increased after four days (4.3 fold increase in peroxisomes per cell; Fig. 4c, d and Extended Data Fig. 10g). Phospho-PIN4(Y122)-positive cytoplasmic structures in F3–T3 human astrocytes, but not unphosphorylated PIN4 in vector- transduced human astrocytes, colocalized with PMP70, indicating that phospho-PIN4(Y122) trafficks to new peroxisomal membranes (Fig. 4e). Increased peroxisome biogenesis induced by acute expression of F3–T3 was prevented when F3–T3 was introduced in cells in which PIN4 had been replaced by the unphosphorylatable PIN4(Y122F) mutant (Fig. 4f). F3–T3 also induced a phospho-PIN4(Y122)-dependent early increase in new protein synthesis (Fig. 4g and Extended Data Fig. 10h). Conversely, PGC1α and mitochondrial gene expression were unchanged four days after acute expression of F3–T3 but increased after eight days (Fig. 4h and Extended Data Fig. 10i). Peroxisome biogenesis and new protein synthesis can both generate ROS, and ROS are crucial inducers of PGC1α20,26,27. F3–T3 but not F3–T3(K508M) increased
ROS at the four-day time point and this effect required PIN4(Y122) phosphorylation (Fig. 4i, j and Extended Data Fig. 10j). Treatment of F3–T3 human astrocytes with the ROS inhibitor N-acetyl-l-cysteine eliminated approximately 70% of the increase in PGC1α induced by F3–T3 (Fig. 4k), thus indicating that ROS are responsible for most of the increase in PGC1α induced by F3–T3.
In conclusion, we describe, using an integrated computational and experimental framework, the chain of events propagated by F3–T3 in cancer. Signalling through phospho-PIN4(Y122) triggers vesicle traf-ficking to deliver building blocks for biogenesis of peroxisomes and new protein synthesis. The coordinated activation of these anabolic pathways results in the accumulation of ROS, which in turn increases PGC1α–ERRγ and mitochondrial metabolism. Thus, rather than impinging exclusively on mitochondrial circuits, the oncogenic signals driving mitochondrial respiration operate within larger contexts of anabolic effectors. Dependency on mitochondrial metabolism of GBM with F3–T3 suggests that inhibitors of oxidative phosphorylation may be beneficial for patients with F3–T3-positive tumours.
Online Content Methods, along with any additional Extended Data display items and Source Data, are available in the online version of the paper; references unique to these sections appear only in the online paper.
1. Ali, M. A. Chronic myeloid leukemia in the era of tyrosine kinase inhibitors: an evolving paradigm of molecularly targeted therapy. Mol. Diagn. Ther. 20, 315–333 (2016).
2. Di Stefano, A. L. et al. Detection, characterization, and inhibition of FGFR–TACC fusions in IDH wild-type glioma. Clin. Cancer Res. 21, 3307–3317 (2015). 3. Gerber, D. E. & Minna, J. D. ALK inhibition for non-small cell lung cancer: from
discovery to therapy in record time. Cancer Cell 18, 548–551 (2010). 4. Singh, D. et al. Transforming fusions of FGFR and TACC genes in human
glioblastoma. Science 337, 1231–1235 (2012).
5. Costa, R. et al. FGFR3–TACC3 fusion in solid tumors: mini review. Oncotarget 7, 55924–55938 (2016).
6. Lasorella, A., Sanson, M. & Iavarone, A. FGFR–TACC gene fusions in human glioma. Neuro-oncol. 19, 475–483 (2017).
7. Niola, F. et al. Mesenchymal high-grade glioma is maintained by the ID–RAP1 axis. J. Clin. Invest. 123, 405–417 (2013).
8. Škrtic´, M. et al. Inhibition of mitochondrial translation as a therapeutic strategy for human acute myeloid leukemia. Cancer Cell 20, 674–688 (2011). 9. Uchida, T., Fujimori, F., Tradler, T., Fischer, G. & Rahfeld, J. U. Identification and
characterization of a 14 kDa human protein as a novel parvulin-like peptidyl prolyl cis/trans isomerase. FEBS Lett. 446, 278–282 (1999).
10. Uchida, T. et al. Pin1 and Par14 peptidyl prolyl isomerase inhibitors block cell proliferation. Chem. Biol. 10, 15–24 (2003).
11. Yeh, E. S. & Means, A. R. PIN1, the cell cycle and cancer. Nat. Rev. Cancer 7, 381–388 (2007).
12. Frattini, V. et al. The integrated landscape of driver genomic alterations in glioblastoma. Nat. Genet. 45, 1141–1149 (2013).
13. He, H. & Garcia, E. A. Learning from imbalanced data. IEEE Trans. Knowl. Data Eng. 21, 1263–1284 (2009).
14. Carlsson, G. Topology and data. Bull. Am. Math. Soc. 46, 255–308 (2009). 15. Nicolau, M., Levine, A. J. & Carlsson, G. Topology based data analysis identifies
a subgroup of breast cancers with a unique mutational profile and excellent survival. Proc. Natl Acad. Sci. USA 108, 7265–7270 (2011).
16. Carro, M. S. et al. The transcriptional network for mesenchymal transformation of brain tumours. Nature 463, 318–325 (2010).
17. Mall, R. et al. RGBM: regularized gradient boosting machines for the identification of transcriptional regulators of discrete glioma subtypes. Preprint at https://doi.org/10.1101/132670 (2017).
18. Devarakonda, S. et al. Disorder-to-order transition underlies the structural basis for the assembly of a transcriptionally active PGC-1α/ERRγ complex. Proc. Natl Acad. Sci. USA 108, 18678–18683 (2011).
19. Lin, J., Handschin, C. & Spiegelman, B. M. Metabolic control through the PGC-1 family of transcription coactivators. Cell Metab. 1, 361–370 (2005).
20. St-Pierre, J. et al. Suppression of reactive oxygen species and neurodegeneration by the PGC-1 transcriptional coactivators. Cell 127, 397–408 (2006).
21. Xiong, W. C., Okano, H., Patel, N. H., Blendy, J. A. & Montell, C. repo encodes a glial-specific homeo domain protein required in the Drosophila nervous system. Genes Dev. 8, 981–994 (1994).
22. Tiefenböck, S. K., Baltzer, C., Egli, N. A. & Frei, C. The Drosophila PGC-1 homologue Spargel coordinates mitochondrial activity to insulin signalling. EMBO J. 29, 171–183 (2010).
23. Read, R. D. et al. A kinome-wide RNAi screen in Drosophila glia reveals that the RIO kinases mediate cell proliferation and survival through TORC2–Akt signaling in glioblastoma. PLoS Genet. 9, e1003253 (2013).
24. Read, R. D., Cavenee, W. K., Furnari, F. B. & Thomas, J. B. A. A Drosophila model for EGFR–Ras and PI3K-dependent human glioma. PLoS Genet. 5, e1000374 (2009).
25. Smith, J. J. & Aitchison, J. D. Peroxisomes take shape. Nat. Rev. Mol. Cell Biol. 14, 803–817 (2013).
26. Boveris, A., Oshino, N. & Chance, B. The cellular production of hydrogen peroxide. Biochem. J. 128, 617–630 (1972).
27. Han, J. et al. ER-stress-induced transcriptional regulation increases protein synthesis leading to cell death. Nat. Cell Biol. 15, 481–490 (2013). Supplementary Information is available in the online version of the paper. Acknowledgements We thank C. Scuoppo for donation of the pLCiG2 plasmid and support with the gRNA design, E. Chen for identification of PIN4 immunocomplexes and H. Li for high-content microscopy. This work was supported by NIH R01CA101644, U54CA193313 and R01CA131126 to A.L.; R01CA178546, U54CA193313, R01CA179044, R01CA190891, R01NS061776 and The Chemotherapy Foundation to A.I.; SickKids Garron Family Cancer Centre Pitblado Discovery and Ontario Institute for Cancer Research (OICR) Brain Translational Research Initiative to X.H.; American Brain Tumor Association (ABTA) and a Cancer Biology Taining Grant (T32CA009503) fellowship to V.Fra.; a NRF-2013R1A6A3A03063888 fellowship to S.B.L.; an Italian Association for Cancer Research (AIRC) fellowship to M.V.R. Author Contributions A.I. and A.L. conceived and coordinated the studies and provided overall supervision. M.C. and S.M.P. developed and performed bioinformatics analyses and wrote the computational sections. V.Fra. performed cell, molecular biology and metabolic assays, with help of T., M.V.R., A.M.C. and S.B.L. J.J.F. and X.H. developed and analysed the Drosophila F3–T3 model. K.S.J.E.-J. and D.M.C.R. conducted the phosphoproteomics experiments. M.S. and K.M. provided GBM tissues and assisted with immunostaining. G.L., T., V.Fre. and H.S. performed immunostaining and protein analyses. T. and P.S. performed mouse experiments. L.G., J.Z., L.C. and R.M. conducted gene expression and bioinformatics analyses. A.I. and A.L. wrote the manuscript with input from all authors.
Author Information Reprints and permissions information is available at www.nature.com/reprints. The authors declare competing financial interests: details are available in the online version of the paper. Readers are welcome to comment on the online version of the paper. Publisher’s note: Springer Nature remains neutral with regard to jurisdictional claims in published maps and institutional affiliations. Correspondence and requests for materials should be addressed to A.L. (al2179@cumc.columbia.edu) or A.I. (ai2102@cumc. columbia.edu).
MethODS
Datasets. Tumour sample data are from the TCGA. Details about the cohorts and analysed samples can be found in the Supplementary Information.
Resampling methods for ranked list generation in imbalanced datasets. Preliminary testing and the ee-MWW values are reported in the Supplementary Information.
Gene Ontology networks. Gene Ontology (GO) enrichment was computed using MWW test statistics for the genes positively regulated in tumours with
FGFR3-TACC3 or other genetic alterations of interest (for example, RAS and EGFR-SEPT14). The significant GO terms from MWW-gene set test (GST) analysis
(Supplementary Information) were further analysed using the Enrichment Map28
application of Cytoscape29. In the network, nodes represent the terms and edges
represent known term interactions and are defined by the number of shared genes between the pair of terms. Size of the nodes is proportional to statistical signifi-cance of the enrichment (Fig. 1b and Extended Data Fig. 1c) or the number of genes in the category (Fig. 3b and Extended Data Figs 5c, 6c, f, h). The overlap between gene sets is computed according to the overlap coefficient (OC), defined as:
∩
= A B
A B
OC
min( , )
where A and B are two gene sets, and |X| equals to the number of elements within set X30. We set a cutoff of OC > 0.5 to select the overlapping gene sets.
Correlation analysis between GO NES and the expression of F3–T3. We selected 19 human samples with F3–T3 fusions from ref. 31 and the TCGA fusion gene Data Portal32. Starting from fastq data, we applied the ChimeraScan pipeline33 to
com-pute the total number of reads supporting the fusion (Supplementary Table 6m). From TCGA, we obtained the legacy level 3 RNA sequencing by expectation max-imization (RSEM) counts of the samples. By using the EDASeq methodology34,
we corrected the counts for GC content and applied full-quantile normalization. We transformed the normalized counts in the transcripts per million abundance quantification, applied MWW-GST to each sample and collected the NES. We used the MDSigDB collections c5.bp, c5.mf, c5.cc and hallmark collections of gene sets. We compared each gene set with the number of reads supporting the F3–T3 fusions by using the Spearman’s rank correlation index (Supplementary Table 6n). To test the correlation, we assumed the alternative hypothesis of the correlation greater than zero.
Assembly of the transcriptional interactomes. To identify master regulators of the gene expression signature activated in the F3–T3-positive glioma subgroup, we first assembled independent transcriptional networks from gene expression profiles of GBM and pan-glioma datasets using the regularized gradient boosting machine algorithm (RGBM)17 (package available from CRAN at https://cran.r-project.org/
web/packages/RGBM/index.html). RGBM was used to identify regulators of the molecular subtypes of brain tumours17,35. We used gene expression profiles and a
predefined list of 2,137 gene regulators or transcription factors (master regulators) as input. This process was independently applied to obtain GBM and pan-glioma transcriptional interactomes comprising 430,104 (median regulon size: 203) and 300,969 (median regulon size: 141) transcriptional interactions, respectively, of which 188,238 were overlapping.
Master regulator activity. To identify the master regulators of the gene expression signature activated in F3–T3-positive glioma, we modified a method that we had previously described16. In brief, the activity of a master regulator MR, defined as the
index that quantifies the activation of the transcriptional program of that specific master regulator in each sample Si, is calculated as follows:
∑
∑
= − = + = − S N t M t Act( , MR)i 1 1 k N ki j M ji 1 1 where t+ki is the expression level of the k-th positive target of the master regulator
in the i-th sample, t−
ji is the expression level of the j-th negative target of the master
regulator in the i-th sample, N (or M) the number of positive (or negative) targets present in the regulon of the considered master regulator. If Act(Si, MR) > 0, the
master regulator is activated in that particular sample, if Act(Si, MR) < 0, the master
regulator is inversely activated, if Act(Si, MR) ≈ 0, it is deactivated. We used the
MWW test to select master regulators that showed a significant difference between the F3–T3-positive samples and all the other samples. In Supplementary Table 7a, b, we present the list of master regulators obtained by applying master regulators analysis
(
log2(
1 NES−NES)
> .2 0)
and significance of differential activity <0.01. Topological data analysis. Topological data analysis14,15 (TDA) of the pan-glioma dataset was based on the Mapper algorithm36. The topological network
was built using the Ayasdi platform (http://www.ayasdi.com). Several open-source implementations of Mapper are available (https://github.com/MLWave/kepler- mapper, http://danifold.net/mapper/, https://github.com/RabadanLab/sakmapper,
https://github.com/paultpearson/TDAmapper). TDA was performed using the expression matrix of the top 100 genes differentially expressed between F3–T3-positive tumours and the remaining tumours as shown in Extended Data Fig. 6a. Mapper uses a dimentionality reduction algorithm and produces a topo-logical representation of the data that preserves locality. The projection space of the dimentional-reduction algorithm is covered with overlapping bins. The data points that fall in each bin are then clustered in the original high-dimentional space. A network is constructed by assigning a node to each cluster, and clusters that share one or more samples are connected by an edge. The result is a low-dimensional network representation of the data in which nodes represent sets of samples with similar global transcriptional profiles, and edges connect nodes that have at least one sample in common. For our analysis we used 2D Locally Linear Embedding37
as dimentional-reduction algorithm and variance normalized Euclidean metric38
as distance. Single-linkage clustering was performed in each of the pre-images of the bins using a previously described algorithm39. The number of bins (resolution)
for each dimension was 20 and the degree of overlap (gain) between neighbouring bins was 66%. The size of the bin was chosen such that the number of samples in each row or column of bins was the same. The open-source implementations of Mapper produce results consistent with those obtained from the Ayasdi platform40.
Transcriptomic analysis of human astrocytes. We performed comparative analysis of gene expression of human astrocytes transduced with a lentivirus expressing F3–T3 treated with vehicle (F3–T3 and DMSO, n = 5 replicates), F3–T3 treated with the FGFR inhibitor PD173074 for 12 h (F3–T3 and PD173074, n = 5 replicates), F3–T3(K508M) treated with vehicle (F3–T3(K508M) and DMSO, n = 3 replicates) and empty vector treated with vehicle (vector DMSO, n = 3 replicates). Expression data were obtained using the Illumina human HT12v4 gene expres-sion array. The list of 4,034 differentially expressed genes between the F3–T3 and DMSO and F3–T3 and PD173074 groups (t-test P < 0.01 and MWW test P < 0.01) was used to construct a heat map comprising the whole dataset in which vector and DMSO and F3–T3(K508M) and DMSO are control groups. Samples were clustered using the hierarchical clustering algorithm based on the Ward linkage method and Euclidean distance as implemented in R. Finally, the GO enrichment analysis was performed using the ranked list obtained from three independent comparisons: F3–T3 versus F3–T3 treated with PD173074; F3–T3 versus F3–T3(K508M); F3–T3 versus vector using the Java version of GSEA. For each comparison, statistically significant GO terms with Q < 10−6 were selected. The statistically significant
pathways common to all three comparisons were included in the construction of the visual network using the Enrichment Map application28 of Cytoscape29.
The microarray data have been deposited in ArrayExpress with accession number E-MTAB-6037.
Identification of proteins phosphorylated by the F3–T3 gene fusion using mass spectrometry. Cells were lysed in buffer containing 9 M urea, 20 mM HEPES pH 8.0, 0.1% SDS and a cocktail of phosphatase inhibitors. Six milligrams of protein were reduced with 4.5 mM DTT, alkylated with 10 mM iodoacetamide and digested with trypsin overnight at 37 °C. Samples were desalted on a C18 cartridge (Sep-Pak plus C18 cartridge, Waters). Each sample was prepared in triplicate. Phosphopeptide enrichments were performed as previously described41. An LTQ
Orbitrap XL (ThermoFisher) in-line with a Paradigm MS2 HPLC (Michrom biore-sources) was used to acquire high-resolution mass spectrometry and tandem mass spectrometry data. Technical duplicate data for each of the metal-oxide affinity chromatography elutions and triplicate data for the phosphotyrosine immuno-precipitation samples were acquired.
RAW files were converted to mzXML using msconvert42 and searched against
the Swissprot Human protein database (9 January 2013 release) appended with common proteomics contaminants and reverse sequences as decoys. Searches were performed with X!Tandem (version 2010.10.01.1) using the k-score plugin43,44.
For all searches the following search parameters were used: parent monoisotopic mass error of 50 parts per million (p.p.m.); fragment ion error of 0.8 daltons; allowing for up to two missed tryptic cleavages. Variable modifications were oxidation of methionine (+15.9949@M), carbamidomethylation of cysteine (+57.0214@C), and phosphorylation of serine, threonine, and tyrosine (+79.9663@ [STY]). The search results were then post-processed using PeptideProphet and ProteinProphet45–47. Spectral counts were obtained for each cell line using
ABACUS48. Immunoprecipitation data of phospho-tyrosine enrichment were
processed through ABACUS separately from the MOAC enrichment data. ABACUS results were filtered to only retain proteins with a ProteinProphet probability >0.7. Only phosphorylated peptides with a probability >0.8 were considered for spectral counting. For tyrosine enrichment these ABACUS parameters resulted in a protein false discovery rate (FDR) of 0.0045. This ABACUS output was used for all subsequent analysis to quantify the relative abundance of phospho-rylated peptides or proteins. Phospho-site localization was performed with an in-house reimplementation of the Ascore algorithm as previously described49.
>19 corresponding to sites localized with >99% certainty. From four biological replicates, the application of stringent criteria selected 22 top-scoring candidate substrates of F3–T3 that exhibited at least a 1.5-fold enrichment in F3–T3 human astrocytes compared to human astrocytes expressing F3–T3(K508M) or the empty vector (Supplementary Table 2).
Identification of PIN4 complexes by mass spectrometry. Endogenous cellular PIN4 complexes were purified from the cell line H1299 transduced with the F3– T3-expressing lentivirus. Cellular lysates were prepared in 50 mM Tris-HCl, 250 mM NaCl, 0.2% NP40, 1 mM EDTA, 10% glycerol, protease and phosphatase inhibitors. PIN4 and mock immunoprecipitates were recovered with PIN4 antibody (Abcam, ab155283) and rabbit IgG, respectively. Immunocomplexes captured on protein A/G agarose beads were washed with lysis buffer containing 300 mM NaCl and 0.3% NP40. Bound polypeptides were eluted with the PIN4 peptide used as the epitope for the PIN4 antibody (KPVFTDPPVKTKFGYH, Abcam, ab155283). Eluates were run on SDS–PAGE gels and four gel slices were cut from the lane containing PIN4 immunoprecipitates (columns A1, B1, C1, D1; Supplementary Table 8). Four similar gel slices were cut from the lane containing control rabbit IgG immunoprecipitates (columns A2, B2, C2, D2; Supplementary Table 8). The excised gel pieces were rehy-drated and digested in 80 μl of 12.5 ng μl−1 Trypsin Gold and 50 mM ammonium
bicarbonate at 37 °C overnight. Extracted peptides were dried, reconstituted in 30 μl 0.1% TFA and stored at −20 °C before analysis.
The concentrated peptide mix was reconstituted in a solution of 2% acetonitrile (ACN), 2% formic acid (FA) and eluted from the column using a Dionex Ultimate 3000 Nano LC system. The application of a 2.0-kV distal voltage electrosprayed the eluting peptides directly into the Thermo Fusion Tribrid mass spectrometer equipped with an EASY-Spray source (Thermo Scientific). Mass spectrometer- scanning functions and HPLC gradients were controlled by the Xcalibur data system (Thermo Finnigan). Tandem mass spectra from raw files were searched against a human protein database using the Proteome Discoverer 1.4 software (Thermo Finnigan). The peptide mass search tolerance was set to 10 p.p.m. A minimum sequence length of seven amino acids residues was required. Only fully tryptic peptides were considered. Spectral counts were used for estima-tion of relative protein abundance between samples analysed directly on long gradient reverse phase liquid chromatography–tandem mass spectrometry. A specificity score of proteins interacting with PIN4 was computed for each poly-peptide as described50. In brief, we compared the number of peptides identified
from our mass spectrometry analysis to those reported in the CRAPome data-base that includes a list of potential contaminants from affinity purification–mass spectrometry experiments (http://www.crapome.org/). The specificity score is computed as (p × c) / Sav × Smax× E, where p is the identified peptide count; c the cross- correlation score for all candidate peptides queried from the database; Sav the averaged spectral counts from CRAPome; Smax the maximal spectral counts
from CRAPome; and E the total number of experiments that were found in the CRAPome database.
Cell culture. Human cell lines. h-TERT-immortalized human astrocytes51, SF126
cells52, U87 (ATCC HTB-14), h-TERT-RPE-1 (ATCC CRL-4000), HEK293T
(ATCC CRL-11268), U251 (Sigma 09063001) cells. Cell lines were cultured in DMEM supplemented with 10% fetal bovine serum (FBS, Sigma). Cells were trans-fected using Lipofectamine 2000 (Invitrogen) or the calcium phosphate method.
Mouse glioma stem cells. F3–T3;shTrp53 and HRAS(12V);shTrp53 mGSCs were
isolated from the brains of mice that had received injection of lentivirus containing a bi-cistronic expression cassette including F3–T3 or HRAS(12V) and Trp53 shRNA into the dentate gyrus as described4,7. Mice showing neurological
symp-toms were euthanized 2–4 months after intracranial injection, and brain tumours were identified macroscopically, dissected and cultured in DMEM:F12 containing 1× N2 and B27 supplements (Invitrogen) and human recombinant FGF2 and EGF (20 ng ml−1 each; Peprotech). Studies were approved by the IACUC at Columbia
University (AAAL7600).
Human glioma stem cells. The GBM-derived glioma stem cells (GSCs) used in
this study have been described previously4,12. GBM-derived GSCs were grown
in DMEM:F12 containing 1× N2 and B27 supplements (Invitrogen) and human recombinant FGF2 and EGF (20 ng ml−1 each; Peprotech). Cells were transduced
using lentiviral particles in medium containing 4 μg ml−1 of polybrene (Sigma).
Cells were routinely tested for mycoplasma contamination using the Mycoplasma Plus PCR Primer Set (Agilent Technologies) and were found to be negative. Cell authentication was performed using short-tandem repeats (STR) at the ATCC facility.
Limiting dilution assay (LDA) for human GSCs was performed as described previously50. In brief, spheres were dissociated into single cells and plated into
96-well plates in 0.2 ml of medium containing growth factors at increasing densi-ties (1–100 cells per well) in triplicate. Cultures were left undisturbed for 14 days, and then the percentage of wells not containing spheres for each cell dilution was calculated and plotted against the number of cells per well. Linear regression lines
were plotted, and we estimated the minimal frequency of glioma cells endowed with stem cell capacity (the number of cells required to generate at least one sphere in every well = the stem cell frequency) based on the Poisson distribution and the intersection at the 37% level using Prism 6.0 software. Data represent the means of three independent experiments performed on different days.
The soft agar colony assay was performed by seeding human astrocytes at a density of 10,000 cells per well in 6-well plates in 0.3% agar in DMEM and 10% FBS. The number of colonies per well was determined using an Olympus 1X70 microscope equipped with a digital camera.
Subcutaneous xenograft glioma models. Mice were housed in a pathogen-free animal facility. All animal studies were approved by the IACUC at Columbia University (AAAQ2459; AAAL7600). Mice were 4–6 week old male and female athymic nude (Nu/Nu, Charles River Laboratories). No statistical method was used to pre-determine sample size. No method of randomization was used to allocate animals to experimental groups. Mice in the same cage were generally part of the same treatment. The investigators were not blinded during outcome assessment. In none of the experiments did tumours exceed the maximum volume allowed according to our IACUC protocol, specifically, 20 mm in the maximum diameter. 5 × 10⁵ F3–T3 human astrocytes transduced with a lentivirus expressing
the shRNA sequence against PPARGC1A or ESRRG or the empty vector were injected subcutaneously in the right flank in 150 μl of saline solution (five mice per group). 0.5 × 10⁵ F3–T3;shTrp53 mGSCs and HRAS(12V);shTrp53 mGSCs
transduced with lentivirus expressing two independent shRNA sequences against
PPARGC1A were injected subcutaneously in the right flank in 100 μl of saline
solution (five mice per group). Treatment with tigecycline (10 mice) or vehicle (8 mice) was performed in mice injected with 1 × 10⁵ F3–T3;shTrp53 mGSCs when
tumours reached 150–270 mm3 (10 days after injection). Tigecycline was diluted in
saline pH 7 and administered at dose of 50 mg kg−1 body weight by intraperitoneal
injection b.i.d. Tumour diameters were measured daily with a caliper and tumour volumes estimated using the formula: (width2 × length) / 2 = V (mm3). Mice were
euthanized when tumour size reached the maximum diameter allowed by our IACUC protocol (20 mm in the maximum diameter) or when mice displayed body weight loss equal to or greater than 20% of total body mass, or showed signs of compromised health or distress.
Plasmids, cloning, and lentivirus production. cDNAs for FGFR3, PIN4, PKM2,
GOLGIN84, DLG3, C1ORF50 and PPARGC1A were amplified by PCR and
cloned into the pLOC vector in frame with Flag or V5 tag. F3–T3, F3–T3K508M
and FLAG-tagged PEX1 were cloned into a pLVX-puro vector (Clontech). To generate PIN4(Y122A), PIN4(Y122F), PKM2(Y105A), GOLGIN84(Y42A), DLG3(Y673A) and C1orf50(Y131A), site-directed mutagenesis was performed using the QuickChange Site-Directed mutagenesis kit (Agilent) and the resulting plasmids were sequence verified. Lentivirus was produced by co-transfection of the lentiviral vectors with pCMV-ΔR8.1 and pCMV-MD2.G plasmids into HEK293T cells as previously described7,16. shRNA sequences are: PIN4 shRNA:
GTCAGACACATTCTATGTGAACTCGAGTTCACATAGAATGTGTCTGAC;
PPARGC1A Hs-shRNA1: GCAGAGTATGACGATGGTATTCTCGAGAA
TACCATCGTCATACTCTGC; PPARGC1A Hs-shRNA2: CCGTT
ATACCTGTGATGCTTTCTCGAGAAAGCATCACAGGTATAACGG; Ppargc1a Mm-shRNA1: C CA GAACAAGAACAACGGTTTCTCGAGAAACCGT TGTTCTTGTTCTGG; Ppargc1a Mm-shRNA2: CCCATTTGAGAACAAGAC TATCTCGAGATAGTCTTGTTCTCAAATGGG; ESRRG shRNA1: CAAACAA AGATCGACACATTGCTCGAGCAATGTGTCGATCTTTGTTTG; ESRRG shRNA2: CATGAAGCGCTGCAGGATTATCTCGAGATAATCCTGC AGCGCTTCATG.
For the generation of PPARGC1A-knockout F3–T3 human astrocytes with CRISPR–Cas9, guide RNA (gRNA) sequences were designed to target the coding sequence of PPARGC1A as described (http://crispr.mit.edu/). We designed two gRNAs against exon 1 of the PPARGC1A gene and validated three clones for loss of PGC1α expression. sgRNA sequence 1 (GGCGTGGGACATGTGCAACC) and 2 (ACCAGGACTCTGAGTCTGTA) were inserted by linker cloning in the lenti-viral vector pLCiG253,54. Human astrocytes expressing the empty vector or F3–T3
were infected either with pLCiG2 and control, pLCiG2 and PPARGC1A gRNA1 or pLCiG2 and PPARGC1A gRNA2. After 72 h of infection, cells were seeded in a 96-well plate at a density of 0.6 cell per well. Two weeks later, colonies were isolated and PPARGC1A deletion was analysed by RT–qPCR and western blot. For acute expression of F3–T3 in human astrocytes, cells were first transduced with pLOC expressing Flag–PIN4(WT) or the Y122F mutant. Subsequently, cells were transduced with a pLKO.1-puro vector encoding shRNA targeting PIN4. The levels of endogenous and ectopically expressed proteins were then verified by immunoblotting. Finally, cells were transduced with a pLVX vector expressing F3–T3.
Generation of phospho-PIN4(Y122) antibody. The anti-phospho-PIN4 antibody was generated by immunizing rabbits with a short synthetic peptide