HAL Id: hal-00576589
https://hal.archives-ouvertes.fr/hal-00576589
Submitted on 14 Mar 2011HAL is a multi-disciplinary open access archive for the deposit and dissemination of sci-entific research documents, whether they are pub-lished or not. The documents may come from teaching and research institutions in France or abroad, or from public or private research centers.
L’archive ouverte pluridisciplinaire HAL, est destinée au dépôt et à la diffusion de documents scientifiques de niveau recherche, publiés ou non, émanant des établissements d’enseignement et de recherche français ou étrangers, des laboratoires publics ou privés.
Effect of topological and phenological changes on
biomass partitioning in Arabidopsis thaliana
inflorescence: a preliminary model-based study
Veronique Letort, Paul-Henry Cournède, Jérémie Lecoeur, Irène Hummel,
Philippe de Reffye, Angélique Christophe
To cite this version:
Veronique Letort, Paul-Henry Cournède, Jérémie Lecoeur, Irène Hummel, Philippe de Reffye, et al.. Effect of topological and phenological changes on biomass partitioning in Arabidopsis thaliana inflores-cence: a preliminary model-based study. PMA06, Plant Growth Modeling, Simulation, Visualization and applications, Nov 2006, Beijing, China. pp.65-69. �hal-00576589�
Effect of topological and phenological changes on biomass partitioning in
Arabidopsis thaliana inflorescence: a preliminary model-based study
Véronique LETORT
1*, Paul-Henry COURNEDE
1, Jérémie LECOEUR
2, Irène HUMMEL
2,
Philippe DE REFFYE
3and Angélique CHRISTOPHE
21
Ecole Centrale Paris, Applied Mathematics Laboratory, F-92295 Châtenay-Malabry, France
2INRA, Montpellier SupAgro, UMR759 LEPSE, 2 place Viala, F-34060 Montpellier, France
3
Cirad-Amis, TA 40/01 Ave Agropolis, 34398 Montpellier cedex 5, France
E-mail: letort@mas.ecp.fr
Abstract
Although the existence of phenological impact on biomass partitioning in the plant is known for many species, it is difficult to quantify this effect and to unravel it from the complex functional processes that interact during plant growth. This work explores the variations of biomass allocated to fruits according to simple changes in the topological and phenological development of Arabidopsis thaliana plants. Four plants of the same genotype (ecotype Columbia) were grown in controlled conditions in growth chamber. Their topological differences were studied using the functional-structural model GreenLab. It showed that when fitting the four plants with a single set of parameters, but each plant being given its own topological structure, half of the biomass variability can be reproduced.
1. Introduction
The existence of a link between plant phenology and biomass allocation, and more particularly reproductive allocation is a well-known phenomenum for many plant species [1][2][3]. For example, using single-mutation lineages of Arabidopsis thaliana, Baker et al. [2] found a pleiotropic covariation between flowering time and sexual allocation. However, this kind of relationship is often difficult to quantify. Moreover, it is crucial to unravel the complex influences of all the interacting processes: genetic or environmental, phenological or functional… This is where modelling can play a role. It provides a simplified framework to analyze plant growth and to test hypotheses.
In order to take into consideration topological variations between plants, models should be able to account for both architectural and functional developments [4]. GreenLab [5][6][7] is such a functional-structural model. It is a dynamic mathematical model that combines a description of plant architecture at the level of organs and computes biomass production and repartition among organs according to a source-sink approach.
This paper explores the variations of biomass allocation in the inflorescence of Arabidopsis thaliana (L.) Heynh. plants (ecotype Columbia) in relationship with topological variations. Although it is not a plant of agronomic interest, Arabidopsis is a perfect model-plant for this kind of study where the environmental and genetic backgrounds need to be carefully controlled. Moreover, its development is similar to other herbaceous ones (e.g. chrysanthemum, canola) so the procedures and the results can be generalized. We first present briefly the model specificities for Arabidopsis, integrating branching patterns. It was calibrated on average target data that were measured on four plants grown in controlled conditions, without environmental stress. The model was then used to investigate the influence of the topological structure of inflorescences on biomass partitioning. Indeed, the compartment demands depend on the number of organs that may appear or expand at each cycle. A sensitivity analysis can reveal which proportion of the biomass variability can be explained by this simple mechanism. In application, the ability of the model to fit the experimental data obtained on four plants with a single set of parameters is tested, plants differing only by their topological structures and elongation delays for the lateral axes of the inflorescences.
2. Materials and Methods
2.1. Experimental data
Four plants of Arabidopsis thaliana (L.) Heynh. plants, ecotype Columbia (Col-0), were grown in a growth chamber. Seeds were sown with a pipetman in plastic pots (9 cm high, 4.5 cm diameter) filled with a mixture (1:1, v:v) of a loamy soil and organic compost. The water content of the substrate was maintained at a constant level of 0.40 g.g-1 of dry soil. The photoperiod
was 12h and light in the growth chamber was provided by a bank of a cool-white fluorescent tubes and sodium lamps. Mean daily cumulative photosynthetic photon flux density in the growth chamber was approx. 8 mol m–2 d-1. Mean air temperature was 19.3 °C and air
humidity was maintained at approximately 75%. Mean leaf-air vapour pressure deficit (VPD leaf-air) was calculated continuously during the experiment and maintained below 0.8 kPa.
From leaf emergence to the end of vegetative growth, the seedlings were photographed every 2-3 days to follow the rosette development. The projected leaf area was measured using image analysis software (Bioscan-Optimas V 4.10, Edmonds, WA). The rate of phytomer appearance, expansion duration and specific weight of each leaf were recorded from experiments in the same growth conditions (see [8] and [9]). The four plants were harvested when they had reached the stage 6.90, according to the specifications of Boyes et al. [10]. Their topologies were recorded by counting and positioning the internodes, leaves and fruits on a schematic drawing. Note that the part situated above the lowest silica for each axis was considered as a single organ, called fruit hereafter. Their organs, including roots, were oven-dried at 80 °C for 4d and then weighted.
2.2. GreenLab model for Arabidopsis thaliana
2.2.1. The model. GreenLab is a generic model of
dynamic plant growth whose parameter values are species-dependent. It considers organogenesis, biomass production and allocation at organ scale. A detailed description can be found in [5], [6] and [7]. Some specific features were chosen for Arabidopsis modelling: (i) as the model is used as a tool to analyze the growth processes, observable parameters are input directly from the measurements (in particular for leaf projected area) and (ii) as Arabidopsis inflorescence has a branching architecture with top-down delays, this new topological feature is introduced.
The elementary units for the modelling of organogenesis are phytomers. They can be gathered
into categories according to their physiological ages. The physiological age (PA) of a phytomer characterizes the state of differentiation of its apical bud [11]. Each category has its own set of physiological and topological parameters. Concerning
Arabidopsis, the basal rosette has been chosen as PA 1
(short internode, one leaf and one lateral bud) and the inflorescence phytomers as PA 2 (long internode, one leaf, one lateral bud and potentially one fruit); see Figure 1.
The model time step is defined according to the thermal time between the appearances of two successive phytomers. Biomass production is computed at each cycle. It is set to be proportional to the projected leaf area, which was input directly from the measurements to avoid biases due to its calculation. The conversion coefficient (R) between absorbed light and produced biomass is a parameter of the model. At each time step, the topological structure of the plant is updated according to the chosen branching rules. The total demand of the plant can be computed as the sum of the individual sink strengths of all existing organs. The biomass increment of an organ is proportional to its sink strength and to the ratio of available biomass over the total demand.
We detail below So, the sink strength of an organ of
type o, o in {b, i, f, r}, respective indices for blade, internode, fruit and root and of physiological age k. It depends on its chronological age i and on the axis it belongs to. An axis is characterized by its physiological age k and the growth cycle j it appeared at. The sink strength is thus written as:
) , , ( ) ( ) ( ) , , (ki j P k f i d k i j So = o ⋅ o ⋅ o (1)
where Po(k) is the sink reference value for organ o
of PA k and fo(i) is an empiric function defining the
evolution of the sink value according to its chronological age i. It is defined through three parameters that were estimated from the observations for each leaf rank: ao and bo defining the curve shape
and Te which is the expansion duration. In Arabidopsis
inflorescences, axes expand bottom-up, following the principle of apical dominance, as defined by Cline [12]. To model this feature, each axis of PA k
appearing at cycle j is given a delay do(k,j) which is a
parameter driving the sink emergence of organs belonging to this axis [13], as in Eq(2):
≤ = 10 . ( , ) ) , , ( else j k d i if j i k d o o (2)
Geometrical shape of organs is only needed for visualization purpose and have no effect in the model. It is set following simple allometric rules. A detailed study of organ growth rates in length can be found in [14] and geometrical modelling and 3D-visualization in [15].
2.2.2. Identification procedure. The software
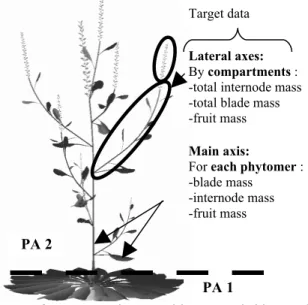
Digiplante, developed in the lab of applied mathematics at Ecole Centrale Paris [16] was used to estimate the numerical values of GreenLab parameters from experimental data. A non-linear generalized least square algorithm was run; details can be found in [7]. The types of observations are represented in figure 1, on a plant simulated with Digiplante software. They consist in individual organ weights for each phytomer of the main axis and cumulated data by compartment for the lateral axes.
Figure 1. Plant architecture (with PAs) and target measurements to fit the model.
3. Results
3.1. Fitting on average target
0 0.002 0.004 0.006 0.008 0.01 0.012 32 33 34 35 36 37 38 39 40 41 42 Fruit rank on the main axis
F ru it D M ( g ) la te ra l a x e s 0 0.01 0.02 0.03 0.04 0.05 0.06 0.07 F ru it D M (g ) m a in a x is
Lateral axes obs Lateral axes sim Main axis obs Main axis sim
Figure 2. Comparison between average target data (black symbols) and fitted values (white symbols) for fruit weights.
The average topology of inflorescences was simply defined as the average number of organs on each lateral axis. The number of phytomers in the basal rosette was assumed to be constant and the remaining leaves were set to belong to lateral shoots that did not reach their full expansion (only leaves were visible). As biomass weights were measured at compartment level for lateral axes, the average target can easily be defined. Figure 2 shows the fitting results for the fruit masses according to their positions in the inflorescence (the last one is that of the main shoot).
3.2. Influence of phenological and topological changes on biomass allocation
As shown in Figure 2, there is a high variability in the measurements of fruit masses (up to 100% variation). Although the sources of variations are difficult to detect (the plants were of the same genotype and grown in the same controlled environmental conditions), it is interesting to explore which proportion of biomass variability can be explained by phenological and topological variability in the model. The sensitivity of the model outputs to changes in the inflorescence topology can be illustrated through the simulated results of Table 1. When several organs are concerned (e.g. for internodes on the main stem), the average value is given.
Table 1. Simulated biomass variation according to topological changes on lateral axes.
Variation in phytomer numbers +1 -1
Total biomass variation (%) +0.16 -0.26
Root biomass variation (%) 0 0
Rosette biomass variation (%) 0 0
Internode mass, main axis, averaged var. (%): +0.35 -0.45 Internode mass, lateral axes, averaged var.
(%)
+14.3 -20
Fruit mass variation, main axis (%) +1.1 -0.59
Fruit mass, lateral axes, averaged var. (%) -26.2 +34
Total fruit mass variation (%) -8.9 +11.5
Using the set of calibrated parameters, two simulations were run with respectively one more phytomer (case “+1”) and one less phytomer (case “-1”) on each lateral axis. The simulated allocation to the main biomass compartment was compared with the reference plant. As the fruit is borne by the last phytomer of each axis, the topological change induces a change in phenology: the lateral fruits appear at a different time (one cycle later than for the reference plant for case +1). The total biomass production is very slightly affected by topological changes in the inflorescence as it is mainly performed in earlier stages. Root and rosette compartments are not affected
PA 1
Lateral axes:
By compartments : -total internode mass -total blade mass -fruit mass
Main axis:
For each phytomer : -blade mass
-internode mass -fruit mass
PA 2
either since they have almost finished their expansions when the changes occur. Although the variation of organ weights on the main axis is small, the trend is easily interpretable: increasing the appearance time of lateral fruits reduces the trophic competition that organs of the main axis have to face. The most important variations are to be seen on the lateral biomass compartments. A decrease of one phytomer induces an average increase of the fruit weight of 34%. This is the result of the combination of (i) a decrease in the global demand due to the lacking phytomers and (ii) a highest duration of expansion for the lateral fruits.
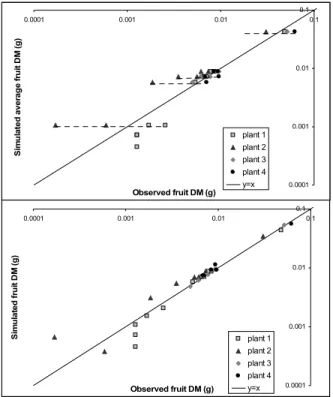
It is interesting to take advantage of this high variability of biomass to fit the four plants taking into account their own topological structures. The inflorescence topology was defined for each plant according to the records of the numbers of organs on lateral axes. Then delays were estimated for each axis independently by model inversion. All other parameters of the model were common to the four plants. Their values were found similar to the fitting results on average target (relative difference varies from 0.4% (for R) to 35% for fruit sink). Figure 3 presents the fitting results concerning fruit mass on lateral and main axes (logarithmic scale).
Figure 3. Identification results on fruit dry masses (g) for the average plant (A) and the four plants with their own topology and delays (B).
In Figure 3A, there is only one simulated plant to be compared with four observed plants (dotted lines). In Figure 3B, there are four simulated plants sharing the same set of parameters except for their inflorescence topology. The linear regression results show that part of the fruit biomass variability among the plants can be reproduced with variability on organ numbers and appearance delays only. The average variance of measured fruit masses is 1.74 (10-5 g2) and the
simulated one is 0.95: simulations with estimated parameter values and variations on topology and phenology of the lateral axes produce a variance of fruit biomass which is 52% of the observed one.
5. Discussion and conclusion
The model parameters were estimated using average target data and average topology. Then, the estimated parameters were used to simulate plants with topological differences in their inflorescence architectures. It revealed that a spatial and temporal difference of one phytomer in the lateral axes could induce a variation in mass of 34%. Then a new estimation was done on four plants sharing the same set of parameters and only differing by their topological structures. These topological differences explained 52% of the variance of observed data.
However, this study raises several problems. The first one is to determine the causes of the topological variations among plants that are from the same inbred line and growing in the same controlled conditions. It can be hypothesized that micro-climate fluctuations (hydric, light, temperature), or small differences in seed weight [17], seed dormancy or sowing depth [18] could be the major factors.
Another problem is the determination of the exact axis delays: as they were not measured, they were estimated without constraints and thus their variability could be over-estimated compared to the real one. Instead of considering delays as input parameters of the model, a further step would be to link them to the functional state of the plant. As suggested in Mathieu
et al. [6], a possible way would be to link the delay
determination to the ratio of biomass supply over demand. This global key variable of the model reflects the trophic competition during plant growth and may thus be chosen as the main variable driving plant plasticity.
6. References
[1] F. Roos, J. Quinn. “Phenology and reproductive allocation in Andropogon scoparius (Gramineae) popuations 0.0001 0.001 0.01 0.1 0.0001 0.001 0.01 0.1 Observed fruit DM (g) S im u la te d f ru it D M ( g ) plant 1 plant 2 plant 3 plant 4 y=x 0.0001 0.001 0.01 0.1 0.0001 0.001 0.01 0.1 Observed fruit DM (g) S im u la te d a v e ra g e f ru it D M ( g ) plant 1 plant 2 plant 3 plant 4 y=x
in communities of different successional stades”. American
Journal of Botany. 64(5): 535-540, June 1977.
[2] A.M. Baker, M. Burd, K.M. Climie. “Flowering phenology and sexual allocation in single-mutation lineages of Arabidopsis thaliana”. Evolution. 59(5): 970-978, May 2005.
[3] M. Routhier, L. Lapointe. “Impact of tree leaf phenology on growth rates and reproduction in the spring flowering species Trillium erectum (Liliaceae)”. American Journal of
Botany. 89: 500-505, 2002.
[4] R. Sievänen, E. Nikinmaa, P. Nygren, H. Ozier-Lafontain, J. Perttunen, H. Hakula. “Components of functional–structural tree models”. Ann Sci, 57: 399-412, 2000.
[5] H. Yan, M. Kang, P. de Reffye, M. Dingkuhn. “A dynamic, architectural plant model simulating resource-dependent growth”. Annals of Botany 93: 591–602, 2004. [6] A. Mathieu, P. Cournède, P. de Reffye. “A dynamical model of plant growth with full retroaction between organogenesis and photosynthesis”, ARIMA 4: 101-107, 2006.
[7] Y. Guo, Y. Ma, Z. Zhan, B. Li, M. Dingkuhn, D. Luquet, and P. de Reffye. “Parameter optimization and field validation of the functional–structural model GREENLAB for maize”. Annals of Botany. 97, 217-230, 2006.
[8] K. Chenu, N. Franck, J. Dauzat, J.F. Barczi, H. Rey H., J. Lecoeur. “Integrated responses of rosette organogenesis, morphogenesis and architecture to reduced incident light in Arabidopsis thaliana results in higher efficiency of light interception.” Functional plant biology 32 (12): 1123-1134, 2005.
[9] C. Granier, C. Massonet, O. Turc, B. Muller, K. Chenu, F. Tardieu. “Individual leaf development in Arabidopsis thaliana : a stable thermal-time-based programme”. Annals of
Botany 89: 595-604, 2002.
[10] D.C. Boyes, A.M. Zayed, R. Ascenzi, A.J. McCaskill, N.E. Hoffman, K.R. Davis, J Görlach. “Growth stage-based phenotypic analysis of Arabidopsis: a model for high throughput functional genomics in plants”. The Plant Cell 13: 1499-1510, 2001.
[11] D. Barthélémy and Y. Caraglio. “Plant architecture: a dynamic, multilevel and comprehensive approach to plant form, structure and ontogeny”. Annals of Botany. 1-33, 2007. [12] M.G. Cline. “Concept and terminology of apical dominance”. American Journal of Botany 84(9): 1064-1069, 1997.
[13] M. Z. Kang, E. Heuvelink, P. de Reffye “Building Virtual Chrysanthemum Based on Sink-Source
Relationships: Preliminary Results”. Acta Horticulturae 718: 129-136, 2006.
[14] L. Mündermann, Y. Erasmus, B. Lane, E. Cohen, P. Prusinkiewicz. “Quantitative Modeling of Arabidopsis Development”. Plant Physiology 139: 960–968, 2005. [15] P. de Visser, L. Marcelis G. van der Heijden, G. Angenent. 2003. “3D digitization and modeling of flower mutants of Arabidopsis thaliana.” In B.G. Hu, M. Jaeger, eds, Plant Growth Modeling and Applications. Tsinghua University Press and Springer, Beijing, pp 218–226.
[16] P. Cournède, M. Kang, A. Mathieu A, J. Barczi, H. Yan, B. Hu, P. de Reffye. “Structural factorization of plants to compute their functional and architectural growth”.
Simulation. 82(7): 427–438, 2006.
[17] C. Houssard and J. Escarré. “The effects of seed weight on growth and competitive ability of Rumex acetosella from two successional old-fields”. Oecologia. 86(2): 236–242, 1991.
[18] Y. Zheng, Z. Xie, Y. Yu, L. Jiang, H. Shimizu, G.M. Rimmington. “Effects of burial in sand and water supply regime on seedling emergence of six species”. Annals of
![Anticancer and anti-inflammatory activities of some new pyrazolo[3,4-b]pyrazines](data:image/gif;base64,R0lGODlhAQABAIAAAP///wAAACH5BAEAAAAALAAAAAABAAEAAAICRAEAOw==)