HAL Id: hal-03097440
https://hal.archives-ouvertes.fr/hal-03097440
Preprint submitted on 5 Jan 2021
HAL is a multi-disciplinary open access
archive for the deposit and dissemination of sci-entific research documents, whether they are pub-lished or not. The documents may come from teaching and research institutions in France or abroad, or from public or private research centers.
L’archive ouverte pluridisciplinaire HAL, est destinée au dépôt et à la diffusion de documents scientifiques de niveau recherche, publiés ou non, émanant des établissements d’enseignement et de recherche français ou étrangers, des laboratoires publics ou privés.
for oxygen uptake
F.R. Blasco, E.W. Taylor, C.A.C. Leite, D.A. Monteiro, F.T. Rantin, D.J.
Mckenzie
To cite this version:
F.R. Blasco, E.W. Taylor, C.A.C. Leite, D.A. Monteiro, F.T. Rantin, et al.. Tolerance of an acute warming challenge declines with body mass in Nile tilapia: evidence of a link to capacity for oxygen uptake. 2021. �hal-03097440�
1
Tolerance of an acute warming challenge declines with body mass in Nile
1
tilapia: evidence of a link to capacity for oxygen uptake
2 3
F.R. Blasco1,2, E.W. Taylor1,3, C.A.C. Leite1, D.A. Monteiro1, F.T. Rantin1 and D.J. 4
McKenzie1,4 5
6
1 Department of Physiological Sciences, Federal University of São Carlos, 13565-905, 7
São Carlos (SP), Brazil
8
2 Joint Graduate Program in Physiological Sciences, Federal University of São Carlos – 9
UFSCar/São Paulo State University, UNESP Campus Araraquara, 14801-903, Araraquara
10
SP, Brazil.
11
3 School of Biosciences, University of Birmingham, B15 2TT, UK. 12
4 MARBEC, Univ Montpellier, CNRS, Ifremer, IRD, 34095 Montpellier, France. 13
14 15
2
Abstract
16
It is proposed that larger individuals within fish species may be more sensitive to global
17
warming, due to limitations in their capacity to provide oxygen for aerobic metabolic
18
activities. This could affect size distributions of populations in a warmer world but
evi-19
dence is lacking. In Nile tilapia Oreochromis niloticus (n=18, mass range 21-313g),
ca-20
pacity to provide oxygen for aerobic activities (aerobic scope) was independent of
21
mass at acclimation temperature (26°C). Tolerance of acute warming, however,
de-22
clined significantly with mass when evaluated as critical temperature for fatigue from
23
aerobic swimming (CTswim). The CTswim protocol challenges a fish to meet the oxygen 24
demands of constant intense aerobic exercise while their demands for basal
metabo-25
lism are accelerated by incremental warming, culminating in fatigue. CTswim elicited 26
pronounced increases in oxygen uptake but maximum rates achieved prior to fatigue
27
declined very significantly with mass. Mass-related variation in CTswim and maximum 28
oxygen uptake rates were positively correlated, which may indicate a causal
relation-29
ship. When faced with acute thermal stress, larger fishes within populations may
be-30
come constrained in their ability to swim at lower temperatures than smaller
con-31
specifics. This could affect survival and fitness of larger fish in a world with more
fre-32
quent and extreme heatwaves, with consequences for population productivity.
33 34
3
Introduction
35
There is evidence that ongoing global warming is associated with a progressive decline
36
in final asymptotic body size in many fish species (Audzijonyte et al., 2020; Baudron et
37
al., 2014; Daufresne et al., 2009; Gardner et al., 2011). This phenomenon may have a
38
physiological mechanism, understanding this could improve the ability to predict
39
effects of future warming (Audzijonyte et al., 2019; Lefevre et al., 2017; Lefevre et al.,
40
2018). There has been major focus upon respiratory gas-exchange in relation to size
41
and temperature in fishes, because water is relatively poor in oxygen and meeting
42
requirements for aerobic metabolism can be challenging (Audzijonyte et al., 2019;
43
Cheung et al., 2011; Lefevre et al., 2017).
44
The Gill Oxygen Limitation (GOL) model proposes a physiological mechanism to
45
explain declining adult fish sizes. The model posits that, as fishes grow, gill respiratory
46
surface area declines in relation to body volume, due to surface to volume
47
relationships of spherical bodies. As fishes grow, therefore, their capacity to meet the
48
oxygen demands of their body volume, and hence body mass, would decrease
49
progressively. At a certain body size, the gills would only be able to meet the oxygen
50
requirements of basal metabolism. At that size, the fish would have no aerobic
51
metabolic scope (AS) to provide oxygen for aerobic activities, including anabolism, so
52
growth would no longer be possible (Cheung et al., 2011; Pauly, 1981). Fishes are
53
ectotherms so, when warmed, their metabolic rate and associated oxygen demand
54
increase (Fry, 1957; Fry, 1971). In the GOL model, increased basal metabolic demands
55
would cause the limitation in gill oxygen uptake capacity to occur at smaller maximum
56
sizes. The model has, consequently, been used to project widespread global declines in
57
fish size due to environmental warming (Cheung et al., 2011; Cheung et al., 2012; Pauly
58
and Cheung, 2017). Numerous major physiological precepts of the GOL model are not,
59
however, supported by current knowledge or data (Audzijonyte et al., 2019; Killen et
60
al., 2016; Lefevre et al., 2017).
61
Tolerance of acute warming does, nonetheless, decline with mass in some fish
62
species (Leiva et al., 2019; McKenzie et al., 2020). Although some studies have
63
considered whether size-dependent tolerance might be linked to capacity for oxygen
64
uptake (Christensen et al., 2020; Messmer et al., 2017), this remains to be tested
4
explicitly. This study represents an experimental test of the GOL model and the
66
potential effects of body mass on tolerance of acute warming in a teleost fish. The Nile
67
tilapia Oreochromis niloticus is a relatively eurythermal teleost (natural thermal range
68
14-33°C) that provides important fisheries in tropical and sub-tropical countries across
69
the globe (De Silva et al., 2004; Schofield et al., 2011). We performed a series of tests
70
on tilapia that ranged over one order of magnitude in body mass, to (1) how tolerance
71
of acute warming challenges varied with mass and (2) whether this could be related to
72
variation in capacity for oxygen uptake with mass.
73
In order better to interpret any effects of mass on thermal tolerance, we first
74
measured key traits of respiratory metabolism and performance at acclimation
75
temperature (26°C), by swimming respirometry. We then investigated effects of mass
76
on tolerance of warming using two thresholds. The critical thermal maximum (CTmax) 77
protocol is the standard method to evaluate tolerance, fish are warmed incrementally
78
and loss of equilibrium (LOE) is the tolerance endpoint (Beitinger and Lutterschmidt,
79
2011). The critical temperature for aerobic swimming (CTswim) protocol warms fish 80
incrementally while they perform intense steady aerobic exercise in a swimming
81
respirometer, with fatigue as tolerance endpoint (Blasco et al., 2020b). The CTswim 82
evaluates capacity for oxygen uptake because it challenges a fish to meet the
83
combined oxygen demands of aerobic exercise (constant metabolic load) plus
84
progressive warming (incremental metabolic load). Warming causes a progressive and
85
profound increase in oxygen uptake up to a maximum rate, where the fish transitions
86
to unsustainable anaerobic swimming that presages imminent fatigue (Blasco et al.,
87
2020b). We therefore investigated whether variation in CTswim with mass was 88
correlated with maximum oxygen uptake at fatigue, as evidence of a causal
89
relationship between the variables.
90
Material and Methods
91
Experimental animals came from populations of Nile tilapia of different size/age
92
classes, reared in recirculating biofiltered water at 25±1°C in multiple outdoor tanks
93
(vol. 1000L) at the Department of Physiological Sciences, UFSCar, São Carlos (SP),
94
Brazil. Individuals (n=18, mass range 20.6g to 313.0g) were selected in three sequential
95
groups of six relatively size-matched individuals, tagged for identification (PIT under
5
benzocaine anaesthesia) then recovered for at least 96h in an indoor tank (vol. 100L) in
97
the same biofiltered water system and with routine feeding. Animals were fasted 24h
98
prior to experimentation, and weighed prior to overnight recovery in an experimental
99
apparatus. Animals did not change mass between sequential tests. Experimental
100
protocols were approved by CEUA/UFSCAR, number CEUA 3927151016.
101
Metabolic and performance phenotype at acclimation temperature was
102
measured with a Steffensen-type swim-tunnel (volume 13.4L) supplied with vigorously
103
aerated, biofiltered water at 26±0.1°C, as described in (Blasco et al., 2020b). Briefly,
104
fish were placed in the tunnel and left overnight at a low swimming speed equivalent
105
to 1 bodylength⋅s-1 (BL⋅s-1, corrected for solid blocking effect) (Blasco et al., 2020b). The 106
following morning swimming speed was increased each 30 min in steps of either 1 BL
107
(mass range 20.6 to 86.5 g, n=12) or 0.5 BL (204 to 313 g, n=6), up to either 5 or 2.5
108
BL⋅s-1, respectively (Blasco et al., 2020a). All fish engaged steady aerobic body-caudal 109
swimming at all these speeds (Blasco et al., 2020b). Measurements of oxygen uptake
110
(M'O2, mmol⋅kg-1⋅h-1) were made by stopped-flow respirometry at each speed, to 111
derive standard metabolic rate (SMR) (Chabot et al., 2016) and active metabolic rate
112
AMR (Norin and Clark, 2016), and calculate AS as AMR-SMR (Blasco et al., 2020b).
113
Subsequently, the swimming speed was increased by 0.1 BL every 10s to identify gait
114
transition speed (UGT), where fish first engaged an unsteady anaerobic ‘burst-and 115
coast’ gait, which then increased in intensity until maximum swimming speed (Umax) 116
and fatigue (Blasco et al., 2020b; Marras et al., 2013). Speed was then immediately
117
reduced to 1 BL⋅s-1 and, after 30 min, fish were returned to a second holding tank for at 118
least 96h under normal rearing conditions, prior to testing thermal tolerance (50%
119
tested for CTswim or CTmax first). 120
CTmax was measured on groups of tilapia that had acclimated overnight in a 68L 121
tank containing vigorously aerated water at 26°C. The following morning, water was
122
warmed 1°C every 30 min until loss of equilibrium (LOE) (Blasco et al., 2020b).
123
Individual CTmax was then recorded as the highest temperature step fully completed 124
plus the proportion of the last step that the fish endured prior to LOE (25).
125
Immediately upon LOE, fish were recovered at 26°C for at least 30 min, in a 68L tank of
126
aerated water, then returned to a holding tank for at least 96h prior to further
6
experimentation.
128
For CTswim each individual recovered overnight in the swim-tunnel at 1 BL⋅s-1 129
then, the next day, speed was increased over 30 min until 85% of its own UGT (Blasco et 130
al., 2020b). After 30 min at that speed, temperature was increased by 1°C every 30 min
131
until fish fatigued, resting against the rear screen (Blasco et al., 2020b). The CTswim was 132
calculated as for CTmax but using fatigue as endpoint (Blasco et al., 2020b). The fish was 133
immediately placed in a recovery tank at 26°C for 30 min, then returned to holding
134
tank for at least 96h prior to further experimentation. Measurements of M'O2 were 135
made over the last 20 min at each temperature, the highest rate achieved was M'O2max 136
(Blasco et al., 2020b). Nile tilapia acclimated to 26°C can swim at a steady elevated
137
M'O2 without fatiguing for at least 9h at 85% of UGT, exceeding the duration of the 138
CTswim (Blasco et al., 2020b). 139
Statistics were performed with SigmaPlot 11. Relationships with body mass, of
140
metabolic, performance and tolerance variables, were assessed by least squares
141
regression of log-transformed data. Correlations between variables (CTmax vs CTswim; 142
CTswim vs M'O2max) were assessed by Pearson product-moment. Mean CTmax and CTswim 143
were compared by paired T-test. P<0.05 was the limit for statistical significance.
144
Results
145
At 26°C, log mass-specific SMR and AMR both showed a significant negative
146
relationship with log body mass (Table 1, Figure 1A). Log mass-specific AS did not
147
change with mass (Table 1, Figure 1A). Note that the negative slopes of these log:log
148
relationships for the metabolic variables (Table 1, Figure 1A) were the reciprocals of
149
the positive log:log slopes of mass independent scaling exponents for each variable
150
(Fig. S1, Electronic Supplementary Material). Log UGT and Umax both fell significantly 151
with mass but the difference between them (Umax-UGT), a potential indicator of 152
anaerobic swimming capacity, was independent of mass (Table 1).
153
As fish were warmed during CTmax they first exhibited erratic behaviour, rolling 154
sideways, followed by complete LOE. During CTswim, fish swam using a steady aerobic 155
gait up to a certain temperature, beyond which they progressively engaged unsteady
156
burst and coast anaerobic swimming that led to fatigue. No fish lost equilibrium during
157
CTswim; all fish from both protocols recovered normal swimming behaviour within 10 158
7
min at 26°C. The two thermal thresholds were not correlated (r=0.371, P=0.129) but
159
overall mean (± SEM) CTmax, at 40.7±0.23°C, was significantly higher than CTswim, at 160
38.1±0.29°C.
161
Log CTmax had no relationship with log body mass whereas log CTswim declined 162
significantly with mass (Figure 1B, Table 1). The decline in CTswim with mass was 163
associated with a highly significant negative log:log relationship between mass-specific
164
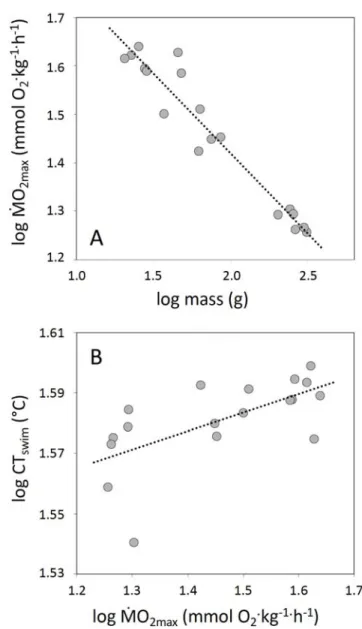
M'O2max and mass (Figure 2A, Table 1, see Figure S1 for the reciprocal allometric scaling 165
exponent). The M'O2max always occurred at the penultimate or ultimate temperature of 166
the CTswim except for one individual (mass 204g, see data in (Blasco et al., 2020a)). 167
There was a significant positive correlation between log M'O2max and log CTswim (Figure 168
2B).
169
Discussion
170
The results demonstrate that the ability to perform sustained aerobic exercise, while
171
being warmed (CTswim), declines significantly with body mass in a teleost fish. This 172
decline was significantly correlated with a decline in mass-specific M'O2max with mass, 173
suggesting a causal relationship. This decline in M'O2max with mass during the CTswim did 174
not reflect differences in AS at acclimation temperature; AS was independent of mass.
175
This latter finding is in direct opposition to the core precept of the GOL model, which
176
predicts that AS will decline with increasing size (Cheung et al., 2011; Pauly, 1981).
177
Nonetheless, there were declines in mass-specific SMR and AMR with mass at
178
acclimation temperature, which were a direct reflection of allometric mass scaling
179
relationships. These latter relationships occur in all fish species but their underlying
180
mechanisms remain a matter of debate (Glazier, 2020; Killen et al., 2010; Killen et al.,
181
2016).
182
The finding that CTmax did not decline with increasing body mass is consistent 183
with a previous study on Nile tilapia (Recsetar et al., 2012). In studies that have
184
investigated whether CTmax depends upon size in fishes, some report no effect but 185
others report a significant decline with size (McKenzie et al., 2020). The physiological
186
mechanisms underlying LOE at CTmax in fishes are unknown but it is notable that, when 187
there is a dependence upon size in post-larval fishes, it is consistently negative
188
(McKenzie et al., 2020). Given the absence of any dependence of CTmax upon mass, it 189
8
was interesting to find such a strong negative dependence of CTswim. 190
It is intriguing that M'O2max declined so profoundly with body mass during 191
CTswim, if we assume that it represents the maximum capacity for oxygen uptake during 192
acute warming (Blasco et al., 2020b). The significant correlation of M'O2max with CTswim 193
is evidence that capacity for oxygen uptake is a mechanism underlying
size-194
dependence of CTswim. This is worthy of further investigation. The fact that size-related 195
variation in M'O2max only accounted for about 60% of the variation in CTswim indicates, 196
however, that other mechanisms must also contribute to fatigue. The tilapia engaged
197
unsustainable anaerobic swimming prior to fatiguing (Blasco et al., 2020b) and capacity
198
for anaerobic exercise varies among individuals in fish species (Marras et al., 2010;
199
Marras et al., 2013). At acclimation temperature, both UGT and Umax fell significantly 200
against mass, because mass was related to length in the tilapia (Blasco et al., 2020a)
201
and relative swimming performance declines with length in most fish species
202
(Bainbridge, 1958; Beamish, 1978). If the difference between them (Umax-UGT) is 203
considered an indicator of anaerobic metabolic capacity in fishes (Marras et al., 2013),
204
this was independent of mass.
205
The decline in M'O2max with mass presumably reflects, in some degree, the size-206
related constraints on mass-specific oxygen uptake capacity, AMR, at acclimation
207
temperature. Such constraints were rendered very visible by the profound challenge to
208
oxygen uptake that the CTswim protocol imposed. Interestingly, the scaling exponent (1-209
b) for the decline in log mass-specific M'O2max with log mass, of -0.33, is exactly the 210
exponent that the GOL model posits for the decline in capacity for oxygen uptake as a
211
function of mass in fishes, based upon surface to volume geometric constraints
212
(Cheung et al., 2011; Cheung et al., 2012; Glazier, 2020; Pauly, 1981). In the tilapia, a
213
regression coefficient of 0.92 on 18 fish indicates that estimated mass exponents are
214
unlikely to be spurious. One constraint revealed by CTswim may be gill functional 215
respiratory surface area, which declines with mass in Nile tilapia with an exponent of
-216
0.30 (Kisia and Hughes, 1992). This decline in gill surface area with mass may be linked
217
to the decline in mass-specific SMR, whereby basal metabolic costs decline and the fish
218
gills are then ‘tailored’ to maintain a constant AS at any given mass, as observed in this
219
study. Maintaining a greater gill respiratory surface area than is needed for AS, at any
9
given acclimation temperature, could have costs in terms of, for example, regulating
221
water and ion balance (Lefevre et al., 2017; Taylor, 1998). There may be other surface
222
to volume constraints that emerge as fishes grow and this is an interesting topic for
223
further study, including on other fish species.
224
Extreme warming events are predicted to increase in frequency and severity in
225
aquatic habitats worldwide due to accelerating global climate change (Field et al.,
226
2012; Frölicher et al., 2018; Stillman, 2019). Swimming is an essential activity for most
227
fishes, including Nile tilapia, so there are clear ecological implications to the fact that, if
228
their populations experience an acute warming event, the ability of larger fishes to
229
swim aerobically would be constrained at lower temperatures than that of smaller
230
conspecifics. The law of averages would predict that larger fishes are more likely to
231
encounter temperatures sufficiently warm to limit their performance (Field et al.,
232
2012; Stillman, 2019). Therefore, stochastic extreme warming events could threaten
233
fitness and survival of fishes in a size-dependent manner, including by limiting the
234
ability of larger individuals to seek thermal refuges (Habary et al., 2017; Stillman,
235
2019). If fitness and survival of larger animals is compromised more frequently, this
236
could have important consequences for Nile tilapia fisheries, an important source of
237
dietary protein in many countries (De Silva et al., 2004).
238
Overall, the data indicate that global warming could indeed ‘favour the small’
239
for fishes (Daufresne et al., 2009). Further work is required to understand if this
size-240
dependence in temperature tolerance might be linked to ongoing declines in
241
maximum body size of fishes globally (Audzijonyte et al., 2019; Baudron et al., 2014;
242
Daufresne et al., 2009). The rate of global warming is too fast for adaptive evolutionary
243
responses by most fish species, so survival and resilience will depend upon the options
244
for migration, the prevailing plasticity in tolerance, and the existence of tolerant
245
genotypes (Bell, 2013; Gunderson and Stillman, 2015; Habary et al., 2017; Stillman,
246
2019). The current data indicate that capacity for migration is more likely to be
247
impaired in larger fish, and that smaller animals are more tolerant. The potential
248
downstream consequences, for future populations, may indeed be a decline in
249
maximum body size.
250
Acknowledgements
10
We are grateful to Cesar Polettini, of Piscicultura Polettini, for donating the tilapia.
252
Funding Statement
253
FRB was supported by a doctoral bursary from Coordenação de Aperfeiçoamento de
254
Pessoal de Nível Superior (CAPES).
255
References
256
Audzijonyte, A., Barneche, D. R., Baudron, A. R., Belmaker, J., Clark, T. D., Marshall,
257
C. T., Morrongiello, J. R. and van Rijn, I. (2019). Is oxygen limitation in warming
258
waters a valid mechanism to explain decreased body sizes in aquatic ectotherms?
259
Glob. Ecol. Biogeogr. 28, 64–77.
260
Audzijonyte, A., Richards, S. A., Stuart-Smith, R. D., Pecl, G., Edgar, G. J., Barrett, N.
261
S., Payne, N. and Blanchard, J. L. (2020). Fish body sizes change with temperature
262
but not all species shrink with warming. Nat. Ecol. Evol. 1, 1–6.
263
Bainbridge, R. (1958). The speed of swimming of fish as related to size and to the
264
frequency and amplitude of the tail beat. J. Exp. Biol. 35, 109–133.
265
Baudron, A. R., Needle, C. L., Rijnsdorp, A. D. and Tara Marshall, C. (2014). Warming
266
temperatures and smaller body sizes: Synchronous changes in growth of North
267
Sea fishes. Glob. Chang. Biol. 20, 1023–1031.
268
Beamish, F. W. H. (1978). Swimming capacity. In Fish Physiology Volume 7 (ed. Hoar,
269
W. S.) and Randall, D. J.), pp. 101–187. New York: Academic Press.
270
Beitinger, T. and Lutterschmidt, W. (2011). Temperature| Measures of thermal
271
tolerance. In Encyclopedia of Fish Physiology: From Genome to Environment (ed.
272
Farrell, A. P.), pp. 1695–1702. Elsevier Ltd.
273
Bell, G. (2013). Evolutionary rescue and the limits of adaptation. Philos. Trans. R. Soc. B
274
Biol. Sci. 368,.
275
Blasco, F. R., Taylor, E. W., Leite, C. A. C., Monteiro, D. A., Rantin, F. T. and McKenzie,
276
D. J. (2020a). Data from: Tolerance of an acute warming challenge declines with
277
size in Nile tilapia: evidence of a link to capacity for oxygen uptake. Dryad Digital
278
Repository.
279
Blasco, F. R., Esbaugh, A. J., Killen, S., Rantin, F. T., Taylor, E. W. and McKenzie, D. J.
280
(2020b). Using aerobic exercise to evaluate sub-lethal tolerance of acute warming
281
in fishes. J. Exp. Biol. 223, jeb218602.
11
Chabot, D., Steffensen, J. F. and Farrell, A. P. (2016). The determination of standard
283
metabolic rate in fishes. J. Fish Biol. 88, 81–121.
284
Cheung, W. W. L., Dunne, J., Sarmiento, J. L. and Pauly, D. (2011). Integrating
285
ecophysiology and plankton dynamics into projected maximum fisheries catch
286
potential under climate change in the Northeast Atlantic. ICES J. Mar. Sci. 68,
287
1008–1018.
288
Cheung, W. W. L., Sarmiento, J. L., Dunne, J., Frölicher, T. L., Lam, V. W. Y., Deng
289
Palomares, M. L., Watson, R. and Pauly, D. (2012). Shrinking of fishes
290
exacerbates impacts of global ocean changes on marine ecosystems. Nat. Clim.
291
Chang. 2, 1–5.
292
Christensen, E. A. F., Svendsen, M. B. S. and Steffensen, J. F. (2020). The combined
293
effect of body size and temperature on oxygen consumption rates and the
294
size-dependency of preferred temperature in European perch Perca fluviatilis. J.
295
Fish Biol. jfb.14435.
296
Daufresne, M., Lengfellner, K. and Sommer, U. (2009). Global warming benefits the
297
small in aquatic ecosystems. Proc. Natl. Acad. Sci. U. S. A. 106, 12788–12793.
298
De Silva, S. S., Subasinghe, R. P., Bartley, D. M. and Lowther, A. (2004). Tilapias as
299
alien aquatics in Asia and the Pacific: A Review. FAO Fish. Tech. Pap. 453 65.
300
Field, C. B., Barros, V., Stocker, T. F., Dahe, Q., Jon Dokken, D., Ebi, K. L.,
301
Mastrandrea, M. D., Mach, K. J., Plattner, G. K., Allen, S. K., et al. (2012).
302
Managing the risks of extreme events and disasters to advance climate change
303
adaptation: Special Report of the Intergovernmental Panel on Climate Change.
304
Cambridge and New York: Cambridge University Press.
305
Frölicher, T. L., Fischer, E. M. and Gruber, N. (2018). Marine heatwaves under global
306
warming. Nature 560, 360–364.
307
Fry, F. E. J. (1957). The aquatic respiration of fish. In The Physiology of Fishes Volume 1
308
(ed. Brown, M. E.), pp. 1–63. New York: Academic Press.
309
Fry, F. E. J. (1971). The Effect of Environmental Factors on the Physiology of Fish. In
310
Fish Physiology Volume 6 (ed. Hoar, W. S.) and Randall, D. J.), pp. 1–98. New York:
311
Academic Press.
312
Gardner, J. L., Peters, A., Kearney, M. R., Joseph, L. and Heinsohn, R. (2011). Declining
12
body size: A third universal response to warming? Trends Ecol. Evol. 26, 285–291.
314
Glazier, D. S. (2020). Activity alters how temperature influences intraspecific metabolic
315
scaling: testing the metabolic-level boundaries hypothesis. J. Comp. Physiol. B
316
Biochem. Syst. Environ. Physiol. 190, 445–454.
317
Gunderson, A. R. and Stillman, J. H. (2015). Plasticity in thermal tolerance has limited
318
potential to buffer ectotherms from global warming. Proc. R. Soc. B Biol. Sci. 282,
319
20150401.
320
Habary, A., Johansen, J. L., Nay, T. J., Steffensen, J. F. and Rummer, J. L. (2017).
321
Adapt, move or die – how will tropical coral reef fishes cope with ocean warming?
322
Glob. Chang. Biol. 23, 566–577.
323
Killen, S. S., Atkinson, D. and Glazier, D. S. (2010). The intraspecific scaling of
324
metabolic rate with body mass in fishes depends on lifestyle and temperature.
325
Ecol. Lett. 13, 184–193.
326
Killen, S. S., Glazier, D. S., Rezende, E. L., Clark, T. D., Atkinson, D., Willener, A. S. T.
327
and Halsey, L. G. (2016). Ecological Influences and Morphological Correlates of
328
Resting and Maximal Metabolic Rates across Teleost Fish Species. Am. Nat. 187,
329
592–606.
330
Kisia, S. M. and Hughes, G. M. (1992). Estimation of oxygen-diffusing capacity in the
331
gills of different sizes of a tilapia, Oreochromis niloticus. J. Zool. 227, 405–415.
332
Lefevre, S., McKenzie, D. J. and Nilsson, G. E. (2017). Models projecting the fate of fish
333
populations under climate change need to be based on valid physiological
334
mechanisms. Glob. Chang. Biol. 23, 3449–3459.
335
Lefevre, S., McKenzie, D. J. and Nilsson, G. E. (2018). In modelling effects of global
336
warming, invalid assumptions lead to unrealistic projections. Glob. Chang. Biol.
337
24, 553–556.
338
Leiva, F. P., Calosi, P. and Verberk, W. C. E. P. (2019). Scaling of thermal tolerance with
339
body mass and genome size in ectotherms: A comparison between water- And
340
air-breathers. Philos. Trans. R. Soc. B Biol. Sci. 374,.
341
Marras, S., Claireaux, G., McKenzie, D. J. and Nelson, J. A. (2010). Individual variation
342
and repeatability in aerobic and anaerobic swimming performance of European
343
sea bass, Dicentrarchus labrax. J. Exp. Biol. 213, 26–32.
13
Marras, S., Killen, S. S., Domenici, P., Claireaux, G. and McKenzie, D. J. (2013).
345
Relationships among Traits of Aerobic and Anaerobic Swimming Performance in
346
Individual European Sea Bass Dicentrarchus labrax. PLoS One 8, e72815.
347
McKenzie, D. J., Zhang, Y., Eliason, E. J., Schulte, P. M., Blasco, F. R., Claireaux, G.,
348
Nati, J. J. H. and Farrell, A. P. (2020). Intraspecific variation in tolerance of
349
warming in fishes. J. Fish Biol. doi.org/10.1111/jfb.14620.
350
Messmer, V., Pratchett, M. S., Hoey, A. S., Tobin, A. J., Coker, D. J., Cooke, S. J. and
351
Clark, T. D. (2017). Global warming may disproportionately affect larger adults in
352
a predatory coral reef fish. Glob. Chang. Biol. 23, 2230–2240.
353
Norin, T. and Clark, T. D. (2016). Measurement and relevance of maximum metabolic
354
rate in fishes. J. Fish Biol. 88, 122–151.
355
Pauly, D. (1981). The relationships between gill surface area and growth performance
356
in fish: a generalization of von Bertalanffy’s theory of growth. Berichte der Dtsch.
357
Wissenchaftlichen Kommission fur Meeresforsch. 28, 32.
358
Pauly, D. and Cheung, W. W. L. (2017). Sound physiological knowledge and principles
359
in modeling shrinking of fishes under climate change. Glob. Chang. Biol. 24, e15–
360
e26.
361
Recsetar, M. S., Zeigler, M. P., Ward, D. L., Bonar, S. A. and Caldwell, C. A. (2012).
362
Relationship between fish size and upper thermal tolerance. Trans. Am. Fish. Soc.
363
141, 1433–1438.
364
Schofield, P. J., Peterson, M. S., Lowe, M. R., Brown-Peterson, N. J. and Slack, W. T.
365
(2011). Survival, growth and reproduction of non-indigenous Nile tilapia,
366
Oreochromis niloticus (Linnaeus 1758). I. Physiological capabilities in various
367
temperatures and salinities. Mar. Freshw. Res. 62, 439.
368
Stillman, J. H. (2019). Heat waves, the new normal: Summertime temperature
369
extremes will impact animals, ecosystems, and human communities. Physiology
370
34, 86–100.
371
Taylor, E. W. (1998). Gills of water-breathers: Structures with multiple functions. In
372
Principles of Animal Design: The Optimisation and Symmorphosis Debate (ed.
373
Weibel, E. R.), Taylor, C. R.), and Bolis, C. L.), pp. 186–194. Cambridge: Cambridge
374
University Press.
14
Figure 1. Least squares regression of the log:log relationship between (A) body mass
376
and mass-specific metabolic rate (MR) variables, standard metabolic rate (purple
377
symbols, dotted line), active metabolic rate (blue symbols, dashed line) and aerobic
378
metabolic scope (red symbols); and (B) body mass and two critical temperatures (CT)
379
for tolerance, critical thermal maximum (green symbols) and critical temperature for
380
fatigue from swimming (yellow symbols, dotted line). Data are for n = 18 Nile tilapia,
381
mass range 21 to 313g, acclimated to 26°C. Regression lines are for variables where
382
relationship is significant, lines denote best fit, see Table 1.
383
15
Figure 2. (A) Least squares regression of the log:log relationship between body mass
385
and mass-specific maximum rate of oxygen uptake achieved during CTswim (M'O2max, see 386
Table 1 for regression information) and (B) Pearson correlation between critical
387
temperature for fatigue from swimming (CTswim) and M'O2max, dotted line is described 388
by log CTswim = (log M'O2max) x 0.061 + 1.491 (r = 0.637, P = 0.004). Data are for n = 18 389
Nile tilapia, mass range 21 to 313g, acclimated to 26 °C.
390