HAL Id: hal-01574831
https://hal.inria.fr/hal-01574831
Submitted on 16 Aug 2017
HAL is a multi-disciplinary open access
archive for the deposit and dissemination of
sci-entific research documents, whether they are
pub-lished or not. The documents may come from
teaching and research institutions in France or
abroad, or from public or private research centers.
L’archive ouverte pluridisciplinaire HAL, est
destinée au dépôt et à la diffusion de documents
scientifiques de niveau recherche, publiés ou non,
émanant des établissements d’enseignement et de
recherche français ou étrangers, des laboratoires
publics ou privés.
Fibrillation Using Shape Parameterization and Partial
Least Squares Regression
Shuman Jia, Claudia Camaioni, Marc-Michel Rohé, Pierre Jaïs, Xavier
Pennec, Hubert Cochet, Maxime Sermesant
To cite this version:
Shuman Jia, Claudia Camaioni, Marc-Michel Rohé, Pierre Jaïs, Xavier Pennec, et al.. Prediction of
Post-Ablation Outcome in Atrial Fibrillation Using Shape Parameterization and Partial Least Squares
Regression. FIMH 2017 - International Conference on Functional Imaging and Modeling of the Heart,
Jun 2017, Toronto, Canada. pp.314 - 321, �10.1007/978-3-319-59448-4_30�. �hal-01574831�
Fibrillation Using Shape Parameterization and
Partial Least Squares Regression
Shuman Jia1⋆, Claudia Camaioni2, Marc-Michel Rohé1, Pierre Jaïs2, Xavier Pennec1, Hubert Cochet2, and Maxime Sermesant1
1 Université Côte d’Azur, Asclepios Research Group, Inria, Sophia Antipolis, France 2 IHU Liryc, University of Bordeaux, Pessac, France
Abstract. To analyze left atrial remodeling may reveal shape features
related to post-ablation outcome in atrial fibrillation, which helps in identifying suitable candidates before ablation. In this article, we propose an application of diffeomorphometry and partial least squares regression to address this problem. We computed a template of left atrial shape in control group and then encoded the shapes in atrial fibrillation with a large set of parameters representing their diffeomorphic deformation. We applied a two-step partial least squares regression. The first step eliminates the influence of atrial volume in shape parameters. The second step links deformations directly to post-ablation recurrence and derives a few principle modes of deformation, which are unrelated to volume change but are involved in post-ablation recurrence. These modes contain information on ablation success due to shape differences, resulting from remodeling or influencing ablation procedure. Some details are consistent with the most complex area of ablation in clinical practice. Finally, we compared our method against the left atrial volume index by quantifying the risk of post-ablation recurrence within six months. Our results show that we get better prediction capabilities (area under receiver operating characteristic curves 𝐴𝑈𝐶 = 0.73) than left atrial dilation (𝐴𝑈𝐶 = 0.47), which outperforms the current state of the art.
Keywords: atrial fibrillation, catheter ablation, post-ablation outcome,
left atrial remodeling, statistical shape analysis, partial least squares regression.
1 Introduction
Atrial fibrillation (AF) is the most common type of cardiac arrhythmia [1], char-acterized by uncoordinated electrical activation and disorganized contraction of the atria. This condition is associated with life-threatening consequences, such as stroke and heart failure. Catheter ablation is an effective treatment for AF and may be recommended for drug refractory patients. Yet, for 30% of patients, AF redevelops, resulting in repeated interventions and higher risk.
In order to optimize the planning of AF treatment, a number of studies have been looking into predictors of recurrent arrhythmia. Previous studies reported that hypertension, Holter duration, left atrial (LA) volume and LA sphericity [2,3,4,5] were potentially related to post-ablation recurrence, but their underlying mechanism is still unclear, as is LA remodeling in AF.
In this exploratory work, we focus on shape variations as predictors. By studying principal deformation modes associated with a higher post-ablation recurrence rate, we expect to find cartographic/regional criteria that will help us stratify the risk of post-ablation recurrence. So far, LA volume index (LAVI) has been the only clinically accessible and reproductive index for identifying suitable candidates for ablation. However, its relation to post-ablation outcome has been constantly reported to be weak [6]. We therefore decided to explore shape features that are more comprehensive than LAVI. For example, using maps of the deformation modes, we can visualize both regional and global shape variations, both of which may indicate potential for recurrence.
Unlike in [7], we decided to quantify anatomical variability using a registra-tion approach based on diffeomorphism. This allows for finer shape variaregistra-tions to be captured without the need for pre-defined markers. In statistical analysis, we used partial least squares (PLS) regression rather than principal component analysis (PCA) since PLS regression recognizes the components that are directly linked to recurrence. We included a two-step regression to compare shape fea-tures and volume index. Finally, we used computed tomography (CT) to ensure detailed and accurate anatomical descriptions.
2 Methods and Experiments
2.1 Data Preparation
Population 40 paroxysmal AF (PAF) patients were studied. They had no
pre-vious ablation at the time of imaging. Average age was 59 ± 11 years old and 31/40 of the patients are male. Post-ablation recurrence within six months was observed in 13/40 patients. Meanwhile, we chose 24 control subjects without significant difference in age or gender from the PAF group.
Image Acquisition All subjects were imaged before catheter ablation using a
64-slice Siemens SOMATOM CT scanner [8]. Multi-detector CT was performed, during the intravenous injection of iodinated contrast agent. The scans were ECG-gated for acquisition window to occur at end-systole, when LA motion is minimal. Temporal resolution was 66 𝑚𝑠. The trans-axial images were acquired with a slice thickness of 0.5 𝑚𝑚 and reconstructed with a voxel size of 0.5 × 0.4 × 0.4 𝑚𝑚3. The protocol of this study was approved by the local research ethics committee.
Endocardium Segmentation We segmented the LA endocardium from CT images
using a region growing algorithm, as described in [9]. Semi-automatically drawn polygons isolated the left atrium and served as the boundary for succedent region
growing process. A patient-specific intensity threshold, computed from tissue sampling, controlled the growing of blood pool during the iteration process until it touched the frontier of the endocardium. Pulmonary veins were cut several centimetres from the ostia. Based directly on image intensity, our segmentation can achieve high accuracy with such contrast CT, as well as identify PVs with several kinds of anatomies3.
Mesh Generation Next, we generated 3D volume tetrahedral meshes of the LA
relaying on restricted Delaunay triangulation [11]4. Range for size and angle of mesh elements were controlled via input parameters. To meet the requirements of implementation, we extracted surface triangular meshes of the LA from the volume meshes.
2.2 Quantification of Shape Variations
We encoded LA shape by deformation parameters in this step, adopting diffeo-morphometry. The term was introduced recently and refers to the comparison of shapes and forms using a metric structure based on diffeomorphism. Meth-ods under this framework have been proven to be efficient to qualify anatomical configurations and their differences for computational anatomy studies [12].
Mathematical currents, varifold metric, diffeomorphism First, the shape
𝑆 was represented by flux of 3D vector field/current 𝑤 across the surface, that belongs to a Gaussian reproducing kernel Hilbert space (RKHS) 𝑊 with kernel 𝐾𝑤. The current 𝑤 was parameterized by a set of ⃗𝛿𝑐𝑘, attached to distinct points on surface 𝑆.
Then, the deformation 𝜙 was estimated using the large deformation diffeo-morphic metric mapping (LDDMM) on surface, characterized by initial velocity
⃗
𝑣0. The velocity vector belongs to a Gaussian RKHS 𝑉 with kernel 𝐾𝑉, and was weighted by a set of moment vectors ⃗𝛼𝑐𝑘. Unless otherwise stated, {𝑐𝑘}𝑘=1,...,𝑁𝑐𝑝 refers to the control points of deformation in the following text. At point 𝑥, velocity 𝑣(𝑥) = 𝑁𝑐𝑝 ∑ 𝑘=1 𝐾𝑉(𝑥, 𝑐𝑘) ⃗𝛼𝑐 𝑘. (1)
Thus, for patient #𝑖, the surface 𝑆𝑖 could be represented as the sum of deformed template 𝑇 and some residuals 𝜖𝑖, as
𝑆𝑖 = 𝜙𝑖𝑇 + 𝜖𝑖. (2)
For registration, we minimized the residuals 𝜖, in other words, the distance between 𝑆𝑖 and 𝜙𝑖𝑇 . For atlas construction, we minimized the sum of distances
3 We used the MUSIC software for endocardium segmentation [10].
4 We used CGAL 3D mesh generation algorithm http://http://doc.cgal.org/
from the template to every mesh, resulting in a Fréchet mean of shape complex, 𝑇 = arg min 𝑇 ∈𝑊 ∑ 𝑖 𝑑2 𝑊(𝑇 , 𝑆𝑖). (3)
The template and the deformations were estimated simultaneously.
In order to be independent of the surface orientation, the distance between surface meshes was defined based on varifold metric [13] as
𝑑𝑊(𝑆, 𝑆′)2= ||𝑆 − 𝑆′||2𝑊∗= ⟨𝑆, 𝑆⟩𝑊∗+ ⟨𝑆′, 𝑆′⟩𝑊∗+ ⟨𝑆, 𝑆′⟩𝑊∗ (4a) with ⟨𝑆, 𝑆′⟩ 𝑊∗= ∑ 𝑝 ∑ 𝑞 𝐾𝑊(𝑐𝑝, 𝑐′ 𝑞) (𝑛𝑇 𝑝𝑛′𝑞)2 |𝑛𝑇 𝑝||𝑛′𝑞| (4b) where 𝑐 (resp. 𝑐′) refers to control points on surface 𝑆 (resp. 𝑆′) and 𝑛 (resp. 𝑛′) denotes normals related to controls points.
The line search strategy was used in optimization process. More details can be found in [14].
Remodeling A rigid alignment of all meshes was performed in the first place,
to reduce the impact of different origin in CT images. Iterative closest point algorithm was applied to calculate an optimized rigid registration in the least square sense.
Using methods described above, we computed a 3D template of the LA shape in the control group. The template offered a reference for anatomical invariant. Then, we warped this template towards each mesh of PAF patients and calcu-lated its deformation moments. We illustrate the process in Fig. 1(a)5.
Deformations were parameterized as moment vectors ⃗𝛼𝑐
𝑘attached to a same set of control points on the template for all patients. We use 𝑴𝑖 to represent the deformation moments for patient #𝑖
𝑴𝑖= [ ⃗𝛼 𝑖 𝑐1 𝛼⃗ 𝑖 𝑐2 ⋯ ⃗𝛼 𝑖 𝑐𝑘 ⋯ ⃗𝛼 𝑖 𝑐𝑁𝑐𝑝] 𝑇 , (5) where 𝛼⃗𝑖 𝑐𝑘 = [ 𝛼 𝑖 𝑐𝑘1𝛼 𝑖 𝑐𝑘2𝛼 𝑖 𝑐𝑘3] 𝑇
is the deformation moment vector associated with control point #𝑘 for patient #𝑖; 𝑁𝑐𝑝 is the total number of control points. Kernel width parameters were set as: varifold kernel width 𝜎𝑊 = 10 𝑚𝑚 and deformation kernel width 𝜎𝑉 = 10 𝑚𝑚, ensuring respectively a suitable scale of shape variations and deformation to capture. 𝑁𝑐𝑝= 3952 control points were placed near most variable parts on the template and helped in representing shape differences between the template and the meshes of PAF patients. With chosen parameters, atlas estimation and pairwise registration were performed efficiently with surfaces, as shown in Fig. 1(b).
5 Atlas estimation and registration have been integrated in the Deformetrica software
… …
Template
Control Subjects AF Patients
(a) (b)
Fig. 1. Extraction of remodeling information vs. controls. (a) reference for atrial
re-modeling offered by control subjects; (b) the template in blue, before and after warping in a registration process toward the target in orange.
Whitening transform Then, we used whitening transform to reduce the
cor-relation between the deformation moments.
According to Eq. 1, the norm of the velocity vector for patient #𝑖 ‖𝑣𝑖‖2= [ ⃗𝛼𝑖 𝑐1 𝛼⃗ 𝑖 𝑐2⋯ ⃗𝛼 𝑖 𝑐𝑁𝑐𝑝] 𝑲 [ ⃗𝛼𝑖𝑐1 𝛼⃗ 𝑖 𝑐2 ⋯ ⃗𝛼 𝑖 𝑐𝑁𝑐𝑝] 𝑇 = 𝑴𝑇 𝑖 𝑲𝑴𝑖, (6) where 𝑲 is a positive definite matrix that defined a metric, with its blocks 𝐾𝑖𝑗 = 𝐾𝑉(𝑐𝑖, 𝑐𝑗) ⨂ 𝟙3. We used the Gaussian kernel 𝐾𝑉(𝑥, 𝑦) = 𝑒𝑥𝑝(−|𝑥−𝑦|2
𝜎2 𝑉
). Since the velocity vector 𝑣 belongs to a RKHS space, the whitened moment 𝑲1/2𝑴
𝑖 belongs to the Euclidean space with 𝐿2norm. This allows us to apply seamlessly standard statistical methods like PLS.
We arranged the whitened deformation moments 𝑲1/2𝑴
𝑖 into a matrix as
𝜦 = [ ⃗𝜆1𝜆⃗2⋯ ⃗𝜆𝑖⋯ ⃗𝜆𝑁𝑝]
𝑇
, (7)
where ⃗𝜆𝑖 is a column vector that contains all the elements in 𝑲1/2𝑴𝑖; 𝑁𝑝 = 40 is the total number of patient. Thus, the dimension of 𝜦 turns out to be 𝑁𝑝× (3𝑁𝑐𝑝).
To sum up, modeling complex geometries with mathematical currents avoided using pre-defined markers, and therefore has the potential to summarize any shape feature related to certain clinical factors. The finite dimensional approxi-mation of shape as deforapproxi-mation moments was robust to detect subtle anatomical differences. Finally, whitening transform reduced the correlation due to the ker-nel metric and constructed a 𝐿2 space for statistical analysis.
2.3 Statistical Modeling
PLS regression combines PCA with linear regression by projecting inputs 𝑿 and 𝒀 to a new space. 𝑿 is a 𝑛×𝑚 matrix of 𝑚 predictors for 𝑛 observations, and 𝒀 is a 𝑛 × 𝑤 matrix of 𝑤 response variables for 𝑛 observations. It relates predictors directly to response variables by finding multidimensional directions in 𝑋 that explain the maximum variance in 𝑌 . Here, we use same notations as the tutorial [15].
We chose PLS regression so as to find the principle dimensions in deformation parameters that correlate with post-ablation recurrence.
Dependency analysis with left atrial volume In the first PLS regression,
the whitened deformation parameters were considered as predictors, while the LAVI was considered as response variable, as
𝑿 = 𝜦 and 𝑌 = [ 𝐿𝐴𝑉 𝐼1𝐿𝐴𝑉 𝐼2⋯ 𝐿𝐴𝑉 𝐼𝑖⋯ 𝐿𝐴𝑉 𝐼𝑁𝑝]
𝑇 ,
where 𝜦 is defined in Eq. 7; 𝐿𝐴𝑉 𝐼 was calculated for each subject as 𝐿𝐴𝑉 𝐼 = 𝑉𝐿𝐴/𝐵𝑆𝐴, based on the size of the atrium 𝑉𝐿𝐴 in units of 𝑚𝐿 and the body surface area 𝐵𝑆𝐴 in units of 𝑚2.
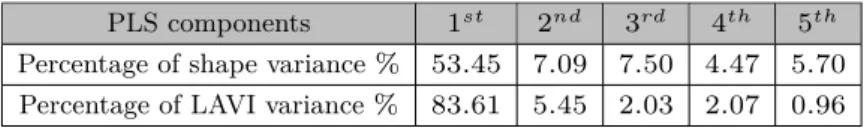
According to the percentage of variance explained shown in Table 1, the first mode spanned an optimal subspace that explained 84.61% of LAVI variance for the population under study. It was expected that this principle mode of variation would be linked to volume change. To analyze shape features which are comple-mentary to the atrial size, we subtracted, for every patient, the components in deformation projected on this mode, as
𝜦′ = 𝑿 − 𝑻 (∶ , 1)𝑷 (∶, 1)𝑇, (8)
where 𝜦′ is the matrix of volume-reduced deformation parameters; 𝑻 (∶ , 1) is the first column of X score matrix 𝑻 ; 𝑷 (∶ , 1) is the first column of X loading matrix 𝑷 , referring to the first PLS component of deformation related to LAVI.
Table 1. Percentage of variance explained in the first partial least squares regression,
for shape and left atrial volume index respectively.
PLS components 1𝑠𝑡 2𝑛𝑑 3𝑟𝑑 4𝑡ℎ 5𝑡ℎ
Percentage of shape variance % 53.45 7.09 7.50 4.47 5.70 Percentage of LAVI variance % 83.61 5.45 2.03 2.07 0.96
We therefore created a new matrix of deformation parameters that were not linearly related to LA volume change.
Correlation with post-ablation recurrence In the second PLS regression,
we studied the correlation between atrial shape and post-ablation recurrence, ap-plying discriminant analysis and leave-one-out prediction. The volume-reduced deformation parameters were considered as predictors, while the post-ablation outcome within six months was considered as response variable.
For patient #𝑖, PLS regression was performed among all the other patients as
𝑿 = 𝜦′([1 ∶ 𝑖 − 1, 𝑖 + 1 ∶ 𝑒𝑛𝑑], ∶) 𝑌 = [ 𝑅1𝑅2⋯ 𝑅𝑖−1𝑅𝑖+1⋯ 𝑅𝑁𝑝]
𝑇 , where 𝜦′was computed based on Eq. 8; 𝑅
𝑖represents the post-ablation outcome within six months for patient #𝑖, with 𝑅𝑖 = 1 standing for with recurrence, 𝑅𝑖 = 0 without recurrence.
Then, we projected the deformation parameters of patient #𝑖 on the subspace constructed by the first 𝑛 PLS components, to calculate a predicted response for this new observation
𝑆𝐼𝑖= 𝜦′(𝑖, ∶)𝑷 (∶, 1 ∶ 𝑛)𝑩(1 ∶ 𝑛, 1 ∶ 𝑛)𝑸(∶, 1 ∶ 𝑛)𝑇, (9) where 𝜦′(𝑖, ∶) is the volume-reduced deformation parameters for patient #𝑖; 𝑷 refers to the X loading matrix; 𝑩 is the diagonal matrix of coefficients 𝑏ℎ; 𝑸 is the Y loading matrix.
We repeated the leave-one-out regression and prediction, and thus obtained shape indices for every patient {𝑆𝐼𝑖}𝑖=1,2,...𝑁
𝑝which qualified their potential for recurrence.
3 Results
We present here the first three modes of deformation, with a higher signal-to-noise ratio, and their prediction capabilities. Beyond the third mode, components may be dominated by noise, since the percentage of variance explained by them was smaller than half of the gap between the percentage of variance explained by previous two successive modes. The percentage of variance explained is shown in Table 2.
Table 2. Percentage of variance explained in the second partial least squares regression,
for shape and post-ablation recurrence respectively.
PLS components 1𝑠𝑡 2𝑛𝑑 3𝑟𝑑 4𝑡ℎ 5𝑡ℎ
Percentage of shape variance % 21.44 9.02 14.30 9.71 5.69 Percentage of recurrence variance % 27.47 18.09 5.67 3.98 3.95
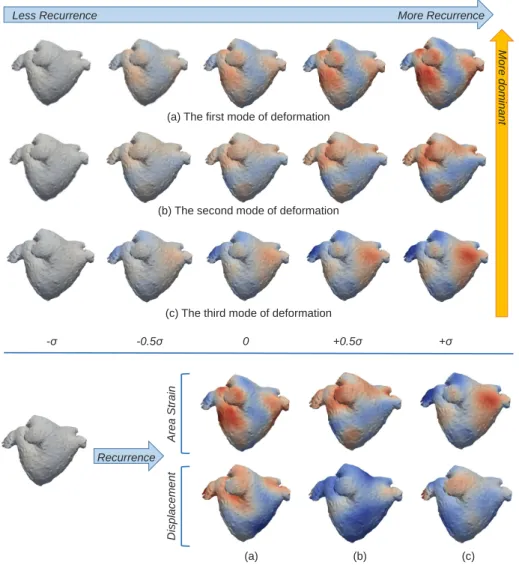
The principle modes of deformation related to post-ablation recurrence can be visualized and interpreted, shown in Fig. 2. Area strain [16] and the magnitude
of displacement were mapped onto meshes to illustrate detailed variations in deformations. For area strain, red indicates enlargement of triangular elements, while blue indicates shrinking. For displacement, regions in red deform with a larger scale of displacement than regions in blue.
Less Recurrence More Recurrence
-σ -0.5σ 0 +0.5σ +σ
(a) The first mode of deformation
(b) The second mode of deformation
(c) The third mode of deformation
More dom inant Area St ra in Dis plac em ent Recurrence (a) (b) (c)
Fig. 2. The first three modes of deformation involved in post-ablation recurrence. 𝜎
represents the standard derivation on each mode in the population.
Results show that the most dominant mode has an emphasis on regions underneath pulmonary veins, both with area strain and displacement of mesh elements. Clinical experts confirmed that this is one of the most complicated area to ablate in pulmonary vein isolation. Also, the remodelling around pulmonary
veins seems to be an important aspect of AF. The second mode contains a twist of the upper-left part of the LA (from the posterior view, including roof, lateral and anterior segments) and also changes in orientation of pulmonary veins. The third mode, from less recurrence to more recurrence, reflects a slight change of roundness. These 3D deformation sequences can also be shown as videos in order to be more explicit. However, the subtle regional variations need further interpretation.
We compared prediction capabilities of shape indices with that of LAVI, using student’s t-test and receiver operating characteristic (ROC) curves. The indices are shown in Table 3.
Table 3. Student’s t-test to compare shape indices and left atrial volume index in two
sub-groups and area under receiver operating characteristic curves.
PAF patients Non-recurrence Recurrence P-value AUC 𝑆𝐼 - 1 PLS component 0.28 ± 0.20 0.41 ± 0.23 0.04 0.65 𝑆𝐼 - 2 PLS components 0.29 ± 0.22 0.48 ± 0.26 0.01 0.73 𝑆𝐼 - 3 PLS components 0.30 ± 0.21 0.51 ± 0.34 0.01 0.70 Volume index/𝑚𝐿/𝑚2 64.25 ± 19.34 64.97 ± 22.23 0.46 0.47
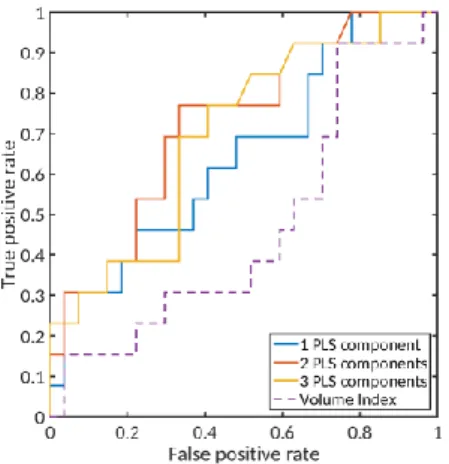
Fig. 3. Receiver operating
characteris-tic curves of 6-month post-ablation re-currence prediction.
• Shape indices derived from PLS gression differed significantly between re-currence and non-rere-currence groups, with p-value reaching 𝑝 = 0.01 < 0.05 with the first two components, while LAVI did not, with 𝑝 = 0.46.
• Shape indices show a better classifi-cation performance as the discrimination threshold varies. We draw ROC curves of the shape indices and the volume index in Fig. 3. The area under the ROC curve (AUC) using the first two components is 0.73, compared with 0.47 for LAVI.
• With discrimination threshold 𝑡 = 0.36 for shape index with the first two components, we predicted recurrence with 0.77 sensitivity and 0.67 specificity.
From the differences, we can conclude that the shape analysis discovered extra
anatomical features compared with the volume index for the understanding of post-ablation recurrence. Meanwhile, the principle modes of deformation re-vealed in this study turned out to be clinically meaningful.
4 Conclusion
We adapted a shape-based statistical model, extended from mathematical cur-rents and diffeomorphism, to address the problem of post-ablation recurrence. We eliminated the impact of atrial size in shape analysis. Then, from regressions, we obtained shape indices better predicting post-ablation recurrence, when com-pared with dilatation. Our shape analysis approach summarizes all shape varia-tions at a scale that is greater than the kernel width. It is also more robust, with respect to training samples, than using only one shape parameter, as is done with the volume index.
From a clinical viewpoint, we revealed the principal LA deformation modes that were related to a higher post-ablation recurrence rate. We visualized them and some anatomical details were consistent with the complexity of ablation in clinical practice. These features also bring new insights on how a shape evolves during LA remodeling, apart from volume change.
Future work includes using a larger database to reduce random effects even further, as well as combining shape variations with other factors, such as age, sex and electrocardiography, to stratify the risk of recurrence.
Acknowledgments. Part of the research was funded by the Agence Nationale
de la Recherche (ANR)/ERA CoSysMed SysAFib and ANR MIGAT projects.
The authors would like to thank Alan Garny, Côme Le Breton and Marco Lorenzi for their great support.
References
1. Massimo Zoni-Berisso, Fabrizio Lercari, Tiziana Carazza, Stefano Domenicucci, et al. Epidemiology of atrial fibrillation: European perspective. Clin Epidemiol, 6:213–220, 2014.
2. Antonio Berruezo, David Tamborero, Lluis Mont, Begoña Benito, Jose María Tolosana, Marta Sitges, Bárbara Vidal, Germán Arriagada, Francisco Méndez, Maria Matiello, et al. Pre-procedural predictors of atrial fibrillation recurrence after circumferential pulmonary vein ablation. European heart journal, 28(7):836– 841, 2007.
3. Nikolaos Dagres, Hans Kottkamp, Christopher Piorkowski, Sebastian Weis, Arash Arya, Philipp Sommer, Kerstin Bode, Jin-Hong Gerds-Li, Dimitrios Th Kremasti-nos, and Gerhard Hindricks. Influence of the duration of holter monitoring on the detection of arrhythmia recurrences after catheter ablation of atrial fibrillation: implications for patient follow-up. International journal of cardiology, 139(3):305– 306, 2010.
4. Sung-Hee Shin, Mi-Young Park, Woong-Jin Oh, Soon-Jun Hong, Hui-Nam Pak, Woo-Hyuk Song, Do-Sun Lim, Young-Hoon Kim, and Wan-Joo Shim. Left atrial volume is a predictor of atrial fibrillation recurrence after catheter ablation. Journal
of the American Society of Echocardiography, 21(6):697–702, 2008.
5. Felipe Bisbal, Esther Guiu, Naiara Calvo, David Marin, Antonio Berruezo, Elena Arbelo, José Ortiz-Pérez, Teresa María Caralt, José María Tolosana, Roger Borràs,
et al. Left atrial sphericity: a new method to assess atrial remodeling. impact on the outcome of atrial fibrillation ablation. Journal of cardiovascular electrophysiology, 24(7):752–759, 2013.
6. Marrouche NF, Wilber D, Hindricks G, and et al. Association of atrial tissue fibro-sis identified by delayed enhancement mri and atrial fibrillation catheter ablation: The decaaf study. JAMA, 311(5):498–506, 2014.
7. Marta Varela, Felipe Bisbal, Ernesto Zacur, Antonio Berruezo, Oleg Aslanidi, Lluis Mont, and Pablo Lamata. Novel computational analysis of left atrial anatomy improves prediction of atrial fibrillation recurrence after ablation. Frontiers in
Physiology, 8:68, 2017.
8. S. Labarthe, Y. Coudiere, J. Henry, and H. Cochet. A semi-automatic method to construct atrial fibre structures: A tool for atrial simulations. In 2012 Computing
in Cardiology, pages 881–884, Sept 2012.
9. Shuman Jia, Loïc Cadour, Hubert Cochet, and Maxime Sermesant. STACOM-SLAWT Challenge: Left Atrial Wall Segmentation and Thickness Measurement Using Region Growing and Marker-Controlled Geodesic Active Contour. In 7th
International Statistical Atlases and Computational Modeling of the Heart (STA-COM) Workshop, Held in Conjunction with MICCAI 2016, volume 10124 of LNCS,
pages 211–219. Springer, Mar 2017.
10. Hubert Cochet, Rémi Dubois, Frédéric Sacher, Nicolas Derval, Maxime Sermesant, Mélèze Hocini, Michel Montaudon, Michel Haïssaguerre, François Laurent, and Pierre Jaïs. Cardiac arrythmias: multimodal assessment integrating body surface ecg mapping into cardiac imaging. Radiology, 271(1):239–247, 2013.
11. Clément Jamin, Pierre Alliez, Mariette Yvinec, and Jean-Daniel Boissonnat. Cgalmesh: a generic framework for delaunay mesh generation. ACM Transactions
on Mathematical Software (TOMS), 41(4):23, 2015.
12. Michael I Miller, Laurent Younes, and Alain Trouvé. Diffeomorphometry and geodesic positioning systems for human anatomy. Technology, 2(01):36–43, 2014. 13. Nicolas Charon and Alain Trouvé. The varifold representation of nonoriented
shapes for diffeomorphic registration. SIAM Journal on Imaging Sciences,
6(4):2547–2580, 2013.
14. Stanley Durrleman, Marcel Prastawa, Nicolas Charon, Julie R Korenberg, Sarang Joshi, Guido Gerig, and Alain Trouvé. Morphometry of anatomical shape com-plexes with dense deformations and sparse parameters. NeuroImage, 101:35–49, 2014.
15. Paul Geladi and Bruce R Kowalski. Partial least-squares regression: a tutorial.
Analytica chimica acta, 185:1–17, 1986.
16. Sebastiaan A Kleijn, Mohamed FA Aly, Caroline B Terwee, Albert C van Rossum, and Otto Kamp. Three-dimensional speckle tracking echocardiography for auto-matic assessment of global and regional left ventricular function based on area strain. Journal of the American Society of Echocardiography, 24(3):314–321, 2011.