HAL Id: hal-01695082
https://hal.archives-ouvertes.fr/hal-01695082
Submitted on 4 Dec 2019
HAL is a multi-disciplinary open access
archive for the deposit and dissemination of
sci-entific research documents, whether they are
pub-lished or not. The documents may come from
teaching and research institutions in France or
abroad, or from public or private research centers.
L’archive ouverte pluridisciplinaire HAL, est
destinée au dépôt et à la diffusion de documents
scientifiques de niveau recherche, publiés ou non,
émanant des établissements d’enseignement et de
recherche français ou étrangers, des laboratoires
publics ou privés.
Appraising the environmental benefits of ride-sharing:
The Paris region case study
Biao Yin, Liu Liu, Nicolas Coulombel, Vincent Viguie
To cite this version:
Biao Yin, Liu Liu, Nicolas Coulombel, Vincent Viguie. Appraising the environmental benefits of
ride-sharing: The Paris region case study. Journal of Cleaner Production, Elsevier, 2018, 177, pp.888-898.
�10.1016/j.jclepro.2017.12.186�. �hal-01695082�
THIS IS A POST-PRINT VERSION. THE ORIGINAL ARTICLE IS PUBLISHED IN THE JOURNAL OF CLEANER PRODUCTION https://doi.org/10.1016/j.jclepro.2017.12.186
© 2018. LICENSED UNDER THE CREATIVE COMMONS CC-BY-NC-ND 4.0 LICENSE http://creativecommons.org/licenses/by-nc-nd/4.0/
Appraising the environmental benefits of ride-sharing:
the Paris region case study
Biao Yin
a, Liu Liu
a,, Nicolas Coulombel
a, Vincent Viguié
baLaboratoire Ville Mobilité Transport, Ecole des Ponts ParisTech, Université Paris-Est, Champs-sur-Marne 77455, France bCentre International de Recherche sur l'Environnement et le Développement, Ecole des Ponts ParisTech, Nogent-sur-Marne 94736, France
Abstract
This paper investigates the environmental benefits of ride-sharing through its CO2 emission mitigation potential.
Ride-sharing is expected to substantially decrease CO2 emissions by raising vehicle occupancy, thus mechanically
reducing the number of vehicles on the road. Yet, as ride-sharing entails both a decrease in travel (monetary) costs and in travel times (inasmuch as it reduces road congestion), it is likely to make the car more attractive ultimately. This could result in mode switching in the short run (as travelers forsake public transport or active modes for car), as well as in longer distances travelled in the medium run. In the long run, people could even take advantage of the easier travel conditions to relocate further within the metropolitan area. To account for these rebound effects, we develop an integrated land-use transport model. This intends to capture the effects of ride-sharing on the whole household decision process regarding transport and residential location. The model is applied to the Paris region, with several ride-sharing scenarios for year 2030. While ride-sharing does indeed strongly reduce CO2 emissions,
we find substantial rebound mechanisms. In contrast to the (naïve) expectation that raising vehicle occupancy by 50% would reduce CO2 emissions by 33%, the various rebound effects end up dividing the CO2 emission savings
by a factor ranging from 2 to 3 depending on the day period considered (i.e. the morning or evening peak period). The rebound mechanisms - the mode switching, distance and relocation effects - should therefore be heeded. Some policy recommendations are provided to develop ride-sharing while curbing these unintended effects.
Keywords: ride-sharing; CO2 emissions; transport; land-use; behavioral change
* Corresponding author. Tel.: +33 1 81 66 88 64; fax: + 33 1 64 15 21 40.
List of symbols and abbreviations
GHG GreenHouse Gas
ppm parts per million
AVO Average Vehicle Occupancy
ITLUM Integrated Transport Land-Use Model
O-D Origin - Destination
TAZ Traffic Analysis Zone
C Car
PT Public Transport
AM Active Modes, e.g., cycling, walking, etc.
VOC Volume-Over-Capacity
BPR Bureau of Public Roads
COM Component Object Model
PC Petite Couronne, i.e., inner ring of the Paris region
GC Grande Couronne, i.e., outer ring of the Paris region
MRH Morning Rush Hour
ERH Evening Rush Hour
𝐹𝑖𝑗 Trip volumes from zone i to zone j
𝑐𝑖𝑗 Impedance variable to measure multimodal disutility from zone i to zone j
𝑚 Transport mode, 𝑚 ∈ {𝐶, 𝑃𝑇, 𝐴𝑀}
𝑇𝑖𝑗𝑚 Travel time by mode m from zone i to zone j
𝐷𝑖𝑗𝑚 Travel distance by mode m from zone i to zone j
𝑀𝑖𝑗𝑚 Monetary cost by mode m from zone i to zone j
𝑈𝑖𝑗𝑚 Utility of travel for mode m from zone i to zone j
𝑇𝑙 Travel time (h) on link l
𝑉𝑙 Traffic volume (veh/h) on link l
𝐶𝑙 Road capacity (veh/h) on link l
ρ Road network congestion ratio, 𝜌 ∈ [0, 1] 𝑉𝐾𝑇𝑙 Vehicle-kilometers travelled (veh∙km) on link l
𝑣𝑙 Vehicle velocity (km/h) on link l
𝐶𝑂2𝑔𝑎𝑠 CO2 emission volume (tons/h) from vehicles using gas fuel
𝐶𝑂2𝑑𝑖𝑒𝑠𝑒𝑙 CO2 emission volume (tons/h) from vehicles using diesel fuel
𝐶𝑂2 CO2 emission volume (tons/h) from all vehicles
1. Introduction
Atmospheric concentration of greenhouse gases (GHG) has been steadily rising over the past century. In 2015, the average concentration of CO2 (399 ppm) was about 40% higher than in the mid-1800s, with an average growth
of 2 ppm/year over the last ten years (OECD/IEA, 2016). The long-term objective of keeping global warming below 2°C (relatively to pre-industrial levels) requires drastic reductions in GHG emissions. Yet, as economic growth spurs transport demand, transportation is amongst the fastest growing sectors of CO2 emissions. In 2014,
transport accounted for 23% of CO2 global emissions from fuel combustion, 75% of which being due to road traffic
(OECD/IEA, 2016).
Transport policies intending to abate GHG emissions can be classified into two categories (Chapman, 2007; Littman, 2013; Stanley et al., 2011). Technological innovations, such as cleaner vehicles or cleaner first-kilometers, aim to reduce emission rates per vehicle-kilometer, while mobility management seeks to reduce distances travelled and to promote cleaner modes by triggering behavioral changes among users (see for instance Laakso, 2017). Technological innovations are central in reducing our dependence on fuel combustion. Yet, these are little likely to be able to prevent irreversible climate change alone (Moriarty and Honnery, 2008). The urgency of curbing GHG emissions calls for swift answers, hence the relevance of mobility management policies, being often quicker and lighter to implement. Ride-sharing – which refers to a situation in which individuals with matching itineraries and time schedules share a private vehicle and split travel costs (gas, tolls, parking fees…) to perform their trips (Furuhata et al., 2013) – has thereby attracted increasing attention in recent years, as a simple yet potentially very effective way to curb CO2 emissions as well as to endorse more virtuous behaviors (Aggarwal and Jain, 2016;
Chan and Shaheen, 2012; Jacobson et al., 2009; Laakso, 2017). While carpooling has long existed informally, the advent of mobile technologies has enabled dynamic ride-sharing, making the matchmaking process significantly easier and faster through dedicated mobile applications (Piscicelli et al., 2017; Sassi and Zambonelli, 2014).
Ride-sharing holds many promises as it would contribute to a decrease in the number of on-road vehicles, fuel consumption, and ultimately pollutant emissions through a more efficient use of private cars. As a matter of fact, average vehicle occupancy (AVO) is relatively low in most cities, especially in developed countries. For instance, the AVO is 1.55 persons per vehicle in the US, and 1.39 in France.1 This figure is even lower in the Paris region,
with only 1.28 persons per vehicle on average.2 In the US case, Jacobson et al. (2009) show that if no additional
travel is required to pick up passengers, adding 1 passenger in every 10 vehicles would yield fuel consumption savings around 7.54~7.74 billion gallons of gasoline per year. Ride-sharing requires few physical infrastructures (if any) to boot, being therein relatively costless compared to new transport infrastructure projects. Accordingly, an increasing number of cities include ride-sharing as a key part of their sustainable (low-carbon) mobility strategy to struggle against traffic congestion as well as to abate CO2 emissions (Global e-Sustainability Initiative, 2008;
Meyer, 1999; Replogle, 1993a, 1993b).
Academic interest has followed suit, hence an increasing number of works about ride-sharing and which may be structured around three main topics. A first strand of the literature seeks to optimize the matchmaking process, either from a computational (Agatz et al., 2012) or from a mechanism design point of view (Kleiner et al., 2011). Another strand focuses on ride-sharing demand, using big data such as mobile phone data or social network data (Alexander and González, 2015; Cici et al., 2014), or transport modeling (e.g. Bahat and Bekhor, 2016; Xu et al. 2015a, 2015b). Finally, a smaller share of the literature investigates the environmental benefits associated with ride-sharing (Fellows and Pitfield, 2000; Caulfield, 2009).3 Literature on this last topic remains scarce, however.
Furthermore, in most works the authors assume that ride-sharing does not impact travel demand. Yet, by lowering both transport costs and travel times (as it is expected to reduce congestion), ride-sharing is likely to make the car more attractive. This could result in mode switching in the short run (as travelers forsake public transport or active modes for car), as well as in longer distances travelled in the medium run (Golob et al., 1981). In the long run, people could even take advantage of the easier travel conditions to relocate further within the metropolitan area.
This paper investigates the CO2 emission mitigation potential of ride-sharing in the Paris region. In particular,
we seek to assess to what extent the three aforementioned effects (mode switching, longer distances, relocation) mitigate the initial environmental benefits of ride-sharing, an issue seldom – if at all – considered in the literature. We thereby extend the literature addressing the environmental rebound effects of transport policies and innovations (see for instance the recent study from Font Vivanco et al., 2015) by considering the specific case of ride-sharing. To do so, an integrated land-use transport model is developed, coupling two existing transport and land-use models. This allows us to capture the short-, medium-, and long-run effects of ride-sharing, thereby extending the existing literature regarding the very short-run effects (viz. the decongestion resulting from increased vehicle occupancy). The methodology is applied to analyze ride-sharing scenarios in the Paris region for year 2030. Road traffic is an especially salient issue in this region, accounting for 32% of CO2 equivalent emissions in 2012 (AirParif, 2012).
The road network is also subject to heavy congestion, making Paris the ninth most congested city in the world, according to some estimates.4 Local authorities therefore put great hope in ride-sharing to struggle against
congestion as well as to meet their CO2 emission target (Ile-de-France Mobilités, 2017).
The rest of this paper is organized as follows. Section 2 describes the integrated land-use transport model, and how ride-sharing is incorporated within the model. Section 3 presents the case study, and section 4 the results. Section 5 discusses the results and policy implications. Finally, Section 6 concludes.
1 Source: 2009 National Household Travel Survey for the US, and Enquête Nationale Transport et Déplacements 2007-2008 for France. 2 Source: Enquête Globale Transport 2010.
3 See also similar works on car-sharing (Rabbitt and Ghosh, 2013; Firnkorn and Müller, 2011).
4 Source: INRIX (URL: http://inrix.com/press-releases/los-angeles-tops-inrix-global-congestion-ranking/). This estimation measures
2. Integrated transport land-use model
There is now wide consensus that transport and land-use are strongly connected (Renne and Sturtevant, 2016). In this regard, the transport-land use feedback cycle of Wegener (1996) illustrates how one change in either the transport or land-use system may end up impacting both through a series of decisions (Figure 1). In our case, carpooling is for instance expected to reduce congestion, which may change the attractiveness of several areas, ultimately leading to urban development and household relocations within these areas.
Fig. 1: The transport-land use feedback cycle (adapted from Wegener, 1996).
Integrated transport - land use models (ITLUMs) aim to capture these interactions by representing all the main decisions represented in Figure 1. By doing so, ITLUMs are able to capture short-, medium-, and long-run effects of transport policies (or land-use policies). Typically, ITLUMs couple a transport model with a land-use model, although a few integrated models exist (Chang, 2006). The ITLUM used in this paper is from the former category, coupling the MODUS transport model with the NEDUM land-use model. Both models were calibrated and validated for the Paris region, and applied (separately) in various prospective studies. Accordingly, the coupled model is expected to provide sound and reliable results in general, and regarding the ride-sharing scenarios in particular.
The modeling framework and the representation of ride-sharing are based on the following assumptions: (A1) Ride-sharing has two direct effects: raising vehicle occupancy and reducing the (monetary) cost of travel commensurately (based on the assumption that costs are evenly split among riders).
(A2) The whole matchmaking process, including pick-up(s) and drop-off(s), is assumed to be perfectly costless: engaging in ride-sharing involves neither transaction costs, nor detours (and thus extra distances) for drivers. (A3) By changing travel conditions, ride-sharing has an (indirect) effect on route choice, mode choice, distances traveled, and ultimately residential location. We do not consider possible effects on firm location, however.
Assumption (A2) is based on the hypothesis that advances in mobile technologies and machine learning techniques – among others – will have arguably considerably optimized the ride-sharing matchmaking process by year 2030 (see e.g. Sassi and Zambonelli, 2014). Assumption (A3) stems from the scope of NEDUM, which addresses household location but not firm location. Considering the focus of this paper, this should not be detrimental inasmuch as changes in travel conditions firstly impact households in the short run, then firms in the long run (Garcia-López et al., 2017). We further discuss these assumptions in Subsection 2.4 and in Section 5.
2.1. Transport model
MODUS is a multimodal transport model developed by the DRIEA-IF – the State regional agency – for the analysis and the prospective of transport in the Paris region. Calibrated using the regional trip survey Enquête
Globale Transport and road count data (DRIEA-IF, 2012), the model has been validated through numerous
operational studies ever since. It is therefore a reference model for all the main stakeholders in the Paris region (the State, the regional public transit authority, transport operators …).
Regarding its theoretical foundation, MODUS is a static macroscopic model based on the standard four-stage representation (Ortuzar and Willumsen, 2011). Using land use characteristics and transport networks as primary inputs, travel demand is predicted by breaking down individuals’ travel decisions into four main steps (Figure 2): trip generation, distribution, mode choice and traffic assignment (route choice). Three transport modes are represented in MODUS: cars (C), public transport (PT), and active modes (AM). Travel demand is segmented according to six trip purposes (commuting, shopping, leisure …) and two individual types (based on whether one has a private vehicle at his disposal or not). We now present each step in more detail.
Trip generation. The first step predicts the number of trips produced and attracted by each traffic analysis zone
(TAZ). For each demand segment, trip productions and attractions are computed using a linear regression model based on the following TAZ characteristics: active/non-active population, number of jobs, and student capacity.
Distribution. The second step connects trip productions to trip attractions, thence providing a multimodal
Origin-Destination (O-D) matrix for each demand segment as an output. Distribution is based in MODUS on the exponential gravity model (Ortuzar and Willumsen, 2011). The flow 𝐹𝑖𝑗 from zone i to zone j is given by 𝐹𝑖𝑗 =
𝑘𝑃𝑖𝐴𝑗𝑒−𝜆𝑐𝑖𝑗, where 𝑃𝑖 is the trip production in zone i, 𝐴𝑗 the trip attraction in zone j, and 𝑘 and 𝜆 model constants.
The impedance variable 𝑐𝑖𝑗 is taken as the opposite of multimodal utility, derived as the logsum of modal utilities
(specified further): 𝑐𝑖𝑗 = − ln(𝑈𝑖𝑗𝐶 + 𝑈𝑖𝑗𝑃𝑇+ 𝑈𝑖𝑗𝐴𝑀).
Mode choice. The mode choice between zone i and zone j is represented by a discrete choice model (Ben-Akiva
and Lerman, 1985), using the multinomial logit specification. Utilities between zones depend on the characteristics of each mode 𝑚 (travel time 𝑇𝑖𝑗𝑚, travel distance 𝐷𝑖𝑗𝑚,, and monetary cost 𝑀𝑖𝑗𝑚) through the following equation:
𝑈𝑖𝑗𝑚= 𝛼𝑚+ 𝛽𝑚𝑇𝑖𝑗𝑚+ 𝛾𝑚𝐷𝑖𝑗𝑚+ 𝛿𝑚𝑀𝑖𝑗𝑚, 𝑚 ∈ {𝐶, 𝑃𝑇, 𝐴𝑀}, (1)
where 𝛽𝑚, 𝛾𝑚 and 𝛿𝑚 are all negative parameters. The greater the utility 𝑈
𝑖𝑗𝑚, the greater the probability that mode
m is chosen to move from zone i to zone j.
Traffic assignment. Assignment models simulate the route choice behaviour of users on a transport network,
(usually) taking congestion into account (Ortuzar and Willumsen, 2012). Typical outputs include traffic flows, travel times, and Volume-Over-Capacity (VOC) ratios at the road link (or transit interstation) level. In MODUS, traffic assignment is carried out separately for the road and public transport networks, so that interactions between modes is captured during mode choice. Road congestion is modelled by a standard BPR volume-delay function (Transportation Research Board, 2010): 𝑇𝑙= 𝑇𝑓× (1 + α × (𝐹𝑙/𝐾)𝛽), where 𝑇𝑙 is the travel time on a given link,
𝑇𝑓 the free-flow travel time, 𝐹𝑙 the traffic flow and 𝐾 the link capacity.
Considering that modal utilities depend on travel times and network distances (see Equation 1), results of the assignment step influence both the distribution and the mode choice step, hence the feedback arrows in Figure 2. Accordingly, for a given land-use configuration, the transport model is run iteratively until reaching equilibrium. MODUS is run using the TransCAD software.
2.2. Land-use model
NEDUM is a land-use model embedded in standard urban economic theory, being deeply inspired from the monocentric model (Fujita, 1989). Taking the spatial distribution of jobs and travel costs (in money and in time) as primary input data, the model represents two key mechanisms. First, for a given workplace, households
simultaneously choose their residential location and dwelling size by considering the trade-off between real estate prices and generalized transport costs (including monetary costs and time costs) associated with their commute. Second, real estate developers decide on the quantity of housing stock to be built depending on the local level of real estate prices. Based on these mechanisms, NEDUM is able to determine the spatial distribution of land and real estate values, dwelling sizes, population density, building height and density, and their evolution over time. In addition to the spatial distribution of jobs and the structure of transport costs, additional input data include the total household population, the average household income level, building costs, and land-use zonings.5
In practice, the model operates iteratively until reaching the target regional population (provided as an input), hence the loop. The model is coded in MATLAB.
2.3. Coupling the models
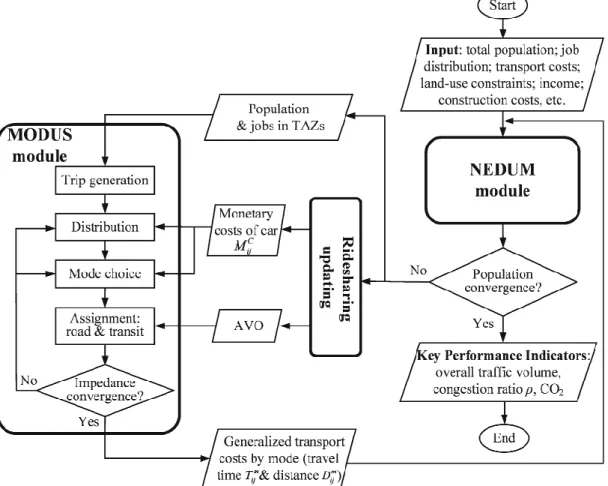
Coupling MODUS with NEDUM seems relatively straightforward at first glance, as it would merely involve exchanging data: MODUS feeds NEDUM with travel costs (travel times and distances between zones), whereas NEDUM provides populations per zone to MODUS (Figure 2).
Though simple on paper, the integration involves three main challenges. First, MODUS and NEDUM are not run from the same software, which is solved by making MATLAB access TransCAD as a COM object. Second, MODUS and NEDUM use different zone systems. NEDUM uses a square grid while MODUS uses administrative boundaries. Accordingly, a matching table is used to aggregate population from NEDUM zones to MODUS zones. Conversely, specific centroids and connectors were added to the transport network (Ortuzar and Willumsen, 2011) in order to compute travel costs between NEDUM zones. Last, NEDUM and MODUS being equilibrium models, coupling the two implies that a new land-use/transport equilibrium should be reached at the overall level, involving back-and-forths between the two models (hence the cycle in Figure 2). This greatly raises computational times: one simulation of the coupled model lasts from 2 to 3 days to reach the overall land-use/transport equilibrium, against around 2 hours for MODUS alone and only 10 minutes for NEDUM alone. Given this technical difficulty, the number of iterations between MODUS and NEDUM was limited to 3 in our simulations. This should not question our main findings, however, considering that land-use variations beyond the third iteration remained fairly limited in our tests. Notwithstanding, future works will investigate how to decrease the computational time (e.g. using parallel computing) in order to improve the convergence of the coupled model.
2.4. Integration of ride-sharing
Ride-sharing is represented simply in this paper, by considering changes in average vehicle occupancy (AVO). AVO currently varies in MODUS according to two elements: 1) trip purpose and 2) O-D type. For instance, while in 2010 the AVO in the Paris region is 1.28, the same value falls to 1.06 when considering only commuting trips. Similarly, AVO typically decrease with trip distance for most purposes (DRIEA-IF, 2012). In this paper, ride-sharing scenarios are represented through (multiplicative) increases in AVO, which may either be uniform or vary with the O-D type. The latter possibility (O-D differentiated increases) aims to reflect the fact that ride-sharing is more likely to occur for longer trips (Cervero, 1989). Monetary costs of car trips are also updated accordingly, based on the assumption that travel costs are split evenly among ride-sharers (if AVO doubles, costs are halved). In our model, ride-sharing has two effects. First, it decreases the average cost of car travel per person, as the cost of a ride is divided between a larger number of people. Second, it decreases the number of vehicles on the road at a given time, and therefore is expected to decrease congestion (decongestion effect during assignment). The simultaneous decrease in travel times and monetary costs in car makes the car more attractive w.r.t. other modes during the mode choice step (mode switching effect) and also results in people accepting to travel longer distances by car (distance effect during the distribution step). A decrease in average travel costs and times gives
5 Interested readers may refer to Viguié and Hallegatte (2012) for more information about modeling assumptions and model specifications
finally an incentive to people to accept to locate farther from the city center: changes in travel costs lead to changes in population location in NEDUM, and ride-sharing may ultimately impact the spatial distribution of trip productions and attractions during the generation step (relocation effect).
We now position our model relatively to the literature. The matching process is not represented in this paper, in contrast to other works which model carpooling explicitly as a specific alternative (e.g. Bahat and Bekhor, 2016; Xu et al. 2015a, 2015b). Doing so would involve not only changing the model structure (firstly mode choice and route choice), but also recalibrating MODUS, forfeiting all interest of using a fully calibrated and validated model. The drawback of not representing the matching process is further mitigated by the fact that this paper focuses on the potential of ride-sharing to abate CO2 emissions, rather than on predicting the ride-sharing adoption dynamics.
On the other hand, our model captures the effects of ride-sharing on all the main steps in the mobility decision-making process (destination, mode, and route choices), in contrast to the existing literature which tends to focus on assignment effects (Alexander and González, 2015; Cici et al., 2014; Fellows and Pitfield, 2000; Li et al., 2016; Xu et al. 2015a, 2015b). Among the exceptions, Bahat and Bekhor (2016) simultaneously consider the mode and route choices. Yet, they only consider road modes, including neither public transit nor active modes in their model. Last, to the best of our knowledge, no previous work has considered the distance effect (from the distribution step) or the relocation effect (from the household location model).
Fig. 2. Flowchart of input/output parameters between MODUS and NEDUM with ride-sharing
3. Case study: the Paris region
3.1. Overview of Paris region
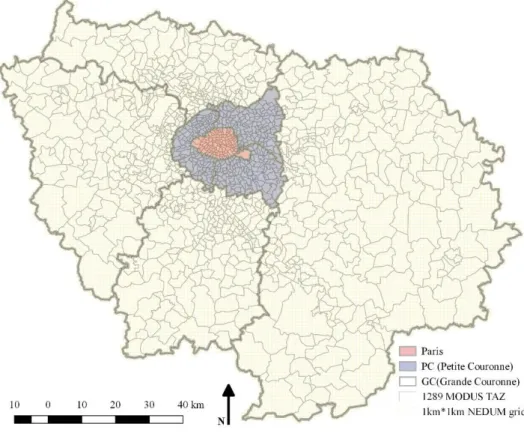
The Paris region spans over an area of 12,011 km2, which is divided into three concentric rings (Figure 3): the
city of Paris, the inner suburbs named Petite Couronne (PC), and the outer suburbs named Grande Couronne (GC). In 2014, its population adds up to 12.03 million inhabitants, making the Paris region the densest region in France
with 1,001 inhabitants/km2. Regarding transport, the number of daily trips in the Paris region reaches 40.7 million.6
To model travel demand within the study area, MODUS divides the Paris region into 1289 Traffic Analysis Zones (TAZ), which account for population density - hence smaller zones in the center of the metropolitan area - as well as transportation supply levels. NEDUM on the other hand is based on a square grid of 1km² resolution (Figure 3). Regarding transport supply, the road network comprises 65,692 links and includes all the main roads of the Paris region; the public transit network consists of 62,102 links and similarly represents all the main transit lines.
Fig. 3. The Paris study area and the MODUS and NEDUM zone systems
3.2. Ride-sharing scenarios
We consider four scenarios: one scenario for 2015 and three scenarios for 2030 (see Table 1).
The 2015 scenario represents the current situation, which will be used as a benchmark. Socio-economic data (total regional population, job distribution) come from Census, while income data are provided by fiscal databases. Transport data (road network, public transit network, utility parameters…) originate from the DRIEA-IF (2012). Land use data and other input data for NEDUM come from a collection of sources, reported in Viguié and Hallegate (2012). Overall, the benchmark scenario is characterized by a low average vehicle occupancy (1.28 persons/veh.) and moderate monetary (variable) costs regarding private cars (0.10€/km). Accordingly, distances traveled by car and subsequently CO2 emissions from road transport remain at relatively high levels to date (cf. Section 4).
Considering the ambitious carbon abatement objectives of the Paris region (dividing CO2 emissions by 4 by 2050)
this calls for equally ambitious transport policies, including raising mean vehicle occupancy thanks to ride-sharing (Ile-de-France Mobilités, 2017).
In order to assess the GHG emission mitigation potential of ride-sharing, we consider three scenarios for 2030. Relatively to the 2050 long run objective, year 2030 corresponds to a medium run milestone for which (reliable) socio-economic forecasts are available, and all major transport projects for the Paris region are already known.7
To simplify comparison, all three 2030 scenarios are based on the exact same input data, only differing in their underlying ride-sharing assumptions, namely the average AVO levels and the monetary cost parameters (Table 1). The firmographic (i.e. spatial distribution of jobs) and demographic (i.e. total regional population) 2030 forecasts were produced by the DRIEA-IF and the IAU-IdF. They consider a population and employment regional growth between 2015 and 2030 of +1M and +0.6M, respectively, based on a strong attractiveness of the Paris region resulting from two ambitious transport and land-use policies: the Grand Paris Express automatic subway project and the SDRIF regional master plan (DRIEA-IF and IAU-IdF, 2016). Regarding transportation, the three scenarios S2030, S2030-U and S2030-D include all transport projects planned for 2030, including the Grand Paris Express. With more than 200km of new subway lines and 68 new stations, for a total cost estimated at around 30 billion €, this transport mega-project is at the core of the sustainable mobility strategy of the Paris region and is expected to reduce car use and make suburb-to-suburb trips easier (Enright, 2013).
Given these elements, the first scenario defines a baseline situation with no changes in ride-sharing behaviors: AVO in S2030 is kept at the same level as in 2015. Accordingly, monetary cost parameters are also left unchanged. The second scenario (S2030-U) features a Uniform growth of AVOs by 50% for all trips, thus leading to an average AVO around 1.9. In contrast to S2030, it corresponds to a situation in which the convergence of new mobile technologies and proactive policies has successfully contributed to the development of ride-sharing practices. Last, in the Differentiated scenario (S2030-D) we assume ride-sharing is more likely to develop over long-distance trips (Teal, 1987), so that the AVO varies accordingly with the O-D type (see Appendix Table A.1). In both scenarios, monetary cost parameters decrease commensurately with the corresponding AVO increases (see Appendix Table A.2). For ease of comparison, we set the mean AVO growth to be the same in S2030-U and S2030-D and equal to 50%.8
Because the two ride-sharing scenarios (S2030-U and S2030-D) only differ from the baseline scenario (S2030) in their underlying ride-sharing parameters (AVO, monetary cost parameters), this will allow us to isolate the specific effect of ride-sharing – measured relatively to the current 2015 AVO level – by simply subtracting the results of S2030 to those of S2030-U and S2030-D.
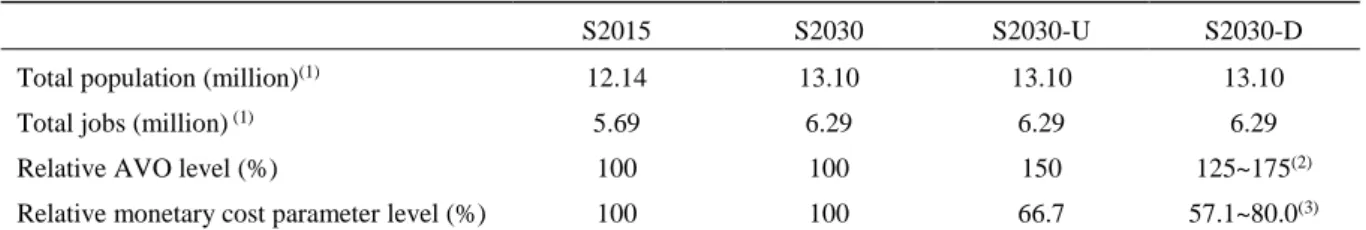
Table 1. Overview of the 4 scenarios.
S2015 S2030 S2030-U S2030-D
Total population (million)(1) 12.14 13.10 13.10 13.10
Total jobs (million) (1) 5.69 6.29 6.29 6.29
Relative AVO level (%) 100 100 150 125~175(2)
Relative monetary cost parameter level (%) 100 100 66.7 57.1~80.0(3)
Notes: (1) sources Census 2015, and DRIEA-IF and IAU-IdF (2016) for 2030; (2) see Appendix Table A.1; (3) see Appendix Table A.2.
3.3. Key performance indicators
To evaluate the impacts of ride-sharing scenarios comprehensively, three key performance indicators are used. These are: 1) the overall traffic volume (in number of private vehicles), 2) the road network congestion ratio, and 3) the aggregate regional level of CO2 emissions. The overall traffic volume is a standard indicator that provides
7 By contrast, at least one major road innovation, namely autonomous vehicles, is likely to spread by 2050 (Fagnant and Kockelman, 2015).
Modelling autonomous vehicles is beyond the scope of this paper, however, in particular in light of the various unknowns that remain to date (van den Berg and Verhoef, 2016).
a first measure of road usage, through the rate of private car trips per hour (de Dios Ortuzar and Willumsen, 2011). Because it only counts the number of trips, it does not inform about variations in trip distance, however.
The congestion ratio is defined as the weighted mean of the volume-over-capacity ratios (over all road links): 𝜌 = ∑ 𝑉𝑙(𝑉𝐶𝑙
𝑙)/ ∑ 𝑉𝑙 𝑙
𝑙 (2)
where 𝑉𝑙 is the traffic volume on link l and 𝐶𝑙 the link capacity. This indicator varies between 0 and 1, being equal
to 0 when there is no congestion at all, and equal to 1 when all roads are at full capacity. Contrary to the overall traffic volume, the network congestion ratio captures both variations in the number of trips and in trip distances (inasmuch as longer trip distances imply using more road links and thereby tend to increase traffic volumes 𝑉𝑙).
CO2 emissions in tons per hour are computed link by link, according to the flow and speed of vehicles, as well
as the fuel type, as indicated by the following formulae (established by the SETRA9):
𝐶𝑂2𝑔𝑎𝑠 = ∑ 𝑉𝐾𝑇𝑙 𝑙× (1104.19𝑣𝑙−0.522+ 8 × 10⁻⁴𝑣𝑙2.403+ 0.920)/106 (3)
𝐶𝑂2𝑑𝑖𝑒𝑠𝑒𝑙= ∑ 𝑉𝐾𝑇𝑙 𝑙× (746.67 𝑣𝑙−0.522+ 3.09 × 10⁻⁵ 𝑣𝑙2.403− 1.966)/106 (4)
where 𝑉𝐾𝑇𝑙 denotes the vehicle-kilometers travelled, and 𝑣𝑙 the vehicle speed on link l. Considering that the share
of diesel within the regional vehicle fleet is 70%, total CO2 emissions per link are:
𝐶𝑂2= 0.7 × 𝐶𝑂2𝑑𝑖𝑒𝑠𝑒𝑙+ 0.3 × 𝐶𝑂2𝑔𝑎𝑠. (5)
CO2 emissions are a key performance indicator for cities and for sustainable mobility policies, inasmuch as they
directly contribute to global warming (Mugion et al., 2018). In contrast to the previous indicators, CO2 emissions
are influenced by travel demand (overall traffic volume, trip distance), by congestion (insofar as speed influences CO2 emissions, see Equations 3 and 4), and also by the composition of the vehicle fleet (Equation 5).
In the remainder of the text, we focus the analysis on the morning rush hour (MRH) and evening rush hour (ERH), as the periods with the heaviest levels of traffic.
4. Results
4.1. Effects of ride-sharing on mobility and travel conditions
We start by analyzing the effects of ride-sharing on overall traffic volumes. In the baseline scenario (S2030), the demographic growth between 2015 and 2030 combined with the absence of changes in travel behaviors leads to a moderate increase in car usage: +1.3% vehicles for the morning peak period, and +1% for the evening peak compared to the 2015 situation (Figure 4). Note that these figures would have been even greater were it not for the 2030 public transport improvement plan (including the Grand Paris Express).
As expected, ride-sharing leads to a strong reduction in road traffic. In the uniform scenario S2030-U, traffic volumes decrease respectively by 23% and 21% during the morning and evening peak periods, respectively, confirming the efficiency of ride-sharing.
However, it is interesting to note that, considering that if ride-sharing had no impact on travel demand, the expected traffic reduction would be 33%.10 Decongestion effect, mode-switching, distance, effect and relocation
effect therefore cancel out around 30% of the expected traffic reduction. This cancelling is less present under the differentiated growth scenario S2030-D: traffic volumes decrease by 29% (for the MRH) and 28% (for the ERH),
9 SETRA: Service d’Etudes sur les Transports, les Routes et leurs Aménagements.
10Since AVO increases by 50%, new AVO represents 150% of old AVO. If everything else remains constant, we should therefore expect the
respectively. Focusing ride-sharing efforts on long-distance trips seems substantially more efficient in reducing car usage.
Fig. 4. Road traffic volumes (above bars % change w.r.t. S2015).
The results relative to network congestion ratio are slightly different. With no changes in travel behaviour, congestion levels slightly decrease from 2015 to 2030 for both the morning and evening peak periods (Figure 5). Considering that traffic volumes (slightly) increase over the same time span (Figure 4), two mechanisms account for this paradox: a decrease in trip distances, and a change in the spatial distribution of trips and thus in routes, leading to the use of less congested roads in 2030. Developing ride-sharing yields a sizable decongestion effect on the other hand w.r.t. the 2030 baseline scenario. This corroborates that ride-sharing is indeed an effective policy to struggle against congestion. Yet, the observed effects are again less important than one might (naively) expect. This is especially true for the evening peak period, for which the decongestion effect between S2030 and S2030-U is relatively limited (-3.22% in relative variation). The decongestion effect is again much more pronounced in the differential scenario S2030-D, however.
Fig. 5. Road network congestion ratio ρ (above bars % change w.r.t. S2015).
In order to shed light on the rebound mechanisms observed previously, we look into the effects of ride-sharing on mode choice. First, one may observe that the modal share of public transport increases between 2015 and 2030,
from 25.2% (MRH) and 22.8% (ERH) in 2015 to 28.3% (MRH) and 28.4% (ERH) in 2030 (Figure 6). The 2030 public transport improvement scheme proves effective in raising the attractiveness of public transport, at the expense of cars, but also more unexpectedly of active modes. Now turning to the effect of ride-sharing, we find that there is indeed a mode switching effect: users from both public transport and active modes choose to switch mode as ride-sharing makes the car more attractive. The effect occurs for both the morning and evening rush hour. The car modal share rises by 2 to 6 points between the baseline scenario (S2030) and the ride-sharing scenarios (S2030-U and S2030-D), a small half of new car users coming from public transit, a larger half from active modes. The mode-switching effect is thus very significant, being larger than that of the 2030 public transport improvement scheme (which only lowered car use by 2 to 3%). This shows that the savings allowed by ride-sharing, in money but also in travel time, are substantial enough to trigger sizable behavioral changes in mode choice.
Fig. 6. Modal shares.
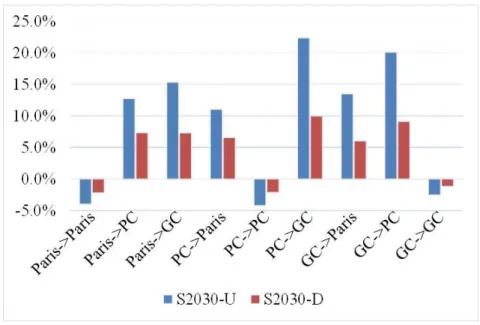
In addition to the mode switching effect, we can investigate whether there is also a significant distance effect. Again, we find that ride-sharing does indeed result in longer distances travelled with respect to the 2030 baseline scenario. The shares of daily intra-zonal trips (Paris Paris, PC PC, GC GC) decreases in both ride-sharing scenarios, while the share of daily inter-zonal trips markedly increases (Figure 7), hence longer trip distances. The category that increases the most is the PC GC category, between +22% and +10% depending on the scenario considered. Conversely, the trip categories that decrease the most correspond to trips from Paris to Paris and from PC to PC, with a decrease ranging in both cases from –2% to –4% depending on the scenario.
Fig. 7. Variations in daily trip volumes by O-D type (w.r.t. S2030).
Finally, let us examine the impact of the relocation effect in our simulations. To do this, we can do a simulation in which we only use the transport model (we do not run the land-use model NEDUM), and compare this simulation with the previous one. Figure 8 compares road traffic volumes in both simulations. In the simulations with both the land-use and the transport model, ride-sharing effect on road traffic volume appears to be slightly increased (up to 5%), when compared to the simulation with the transport model only, in the 2030-D scenario. On the other hand, it is almost the same in the 2030-U scenario (less than 1% difference). This is due to the fact that, in the differential scenario, the geographical structure of car travel costs is different than in the reference scenario (because ride-sharing prevalence is supposed larger for long-distance trips than for shorter ones), whereas it remains roughly the same in the 2030-U scenario. The 2030-U scenario induces therefore almost no relocation, when compared with the reference scenario, whereas in the 2030-D simulation people relocate to take advantage of the new transport costs geographical pattern.
Fig. 8. Influence of the relocation effect on road traffic volumes (above bars % change w.r.t. S2030).
4.2. Effects on CO2 emissions
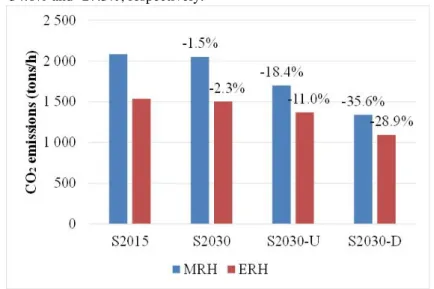
Let us now examine the impact of ride-sharing on CO2 emissions. When there are no changes in travel
in road congestion (cf. subsection 4.1). The decrease is more pronounced during the evening peak period (–2.3%) than during the morning peak period (–1.5%). As expected, ride-sharing substantially abates CO2 road emissions.
In the uniform scenario (S2030-U), emission levels decrease by -18.4% and -11.0% between 2015 and 2030 for the morning and evening peak periods, respectively. One possible explanation for the lower reduction during the evening peak period is that because trips are more spatially spread, the car appears an even more preferable option than during the morning peak hour (cf. Figure 6). This phenomenon would be further aggravated by ride-sharing - which improves car travel conditions - hence the observed difference between morning and evening rush hours. Reductions in CO2 emissions are markedly greater under the differential scenario (S2030-U), reaching –35.6%
and –28.9% for the morning and evening peak periods, respectively. Again, this corroborates the usefulness of specifically targeting long-distance trips.
This being said, again the CO2 emission reduction levels are markedly below what one might have expected.
Between S2030 and S2030-U, the relative decrease is (1-18.4%)/(1-1.5%)-1=-17.2% for the MRH, and -8.9% for the ERH. Compared to the (naïve) theoretical expectation of -33%, the CO2 rebound effect is halved for the MRH
and even reduced by a factor 3 for the ERH. The effect is much less marked between S2030 and S2030-D, with relative decreases of -34.6% and -27.3%, respectively.11
Fig. 9. Volumes of CO2 emissions (above bars % change w.r.t. S2015).
Last, Figure 10 shows the spatial distribution of CO2 emission during the MRH for all the scenarios. In 2015,
one observes strong emission levels within Paris and its close suburbs, as well as on the suburban highway network. Emissions are especially high on the Paris inner ring road, viz. the périphérique. The situation is similar in 2030, with barely noticeable differences with respect to 2015. On the other hand, emission levels strongly decrease in the 2030-U and 2030-D scenarios, as ride-sharing leads to strong reductions in CO2 emissions. This is especially
conspicuous for the périphérique, which changes color between the baseline scenario S2030 and the ride-sharing scenarios 2030-U and 2030-D. Decreases in CO2 emission levels seem relatively uniform over space otherwise,
suggesting that ride-sharing does not lead to major changes in the overall structure of mobility patterns.
11 Note that because the increase in AVO is not uniform in the differential scenario, the expectation of a decrease of -33% does not hold.
Fig. 10. CO2 emissions, morning rush hour.
5. Discussion and policy implications
Based on our findings, ride-sharing shows indeed great potential regarding CO2 emission mitigation. Assuming
that AVO increases by 50% through the development of ride-sharing, CO2 emissions would be reduced by 11% to
18% depending on the period considered (MRH or ERH). Focusing the ride-sharing effort on long-distance trips proves even more efficient, as reduction rates are further increased to -29% and -36%, respectively. Considering that substantial CO2 emission reductions may be expected from other means, such as technological improvements,
ride-sharing could therefore contribute to successfully achieve the factor 4 objective (the French national pledge to reduce CO2 emissions by a factor 4 by 2050).
Still, we find that the CO2 mitigation potential would be even greater were it not for the rebound mechanisms,
namely the mode switching, distance, and relocation effects. These various rebound effects contribute to reduce by a factor 2 to 3 the environmental benefits of ride-sharing, as opposed to a situation in which ride-sharing would have no impact on travel demand (other than increasing AVO). To limit these rebound effects, several policies might be implemented. Ride-sharing schemes could be associated with public transport improvement schemes to decrease the mode switching effect. For instance, simulations show that if one combines the S2030-U scenario (uniform increase of AVO by 50%) with a 10% reduction in public transit travel times, then the CO2 reduction
levels become as high as -39% (MRH) and -29% (ERH), against -18% and -11% previously (i.e. not considering the 10% reduction in public transit travel times). The reduction in public transit travel times manages to offset the mode switching effect of ride-sharing (e.g. for the MRH, the modal share of public transport increases from 26.8% in the S2030-U scenario to 29.3% with the 10% reduction in travel times), allowing to better leverage the environmental benefits of ride-sharing. Similarly, the relocation effect could be limited by taxing households willing to locate too far within the metropolitan area (e.g. by increasing local taxes in the exurbs). Limiting the distance effect seems more challenging, as it would imply specifically targeting long-distance travel. Still, raising
awareness campaigns regarding global warming and the environmental impacts of car, especially of excessively long trips, might show results in this regards. Local authorities could also seek to provide more jobs and services in distant locations, so as to limit the need for long trips to access those, through targeted development policies.
Our scenarios assume a strong development of ride-sharing practices, leading to a mean increase of +50% regarding vehicle occupancy rates. While this may seem utterly optimistic, strong changes are already occurring in the French urban ride-sharing landscape. First, an increasing number of companies, including pure players (e.g. BlablaCar with its new Blablalines mobile application) or public transport operators (e.g. SNCF with iDVROOM), are actively looking to develop the urban ride-sharing market through ever more user-friendly and optimized mobile applications that aim to make dynamic ride-sharing easier by the day. Simultaneously, local authorities are increasingly investing in ride-sharing, including by funding dedicated infrastructures such as ride-sharing spots on highways. And highway companies in France are also starting to experiment high-occupancy vehicle (HOV) lanes, in line with the US. There is therefore a strong convergence of success factors (as well as expectations) regarding ride-sharing, which make our 2030 scenarios not so extravagant, and actually in line with other scenarios such as those proposed by the Shift Project (2017), among others. Still, observing trends in the few years to come will provide indications as to the likelihood of our hypothesis.
6. Conclusion
This paper has investigated the impact of several ride-sharing scenarios on travel conditions and CO2 emissions
in the Paris region. As expected, ride-sharing can play a key role in reducing CO2 emissions from road transport.
Still, its abatement potential is hindered by several rebound mechanisms, namely the mode switching, distance, and relocation effects. These are far from negligible: we find that they reduce the initial reduction in CO2 emissions
by a factor 2 to 3 depending on the day period considered (morning or evening rush hour). From a theoretical point of view, this confirms the relevance of using comprehensive models such as ITLUMs. By capturing the short-, medium-, and long-run effects of ride-sharing on the whole household decision process regarding transport and residential location, these lead to though qualitatively similar, still quantitatively very different results than partial approaches focusing on the very short-run effects (viz. the decongestion resulting from greater vehicle occupancy). Our results thereby corroborate that environmental rebound effects of transport policies cannot and should not be neglected, in line with the previous results of Font Vivanco et al. (2015).
Regarding the main policy implications, our results confirm that local authorities should focus ride-sharing policies on long distance trips (as the ones with the greatest mitigation potential). Furthermore, local authorities should also seek to address the rebound effects through targeted policies. This includes improving public transport, curbing urban sprawl and deterring distant residential location choices (e.g. through local taxation), or reducing long distance trips through development policies in the most distant parts of the metropolitan area.
Our findings are subject to a certain number of caveats. First, full convergence of the ITLUM chain could not be achieved due to excessive computational times. Future works will consider how to improve convergence and decrease computational times, e.g. through parallel computing. Second, to make full benefit from coupling models that were already calibrated, ride-sharing was integrated in a simple fashion by increasing vehicle occupancy rates. While by doing so we were still able to study the effects of some given ride-sharing scenarios, this precludes studying the ride-sharing adoption dynamics, and thus assessing the likelihood of said scenarios. This also implies that we do not factor that ride-sharing may involve longer trip distances in order to pick-up or drop-off passengers. While these various points could all be addressed in one go by explicitly modeling ride-sharing as a distinct mode (e.g. Bahat and Bekhor, 2016), this would imply recalibrating the full transport model, which will be considered in future works. More generally, more elaborate scenarios could be tested by considering technological changes, public policies, and long-term behavioral changes. While such an ordeal is far beyond the scope of our paper, doing so would shed significant light on the feasibility of reaching the factor 4 in the transport sector, considering not only ride-sharing, but all transport policies as a whole.
Acknowledgements
This research is supported by the VITE! project and by the DRAGON project (ORA-Chine), both funded by the French National Research Agency (grant numbers: ANR-14-CE22-0013 and ANR-14-ORAR-0005). The authors especially acknowledge the Île-de-France Regional Department for Equipment and Planning (DRIEA IF) for providing data and technical support on the MODUS model.
Appendix
Table A.1. Relative AVO levels (in %) in the S2030-D scenario.
Paris PC GC
Paris 125 135 155
PC 135 140 165
GC 155 165 175
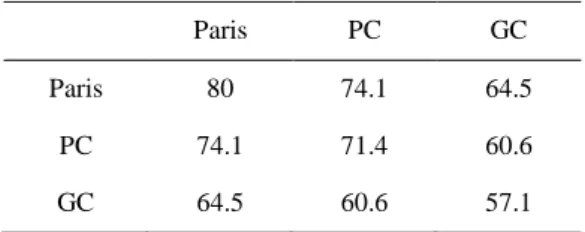
Table A.2. Relative levels in monetary cost of travel by car (in %) in the S2030-D scenario.
Paris PC GC
Paris 80 74.1 64.5
PC 74.1 71.4 60.6
GC 64.5 60.6 57.1
References
Agatz, N., Erera, A., Savelsbergh, M., Wang, X. 2012. Optimization for dynamic ride-sharing: A review. European Journal of Operational Research, 223(2), 295-303.
Aggarwal, P., Jain, S. 2016. Energy demand and CO2 emissions from urban on-road transport in Delhi: current and future projections under various policy measures. Journal of Cleaner Production, 128, 48-61.
AirParif, Ile-de-France, https://www.airparif.asso.fr/_pdf/publications/inventaire-emissions-idf-2012-150121.pdf (Accessed 24.07.17) Alexander, L. P., González, M. C. 2015. Assessing the impact of real-time ridesharing on urban traffic using mobile phone data. Proc. UrbComp, 1-9.
Bahat, O., Bekhor, S. 2016. Incorporating ridesharing in the static traffic assignment model. Networks and Spatial Economics, 16(4), 1125-1149.
Ben-Akiva, Moshe E., and Steven R. Lerman, 1985. Discrete choice analysis: theory and application to travel demand. Vol. 9. MIT press. Caulfield, B. 2009. Estimating the environmental benefits of ride-sharing: A case study of Dublin. Transportation Research Part D: Transport and Environment, 14(7), 527-531.
Cervero, R. 1989. America’s Suburban Centers Unwin Hyman, Inc., Winchester, MA.
Chan, N. D., Shaheen, S. A. 2012. Ridesharing in North America: Past, present, and future. Transport Reviews, 32(1), 93-112. Chang, J. S. 2006. Models of the relationship between transport and land‐use: A review. Transport Reviews, 26(3), 325-350. Chapman, L. 2007. Transport and climate change: a review. Journal of transport geography, 15(5), 354-367.
Cici, B., Markopoulou, A., Frias-Martinez, E., Laoutaris, N. 2014. Assessing the potential of ride-sharing using mobile and social data: a tale of four cities. ACM International Joint Conference on Pervasive and Ubiquitous Computing, 201-211.
de Dios Ortuzar, J., Willumsen, L. G. 2011. Modelling transport. 4th Edition. New Jersey: Wiley.
DRIEA-IF, 2012. Modèle régional multimodal de déplacements MODUS : Hypothèses et Données, Spécifications. Technical Report. DRIEA-IF, IAU-IdF, 2016. Scénarios de répartition de la population et des emplois: Note Méthodologique. Technical Report. EGT, 2010. http://www.omnil.fr/spip.php?article81 (Accessed 24.03.17)
Enright, T. E. 2013. Mass Transportation in the Neoliberal City: The Mobilizing Myths of the Grand Paris Express. Environment and Planning A, 45(4), 797-813.
European Commission, 2015. https://ec.europa.eu/clima/policies/transport/vehicles/cars_en (Accessed 24.03.17)
Fagnant, D. J., Kockelman, K. 2015. Preparing a nation for autonomous vehicles: opportunities, barriers and policy recommendations. Transportation Research Part A: Policy and Practice, 77, 167-181.
Fellows, N. T., Pitfield, D. E. 2000. An economic and operational evaluation of urban car-sharing. Transportation Research Part D: Transport and Environment, 5(1), 1-10.
Firnkorn, J., Müller, M. 2011. What will be the environmental effects of new free-floating car-sharing systems? The case of car2go in Ulm. Ecological Economics, 70(8), 1519-1528.
Font Vivanco, D., Kemp, R., van der Voet, E. 2015. The relativity of eco-innovation: environmental rebound effects from past transport innovations in Europe. Journal of Cleaner Production, 101, 71-85.
Fujita, M. 1989. Urban economic theory: land use and city size. Cambridge university press.
Furuhata, M., Dessouky, M., Ordóñez, F., Brunet, M. E., Wang, X., Koenig, S. 2013. Ridesharing: The state-of-the-art and future directions. Transportation Research Part B: Methodological, 57, 28-46.
Garcia-López, M.-À., Hémet, C., Viladecans-Marsal, E., 2017. How does transportation shape intrametropolitan growth? An answer from the Regional Express Rail. Journal of Regional Science, 57, 758–780.
Golob, T. F., Beckmann, M. J., & Zahavi, Y. 1981. A utility-theory travel demand model incorporating travel budgets. Transportation Research Part B: Methodological, 15(6), 375-389
Global e e-Sustainability Initiative, 2008. SMART 2020: Enabling the low carbon economy in the information age.
Ile-de-France Mobilités, 2017. “Avec le covoiturage, Ile-de-France Mobilités veut faire de la voiture un mode de transport en commun complémentaire”, communiqué de presse, https://www.iledefrance-mobilites.fr/wp-content/uploads/2017/05/Communique-Avec-le-covoiturage-Ile-de-France-Mobilités-veut-faire-de-la-voiture-un-mode-de-transport-en-commun-complémentaire-180917.pdf (Accessed 02.10.17)
Jacobson, S. H., King, D. M. 2009. Fuel saving and ridesharing in the US: Motivations, limitations, and opportunities. Transportation Research Part D: Transport and Environment, 14(1), 14-21.
Kleiner, A., Nebel, B., Ziparo, V. 2011. A mechanism for dynamic ride sharing based on parallel auctions. DiVA, 266-272.
Kuntzky, K., Wittke, S., Herrmann, C. 2013. Car and ride sharing concept as a product service system–simulation as a tool to reduce environmental impacts. The Philosopher's Stone for Sustainability, 381-386.
Laakso, S. 2017. Giving up cars – The impact of a mobility experiment on carbon emissions and everyday routines. Journal of Cleaner Production, 169, 135-142.
Li, Z., Hong, Y., Zhang, Z. 2016. An empirical analysis of on-demand ride sharing and traffic congestion. International Conference on Information Systems, SSRN.
Littman, T. 2013. Comprehensive evaluation of energy conservation and emission reduction policies. Transportation Research Part A: Policy and Practice, 47, 153-166.
Meyer, M-D., 1999. Demand management as an element of transportation policy. Transportation Research Part A: Policy and Practice, Vol. 33, Num. 7, 575-599.
Moriarty, P., Honnery, D. 2008. The prospects for global green car mobility. Journal of Cleaner Production, 16, 1717-1726.
Mugion, R. G., Toni, M., Raharjo, H., Di Pietro, L., Sebathu, S. P. 2018. Does the service quality of urban public transport enhance sustainable mobility?. Journal of Cleaner Production, 174, 1566-1587.
National Household Travel Survey (NHTS), 2009. http://nhts.ornl.gov/tables09/fatcat/2009/avo_TRPTRANS_WHYTRP1S.html (Accessed 24.03.17)
OECD/IEA, 2016. CO2 Emissions from Fuel Combustion. http://www.iea.org/bookshop/729-CO2_Emissions_from_Fuel_Combustion. (Accessed 24.03.17)
Ortuzar, J.D. Willumsen, L.G. 2011. Modelling Transport 4th Edition. Wiley, 607p.
Pisarski, A. 2006. Commuting in America III: The third national report on commuting patterns and trends. Transportation Research Board. Piscicelli, L., Ludden, G. D. S., Cooper, T. 2017. What makes a sustainable business model successful? An empirical comparison of two peer-to-peer goods-sharing platforms. Journal of Cleaner Production, in press.
Rabbitt, N., Ghosh, B. 2013. A study of feasibility and potential benefits of organised car sharing in Ireland. Transportation Research Part D: Transport and Environment, 25, 49-58.
Replogle, M., 1993a. Transportation Conformity and Demand Management: Vital Strategies for Clean Air Attainment. Environmental Defense Fund, Washington D.C.
Replogle, M., 1993b. Motor Vehicle Use and the Clean Air Act: Boosting Efficiency by Reducing Travel. Environmental Defense Fund, Washington D.C.
Renne, John L., and Lisa A. Sturtevant. 2016. Background, Outline, Emerging Themes, and Implications for Housing and Transportation Policy. Housing Policy Debate. 26(4-5), 563-567.
Sassi, A., Zambonelli, F., 2014. Coordination Infrastructures for Future Smart Social Mobility Services. IEEE Intelligent Systems, 29(5), 78-82.
Stanley, J. K., Hensher, D. A., Loader, C. 2011. Road transport and climate change: Stepping off the greenhouse gas. Transportation Research Part A: Policy and Practice, 45(10), 1020-1030.
Teal, R. F. 1987. Carpooling: who, how and why. Transportation Research Part A: General, 21(3), 203-214.
The Shift Project 2017. Décarboner la mobilité dans les zones de moyenne densité : Note Méthodologique. Technical Report. Transportation Research Board. 2010. Highway Capacity Manual, Transportation Research Board, National Research Council. Transport for London, 2014. Transport Emissions Roadmap: Cleaner transport for a cleaner London from the Mayor of London.
Van den Berg, V. A., Verhoef, E. T. 2016. Autonomous cars and dynamic bottleneck congestion: The effects on capacity, value of time and preference heterogeneity. Transportation Research Part B: Methodological, 94, 43-60.
Viguié, V., Hallegatte, S., Rozenberg, J. 2014. Downscaling long term socio-economic scenarios at city scale: A case study on Paris. Technological forecasting and social change, 87, 305-324.
Wegener, M.1996. Reduction of CO2 emissions of transport by reorganisation of urban activities. In Transport, land-use and the environment (pp. 103-124). Springer US.
Xu, H., Ordóñez, F., Dessouky, M. 2015a. A traffic assignment model for a ridesharing transportation market. Journal of Advanced Transportation, 49(7), 793-816.
Xu, H., Pang, J. S., Ordóñez, F., Dessouky, M. 2015b. Complementarity models for traffic equilibrium with ridesharing. Transportation Research Part B: Methodological, 81, 161-182.