HAL Id: hal-01985269
https://hal-enpc.archives-ouvertes.fr/hal-01985269
Preprint submitted on 17 Jan 2019
HAL is a multi-disciplinary open access archive for the deposit and dissemination of sci-entific research documents, whether they are pub-lished or not. The documents may come from teaching and research institutions in France or abroad, or from public or private research centers.
L’archive ouverte pluridisciplinaire HAL, est destinée au dépôt et à la diffusion de documents scientifiques de niveau recherche, publiés ou non, émanant des établissements d’enseignement et de recherche français ou étrangers, des laboratoires publics ou privés.
An ex post evaluation of energy-efficiency policies across
the European Union
Eoin Broin, Jens Ewald, Franck Nadaud, Érika Mata, Magnus Hennlock,
Louis-Gaëtan Giraudet, Thomas Sterner
To cite this version:
Eoin Broin, Jens Ewald, Franck Nadaud, Érika Mata, Magnus Hennlock, et al.. An ex post evaluation of energy-efficiency policies across the European Union. 2019. �hal-01985269�
1
An ex post evaluation of energy-efficiency policies across the European
Union
Eoin Ó BROINCentre International de Recherche sur l'Environnement et le Développement (CIRED), Paris, France EnvEcon, Dublin, Ireland
Jens EWALD
Environmental Economics, Gothenburg University, Sweden Franck NADAUD
Centre International de Recherche sur l'Environnement et le Développement (CIRED), Paris, France Érika MATA
IVL Swedish Environmental Research Institute, Gothenburg, Sweden Magnus HENNLOCK
IVL Swedish Environmental Research Institute, Gothenburg, Sweden Louis-Gaëtan GIRAUDET
Centre International de Recherche sur l'Environnement et le Développement (CIRED), Paris, France Thomas STERNER
Environmental Economics, Gothenburg University, Sweden
June 14, 2018
ABSTRACT
We evaluate the impact of a variety of energy efficiency policies on residential energy demand in six major EU economies (France, Germany, Italy, Spain, UK and Sweden) from 1990 to 2015. We find that both financing policies, such as loan facilities and subsidies, and building codes, as approximated by U-Values, have been effective at reducing energy demand for space heating. We additionally find the short term price and income effects to be inelastic, with elasticity coefficients of -0.2 and 0.2 respectively.
2
INTRODUCTION
The European Union has committed to reducing greenhouse gas emissions by at least 40 % by 2030 as compared with 1990 levels and reducing energy primary energy demand by between 27% and 40% (EC, 2017a). The latter goal should be met through improvements in energy efficiency and without a lowering of standards of living. In the immediate future to 2020 there should be a 20% saving in primary energy use (relative to a projected baseline value) and a 20% reduction in greenhouse gas emissions (relative to the levels in 1990) as part of the EU’s so called 20-20-20 package.
A lowering of the energy and carbon footprint of the EU building stock is fundamental to realizing these commitments. In this regard, building energy standards, energy performance labelling, and subsidies for energy efficient renovation are some of the broad policy measures that have been promoted. The introduction of the Energy Performance of Buildings Directive (EPBD) in 2002 marked an attempt to coordinate efforts on energy efficiency policy across the EU. In particular, the EPBD mandated the introduction of minimum efficiency standards for buildings in each country as well as energy performance certificates. The directive has been ‘recast’ in 2010 (EC, 2010) and subsequently incorporated into the Energy Efficiency Directive (EC, 2017b) and recently updated again (EC, 2018). These efforts should have brought more uniformity to efforts to energy standards and policy approaches to reducing or decarbonizing energy use in buildings across the EU. Ten years on from the implementation of this flagship EU initiative, minimum building efficiency standards exist in all EU countries, and the co-location of an energy efficiency label on advertisements for buildings that are available for sale or rent, has become standard practice. While there has been much expectation around the EPBD and subsequent Energy Efficiency Directive, each EU country has a unique set of indigenous building focused efficiency policies that in volume far outnumber the efficiency polices that have emanated from the EU (Isinnova, 2017).
This context raises two questions. First, what impact have energy efficiency policies had on the residential energy demand (depicted in Figure 1)? Second, have indigenous derived efficiency policies had greater reach than those emanating from the EU or have they been complimentary?
Gillingham et al.(2009) note that most evaluations of EU efficiency policies to date have been ex ante. In addition, despite claims that efficiency policies in place have ‘made a difference’ (Geller et al., 2009), studies quantifying the amount that efficiency policies have reduced energy demand are rare. To our knowledge, the most compelling evaluations of efficiency policies across EU countries include Bigano et al. (2011), Saussay et al. (2012), Filippini et al. (2014) and Ó Broin et al (2015). All apply panel data econometrics to data gathered from the MURE Policy Database (Isinnova, 2017) and the Odyssee Indicators Database1 (Enerdata, 2017), which both provide pan European harmonized data that enable intercountry comparisons.
1
The Odyssee database provides time series from 1990 to 2015 of energy demand at the end-use level for each EU country, plus time series for variables such as average floor area and heating degree days which allow harmonized cross-country energy efficiency indicators to be built.
3
FIGURE 1:TOTAL ENERGY DEMAND IN THE RESIDENTIAL SECTOR FROM 1990-2015 FOR THE EU COUNTRIES STUDIED IN THIS WORK (DATA SOURCE:ODYSSEE DATABASE).
Bigano et al. (2011), Saussay et al. (2012), and Ó Broin et al (2015) found that mandatory standards and regulations were the highest impact efficiency policies across the EU. In contrast, through an alternative econometric method applied to the same data, Filippini et al. (2014) found that financial policies had the most influence. The four studies differed in terms of how they represented efficiency policies in their models. All adopted some variant of dummy variable with Ó Broin et al (2015) building a policy index based on ex post assessments of the amount individual policies were expected to reduce demand. In addition, Bigano et al. (2011), Saussay et al. (2012) and Ó Broin et al (2015) examined delayed effects of the introduction of efficiency policies. The studies also differed in terms of the econometric approaches used. While Ó Broin et al (2015) used a static fixed effects panel data analysis, Filippini et al (2014) used the more complicated dynamic panel variety in a stochastic frontier framework. Finally, Bigano et al. (2011) and Filippini et al. (2014) examined total energy demand in the residential sector whereas Saussay et al. (2012) and Ó Broin et al (2015) focused on space heating energy demand in the same sector. These data and methodological differences could perhaps explain why unlike the other works Filippini et al (2014) did not find regulations to be paramount. Anyway, beyond their differences, the studies could not have captured the effect of the EPBD given that the time series they used ran to between 2006 and 2010, that is, before or just when the EPBD had been transcribed into national legislation.2
With the addition of five years of new data and the implementation of policy measures that stems from the EPBD, our study intends to reassess previous findings and more generally assess the impacts of broad policy categories, i.e. regulatory, financial and informative over the period 1990-2015. Crucially, our analysis introduces a number of control variables that have heretofore not been examined. These
2 See Ó Broin et al (2015) for a table describing the differences between the econometric models used in their work
and that used by Bigano et al. (2011), Saussay et al. (2012) and Filippini et al. (2014).
2 102 202 302 402 502 602 702 802 902 1990 1992 1994 1996 1998 2000 2002 2004 2006 2008 2010 2012 2014 TW h
Residential Sector Total Energy Demand
4 include, for new buildings constructed every year, average indoor temperatures and average thermal transmittance (U-values) of the building envelope. The latter is here meant to act as a proxy for the evolution of energy efficiency building codes, the key feature of the EPBD.
APPROACH
Our study aims to evaluate empirically how broad categories of efficiency policies have impacted energy demand in the EU residential sector over the period 1990-2015. The analysis covers total final energy demand, with a particular emphasis on space heating, which contributes 60% of energy demand in buildings. Studies on space heating demand are particularly rare. This is because it is much easier to put together a time series of electricity prices than a composite of time series of prices of all energy carriers used for space heating. In a preliminary step, we focused on the five biggest EU countries by population (France, Germany, Italy, Spain, UK) and Sweden, which together account for over 65% of final energy demand in the EU residential sector. This coverage allows for comparison with the aforementioned studies.
We use a dynamic panel data model with energy demand for space heating as the dependent variable. We control for the effects of the climate as represented by Heating Degree Days; demographics as represented the number of dwellings; trends in efficiency and technological advances as represented by the year. The model reads:
Eit = f (Eit-1, wapit, incit Year, hddit, dweit, t_intit, u_valit,, EPit) (1)
where E is energy demand for space heating in the residential sector, wap is the weighted average price of energy, inc is income per capita, year is a time trend which represents the underlying energy demand trend (UEDT) which itself captures the combined impact of both autonomous technical progress and efficiency policies, hdd are heating degree days, dwe is the number of dwellings and inertia as represented by an autoregressive lag (Et-1). Our model also includes controls for indoor temperature,
(t_int) and u_values (u_val). EP is some representation of energy policies in place and i and t are the spatial and temporal specifications of the panel being used.
We obtained the data for Eq. (1) from the following sources: number of permanently occupied dwellings; energy demand for five energy carriers [coal, oil, gas, district heating, electricity] for space heating, and total energy demand and prices for the same five energy carriers from the Odyssee Database, (2017);
HDD and income [Net disposable income: households and NPISH] from Eurostat (2017). We simulated
time series on indoor temperatures using a bottom up technical model (Mata et al, 2013) of the residential sector building stock in each of the six countries analyzed. We compiled data on U-Values from the building regulations that have been introduced since 1990 and aggregated them to produce an average for the stock by using weightings for the number of existing and new build single family and multifamily dwellings in the residential sector. Data on efficiency policies, past and current, stem from the MURE Policy Database (Isinova, 2017).
5 We did not include energy demand for biomass in Eit as corresponding data on prices for biomass in the
residential sector are not available. The coefficient of the time trend (Year) shows the percentage change in energy demand year on year due to the factors captured by the UEDT.
Table 1 presents an analysis of the data used in the work. Large variations can be observed, with Spain having as little as 1481 degree days one year and Sweden having as much as 5873. Overall, indoor temperature variation has been between 20 and 22 degrees.
TABLE 1: STATISTICAL ANALYSIS OF DATA USED IN THIS STUDY.
The MURE Policy Database (2018) contains 111 buildings focused energy efficiency policies for the six countries examined here. The numbers of policies for each country range from 26 for Spain to 11 for Sweden. The Swedish policies in the database are shown in Table 2. Table 2 shows the policy titles, type, start and end year and a semi quantitative impact (SQI) for each policy. It can be observed that some of the policies were in force before 1990 while others do not start until after the time-period covered in this work. In keeping with Filippini et al (2014) and Ó Broin et al (2015), we considered three sub-categories of policies, namely regulatory, informative and financial. For policies where sub-categorization was not straightforward from the Type listing, e.g. Co-operative Measures, it was necessary to explore detailed descriptions. We classified under both headings some policies, e.g., HOU SWE25, included both regulatory and informative elements. In contrast to the work of Ó Broin et al (2015), we did not use the SQI’s for categorization purposes with the view that the econometric model used should determine the impacts. In Table 2, only one policy – HOU SWE25, which designates the EPBD – emanates from the EU, which illustrates the difficulty with separating out the influence of policies that have emanated from the EU as opposed to national governments. A further issue is that according to the Title of HOU SWE25, it only covers energy certificates and not building regulations.
6
TABLE 2:POLICIES FOCUSED ON ENERGY EFFICIENCY IN SWEDEN FROM MUREPOLICY DATABASE (2018).NOTE THAT POLICIES WITHOUT AN END YEAR ARE ASSUMED TO BE ONGOING.
Code Title Type Start Year End Year SQI
HOU-SWE6 Assignment 2000 Co-operative Measures 1986 1992 High
HOU-SWE23 Technology procurement groups Co-operative Measures 1989 High
HOU-SWE4 Energy and carbon dioxide tax Cross-cutting 1991 Medium
HOU-SWE3 Testing and trial of energy intensive products Information/Education 1995 Low HOU-SWE9 Labelling of domestic appliances and windows Legislative/Informative 1995 2011 Low HOU-SWE10 Grants for biofuel heating systems and energy efficient windows Fiscal/Tariffs 2006 2009 Low HOU-SWE14 Support for conversion from direct electric systems Financial 2006 2010 Low HOU-SWE25 EPBD (Directive 2002/91/EC) - Energy efficiency certificates Legislative/Informative,
Legislative/Normative
2006 Low
HOU-SWE22 Programme for buildings with very low energy use (LÅGAN) Financial 2010 Unknown HOU-SWE21 Investment support for photovoltaic cells Financial 2013 2016 Unknown HOU-SWE12 Building regulations (Planning and building law) Legislative/Normative 2016 Unknown
We adopted the following modelling approach. We ran Equation 1 without t_intit, u_valit,, or EPit as a
basic model. In the basic model the UEDT should then capture the combined impact of both autonomous technical progress and efficiency policies. We then added variables, t_intit, u_valit,,, which have
heretofore not been used as explanatory variables in this kind of work. Variable u_valit, is used here as a
proxy for progress with building codes in place. Thirdly we replaced t_intit, u_valit,,, withthe variable EPit .
We tested various forms for EP starting with the approach used by Filippini et al (2014) i.e. to include a dummy if one policy in a sub category was in place and another if two or more policies in a sub category were in place3.
In line with Filippini et al. (2014) we employed all of the fixed effects (FE), the generalized method of moments (GMM), and the Least Squares Dummy Variable Corrected (LSDVC) estimators to estimate a dynamic panel data. Application of these methods on a macro panel dataset is a way to handle the joint occurrence of dynamics and unobserved country heterogeneity in energy demand.
The FE (sometimes called Least Square Dummy Variable; LSDV) estimator is biased and inconsistent for a finite T (time) with a lagged endogenous variable included in the model (Nickell, 1981). Despite this bias, the FE estimator is commonly applied by many studies in the energy demand literature and the estimated results can thus be used to compare to other published results. The bias does not vanish as N increases, but as T grows the FE estimator becomes consistent (the endogeneity bias → 0 as T → ∞). Several consistent instrumental variable (IV) and generalized method of moments (GMM) estimators have been proposed since the paper by Nickell (1981) as alternatives to the FE estimator. Out of these, the GMM estimator proposed by Arellano and Bond (1991) has been commonly used Arellano and Bond
3
An alternative approach could consist of including dummy variables for any year that any policy was in place or including dummy variables for any year that any policy in a sub-category was in place. Another approach could be to include dummies which distinguished between policies that emanated from the EU or national governments.
7 (1991) suggest an IV approach that, upon transforming the model in first differences to eliminate the unobserved individual heterogeneity, use the second lag and every feasible lag thereafter of the dependent variable, as instruments for the differenced one-time lagged endogenous variable. We estimated the consistent GMM estimator in this study. However, a weakness of the GMM is that its properties hold when N is large, hence it can be biased and imprecise in panel data with a small number of cross-sectional units. As in most macro panels, this is also the case in our study (N < 7 is the case in this work). We thus used an additional approach based on bias-correction: the bias corrected estimator Least Square Dummy Variable Corrected (LSDVC). Kiviet (1995) approximate the small sample bias of the FE estimator and suggests replacing the true parameters with the estimates from some consistent estimators. Monte Carlo evidence from the same study shows that the resulting LSDVC estimator often outperforms the IV–GMM estimators in terms of bias and root mean squared error (RMSE). Another piece of Monte Carlo evidence by Judson and Owen (1999) strongly supports LSDVC when N is small. From this scenario, LSDVC clearly emerges as one of the preferred estimators for dynamic panel-data models with small N and strict exogenous regressors. This motivates our use of LSDVC estimates.
RESULTS
Figure 2 and Figure 3 present models of space heating demand and total final energy demand respectively for panels of the six countries under examination for the basic model. The polarities of coefficients for both models conform to expectations. The estimated coefficients from the three econometric approaches (FE, GMM, LSDVC) are similar to each other. The FE estimator suffers from endogeneity bias under the specification of dynamic panel data model. However, in our case, this bias seems to be negligible. Coefficients for the variables that are part of the basic model are found to be significant. The difference between the results presented in Figure 2 and Figure 3 is that the latter include demand for electricity for appliances and lighting, water heating and cooking as well as space heat. Comparing the two sets of results, price elasticities (l_wap) are similar for both models while income elasticity (l_inc) is higher for space heating. Overall, we find the short term price and income elasticities to be inelastic, with coefficients of -0.2 and 0.2 respectively. As would be expected, the climate (l_hdd) has had a much greater impact on space heating than total energy demand. The impact of growing numbers of dwellings (l_dwe), which can also represent growing population, have also had a slightly higher impact on total demand than space heating than space heating energy demand probably because more energy end-uses are covered by the former.4
4 In earlier versions of Equation 1, we included variables representing average floor area per dwelling and persons
8
FIGURE 2:COEFFICIENTS CALCULATED FOR A MODEL OF SPACE HEATING ENERGY DEMAND FOR THE RESIDENTIAL SECTOR IN
FRANCE,GERMANY,ITALY,SPAIN,UK AND SWEDEN FROM 1990 TO 2015.***SIGNIFICANT AT 1% LEVEL,**SIGNIFICANT AT 5% LEVEL,*SIGNIFICANT AT 10% LEVEL.
For the models shown in Figure 2 and Figure 3, the coefficient of Year (UEDT) captures the combined effect of general efficiency policies, efficiency policies related to the EPBD and autonomous technical progress. Initial findings of around -0.005 for both total energy demand and for space heating suggest that there is almost a 0.5% a year reduction in demand year on year due to these factors. This suggests that there is still considerable year on year reductions in space heating demand. The number is however only half of the 1% annual improvement in efficiency found by EEW (2013), suggesting that other forces are at play not captured in the model. We cannot disentangle the contribution of on the UEDT from that of policy.
* p<0.10, ** p<0.05, *** p<0.01 Standard errors in parentheses
(0.0023) (0.0021) (0.0023) year -0.0046** -0.0051** -0.0041* (0.15) (0.14) (0.17) l_dwe 0.63*** 0.64*** 0.58*** (0.080) (0.069) (0.086) l_hdd 0.94*** 0.94*** 0.94*** (0.055) (0.050) (0.037) l_inc 0.17*** 0.20*** 0.17*** (0.046) (0.039) (0.058) l_wap_sh -0.20*** -0.20*** -0.20*** (0.056) (0.049) (0.083) L.l_sh_tot 0.46*** 0.46*** 0.49*** FE GMM LSDVC (1) (2) (3)
9
FIGURE 3:COEFFICIENTS CALCULATED FOR A MODEL OF TOTAL ENERGY DEMAND FOR THE RESIDENTIAL SECTOR IN FRANCE, GERMANY,ITALY,SPAIN,UK AND SWEDEN FROM 1990 TO 2015.***SIGNIFICANT AT 1% LEVEL,**SIGNIFICANT AT 5%
LEVEL,*SIGNIFICANT AT 10% LEVEL.
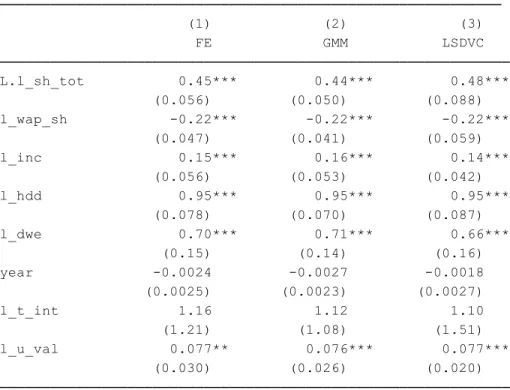
Figure 4 shows how adding indoor temperature (l_t_int) and U Value (l_u_val) as control variables – our key contribution – affects space heating demand. The coefficient of indoor temperature is not
significant, which may be because its effect is captured in the HDD variable which is itself a function of indoor temperature norms. The coefficient of Value (l_u_val) suggests that an increase of 1% in U-Values increases demand by almost 0.075%. This result must be understood in the sense that U-U-Values almost never get worse, but this is the way the model captures its effect. Examining this result another way, if average U-Values per dwelling were to fall by 10% from say 2 to 1.8, energy demand would be expected to fall by 0.75%. This suggests that building codes have had an impact on reducing energy demand. This result is important considering that the construction rate is under 1% per year.5 In
addition, as this is an average for the period under examination it may be that the effect has been higher for recent years when there were more building codes in place, not least as a result of the EPBD. At the same time, the coefficient of the UEDT (Year) has been reduced from - 0.0051 (Figure 2) to -0.0027 but is no longer significant. The reduction in the UEDT should be the proportion that was accounted for by building codes that are now captured by the l_u_val variable.
5 That is, we are observing the effect of codes spread across the entire residential building stock even though they
are only applied each year in new built dwellings * p<0.10, ** p<0.05, *** p<0.01 Standard errors in parentheses
(0.0015) (0.0013) (0.0016) year -0.0041*** -0.0046*** -0.0038** (0.12) (0.12) (0.16) l_dwe 0.80*** 0.83*** 0.76*** (0.048) (0.042) (0.056) l_hdd 0.46*** 0.47*** 0.46*** (0.033) (0.031) (0.025) l_inc 0.098*** 0.13*** 0.096*** (0.030) (0.027) (0.041) l_wap_tot -0.23*** -0.23*** -0.22*** (0.061) (0.055) (0.087) L.l_tot 0.41*** 0.36*** 0.44*** FE GMM LSDVC (1) (2) (3)
10
FIGURE 4:COEFFICIENTS CALCULATED FOR A MODEL OF SPACE HEATING ENERGY DEMAND FOR THE RESIDENTIAL SECTOR IN
FRANCE,GERMANY,ITALY,SPAIN,UK AND SWEDEN FROM 1990 TO 2015 THAT INCLUDES VARIABLES THAT CONTROL FOR THE EFFECTS OF INDOOR TEMPERATURE (L_T_INT) AND U-VALUES (L_U_VAL).***SIGNIFICANT AT 1% LEVEL,**SIGNIFICANT AT
5% LEVEL,*SIGNIFICANT AT 10% LEVEL.
Figure 5 presents results for a model of space heating demand that includes efficiency policy variables. We did not include t_int, which was not found to be significant (see previous paragraph), nor u_val, which is assumed to be captured by the regulatory policies that mandate building codes that are included in the variable BH. Results are presented for FE, GMM and LSDVC approaches. In Figure 5 BH3 represents if one regulatory efficiency policy is in place, BH4 if two or more are in place, with a similar scheme for fin (financial) and info (information) policies. This approach differs from that of Filippini et al. in the thresholds for the second dummy in each sub-category and produced more consistent results in our model than with the higher threshold6. The scheme does not distinguish between policies emanating from the EU e.g. the EPBD, and from national governments. We ran a preliminary model of dummy variables representing separately building efficiency policies emanating from the EU and those emanating from national governments in a model similar to Figure 5 and found insignificant results. This may be because of the large number of indigenous led policies, that often overlap with the time period in which the EPBD has existed. In addition, for a time series of twenty-five years, i.e. 1990-2015, the
6
In Filippini et al. (2014), the variable BH1 was for up to two policies in this sub-category were in place while BH2 was for more than two. That approach was probably motivated by a broader coverage – 27 EU countries – than ours.
* p<0.10, ** p<0.05, *** p<0.01 Standard errors in parentheses
(0.030) (0.026) (0.020) l_u_val 0.077** 0.076*** 0.077*** (1.21) (1.08) (1.51) l_t_int 1.16 1.12 1.10 (0.0025) (0.0023) (0.0027) year -0.0024 -0.0027 -0.0018 (0.15) (0.14) (0.16) l_dwe 0.70*** 0.71*** 0.66*** (0.078) (0.070) (0.087) l_hdd 0.95*** 0.95*** 0.95*** (0.056) (0.053) (0.042) l_inc 0.15*** 0.16*** 0.14*** (0.047) (0.041) (0.059) l_wap_sh -0.22*** -0.22*** -0.22*** (0.056) (0.050) (0.088) L.l_sh_tot 0.45*** 0.44*** 0.48*** FE GMM LSDVC (1) (2) (3)
11 EPBD is still relatively new and thus it may be premature to attempt to evaluate its impact at least at the macro EU level. In this vein, the European Commission notes that it is impossible to precisely segregate and quantify a specific contribution of the EPBD due to the broader economic context and other EU policies working in synergy with the EPBD and national measures (EC, 2016).
FIGURE 5:COEFFICIENTSCALCULATEDFORAMODELOFSPACEHEATINGENERGYDEMANDFORTHE RESIDENTIALSECTORINFRANCE,GERMANY,ITALY,SPAIN,UKANDSWEDENFROM1990TO2015THAT INCLUDESVARIABLESTHATCONTROLFORTHEEFFECTSOFREGULATORY(BH),FINANCIAL(FIN)AND INFORMATION(INFO)POLICIES.
* p<0.10, ** p<0.05, *** p<0.01 Standard errors in parentheses
(0.029) (0.026) (0.030) info4_sh 0.034 0.023 0.034 (0.022) (0.020) (0.021) info3_sh 0.039* 0.031 0.039* (0.024) (0.021) (0.025) fin4_sh -0.044* -0.045** -0.043* (0.019) (0.018) (0.024) fin3_sh -0.013 -0.018 -0.014 (0.029) (0.026) (0.029) bh4_sh -0.037 -0.042 -0.036 (0.023) (0.020) (0.023) bh3_sh -0.029 -0.027 -0.028 (0.0028) (0.0025) (0.0029) year -0.0048* -0.0046* -0.0043 (0.17) (0.15) (0.18) l_dwe 0.68*** 0.72*** 0.63*** (0.081) (0.070) (0.092) l_hdd 0.92*** 0.92*** 0.93*** (0.061) (0.055) (0.043) l_inc 0.19*** 0.19*** 0.18*** (0.049) (0.042) (0.060) l_wap_sh -0.17*** -0.17*** -0.16*** (0.059) (0.051) (0.080) L.l_sh_tot 0.42*** 0.42*** 0.45*** FE GMM LSDVC (1) (2) (3)
12
FIGURE 6:COEFFICIENTSCALCULATEDFORAMODELOFTOTALENERGYDEMANDFORTHERESIDENTIAL
SECTORINFRANCE,GERMANY,ITALY,SPAIN,UKANDSWEDENFROM1990TO2015THATINCLUDES VARIABLESTHATCONTROLFORTHEEFFECTSOFREGULATORY(BH),FINANCIAL(FIN),INFORMATIVE(INFO) ANDAPPLIANCES(APP).
For the model presented in Figure 5, the only sub categories of efficiency policy that are significant are those for where there is more than one financial policy in place. This result echoes that of Filippini et al (2014) who concluded that financial policies had the most impact on reducing energy demand. An explanation for this can be that financial policies can have an instantaneous impact in the year they are enacted, i.e. they are available to all households, whereas regulations only apply to newly built houses so take a number of years to have an impact across the building stock. Figure 5 also shows Informative policies to be significant but with the wrong polarity thus rendering their coefficients meaningless – a
* p<0.10, ** p<0.05, *** p<0.01 Standard errors in parentheses
(0.019) (0.019) (0.021) app4_tot -0.0086 -0.0047 -0.0087 (0.013) (0.012) (0.014) app3_tot 0.0080 0.0065 0.0079 (0.017) (0.016) (0.017) info4_tot 0.028 0.030* 0.027 (0.016) (0.015) (0.017) info3_tot 0.014 0.0046 0.014 (0.013) (0.012) (0.014) fin4_tot -0.011 -0.0070 -0.011 (0.011) (0.011) (0.013) fin3_tot 0.021* 0.022** 0.020 (0.017) (0.017) (0.017) bh4_tot -0.086*** -0.082*** -0.085*** (0.013) (0.012) (0.013) bh3_tot -0.041*** -0.041*** -0.040*** (0.0016) (0.0015) (0.0016) year -0.0023 -0.0028* -0.0020 (0.13) (0.12) (0.13) l_dwe 0.92*** 0.90*** 0.88*** (0.045) (0.042) (0.051) l_hdd 0.42*** 0.43*** 0.42*** (0.035) (0.036) (0.026) l_inc 0.058* 0.077** 0.057** (0.031) (0.029) (0.039) l_wap_tot -0.28*** -0.27*** -0.27*** (0.059) (0.056) (0.077) L.l_tot 0.28*** 0.27*** 0.30*** FE GMM LSDVC (1) (2) (3)
13 result Filippini et al (2014) also obtained. Removing insignificant policy variables and rerunning the model did not change results in any meaningful way. The results in Figure 5 show that the UEDT (year) is only significant at the 10% level. Its absolute value is similar to that found in Figure 2, as are the
coefficients for price, income, climate and the number of dwellings. This suggests that the UEDT is capturing other efficiency improving effects not accounted for in the policy variables included in the model.
Figure 6 presents results for a model of total energy demand in the residential sector. Differences with the results presented for space heating demand in Figure 5 are that the coefficients of building
regulations are significant. In addition, an additional policy sub category, policies that focus on efficiency of electrical appliances and lighting i.e. specific electricity use, have also been included (app) but are found not to be significant. Having one financial policy in place is found to be significant but with the wrong polarity. Another difference is that the income elasticity is much lower for space heating demand.
SUMMARY AND FURTHER WORK
We conducted a preliminary investigation into how energy efficiency policies in place across the EU have reduced energy demand in the period 1990-2015 for countries that make up over 65% of demand. We did so using panel data econometrics combining various datasets. We find that policies that provide finance and subsidies for efficiency measures and building regulations – as represented by U-Values – have had a significant impact on reducing energy demand. However, regulations did not seem to have a significant impact on space heating (Figure 5). This can be explained by the fact that it takes a number of years for regulations and building codes to penetrate through the building stock, which could be explored by introducing various lag structures.
ACKNOWLEDGEMENTS
This work is funded by the Swedish Research Council for Sustainable Development, FORMAS, under project number 2016-00371.
REFERENCES
Ademe, (2013). Energy Efficiency Policies in the EU - Lessons from the Odyssee-Mure Project.
http://www.ademe.fr/sites/default/files/assets/documents/89109_7860-energy-efficiency-policies-in-eu.pdf
Anderson, T. W. and C. Hsiao. 1982. Formulation and estimation of dynamic models using panel data. Journal of Econometrics 18: 570–606.
Arellano, M. and S. Bond. 1991. Some tests of specification for panel data: Monte Carlo evidence and an application to employment equations. Review of Economic Studies 58: 277–297.
14 Bigano A, Arigoni-Ortiz R, Markandya A, Menichetti E, Pierfederici R (2011). The linkages between energy efficiency and security of energy supply in Europe. In: Galarraga I, González-Eguino M, Markandya A, editors. Handbook of sustainable energy. Northampton: Edward Elgar Publishing Ltd.; 2011. p. 60–83. EC, 2010. Directive 2010/31/EU of the European parliament and of the council of 19 may 2010 on the energy performance of buildings (recast).
EC, 2016. Evaluation of Directive 2010/31/EU on the energy performance of buildings. SWD(2016) 408 final.
EC, 2017a: 2030 climate & energy framework
https://ec.europa.eu/clima/policies/strategies/2030_en EC, 2017b: Energy Efficiency Directive
https://ec.europa.eu/energy/en/topics/energy-efficiency/energy-efficiency-directive EC, (2018). Update to Energy Efficiency Directive:
http://data.consilium.europa.eu/doc/document/PE-4-2018-INIT/en/pdf
Enerdata. Odyssee Database. Enerdata, Grenoble, France; 2017 <http://www. odyssee-indicators.org>. EEW (2013). Improving and implementing national energy efficiency strategies in the
EU framework. Energy Efficiency Watch; 2013. <http://energy-efficiencywatch. org/fileadmin/
Eurostat, 2017. http://ec.europa.eu/eurostat/data/database
Euraktiv, 2017: EU lawmakers back 40% energy efficiency target for 2030
https://www.euractiv.com/section/energy/news/meps-back-more-ambitious-energy-efficiency-target/ Filippini M, Hunt L, Zoric J (2014). Impact of energy policy instruments on the estimated level of
underlying energy efficiency in the EU residential sector. Energy Policy 2014; 69:73–81. http://dx.doi.org/10.1016/j.enpol.2014.01.047.
Geller H, Harrington P, Rosenfeld AH, Tanishima S, Unander F. Polices for increasing energy efficiency: thirty years of experience in OECD countries. Energy Policy 2006;34:556–73.
http://dx.doi.org/10.1016/j.enpol.2005.11.010.
Gillingham K, Newell RG, Palmer K. Energy efficiency economics and policy. Annual Rev Resour Econ 2009;1:597–620. http://dx.doi.org/10.1146/ annurev.resource.102308.124234.
Isinnova (2017). MURE II Database on energy efficiency policies and measures. Rome, Italy: Isinnova; 2017 <http://www.measures-odyssee-mure.eu/>.
Judson, R. A. and A. L. Owen. 1999. Estimating dynamic panel data models: a guide for macroeconomists. Economics Letters 65: 9–15.
15 Kiviet, J. F. 1995. On bias, inconsistency, and efficiency of various estimators in dynamic panel data models. Journal of Econometrics 68: 53–78
Mata É, Sasic Kalagasidis A, Johnsson F, (2013) A modelling strategy for energy, carbon, and cost assessments of building stocks, Energy and Buildings; 56: 100-108
https://doi.org/10.1016/j.enbuild.2012.09.037
Nickell, S. J. 1981. Biases in dynamic models with fixed effects. Econometrica 49: 1417–1426.
Ó Broin E, Nässén J, Johnsson F (2015). Energy efficiency policies for space heating in EU countries: A panel data analysis for the period 1990–2010. Applied Energy 150 (2015) 211–223.
http://dx.doi.org/10.1016/j.apenergy.2015.03.063
Saussay A, Saheb Y, Quirion P (2012). The impact of building energy codes on the energy efficiency of residential space heating in European countries—a stochastic frontier approach. In: International Energy Program Evaluation Conference, 12–14 June 2012, Rome, Italy.