HAL Id: hal-00468747
https://hal.archives-ouvertes.fr/hal-00468747
Submitted on 31 Mar 2010
HAL is a multi-disciplinary open access
archive for the deposit and dissemination of
sci-entific research documents, whether they are
pub-lished or not. The documents may come from
teaching and research institutions in France or
abroad, or from public or private research centers.
L’archive ouverte pluridisciplinaire HAL, est
destinée au dépôt et à la diffusion de documents
scientifiques de niveau recherche, publiés ou non,
émanant des établissements d’enseignement et de
recherche français ou étrangers, des laboratoires
publics ou privés.
Complementary source information cooperation within a
decision system for crop monitoring
Mohammad El Hajj, Serge Guillaume, A. Bégué
To cite this version:
Mohammad El Hajj, Serge Guillaume, A. Bégué. Complementary source information cooperation
within a decision system for crop monitoring. Proceedings of the joint IFSA-EUSFLAT, 2009
Inter-national Fuzzy Systems Association World Congress and 2009 European Society of Fuzzy Logic and
Technology Conference, Jul 2009, Lisbonne, Portugal. p. 1496 - p. 1501. �hal-00468747�
Complementary source information cooperation within a decision
system for crop monitoring
Mahmoud El Hajj
1Serge Guillaume
2Agnès Bégué
31 NOVELTIS, Ramonville Saint-Agne, F-31520 France 2 Cemagref, UMR ITAP, Montpellier, F-34196 France
3 CIRAD, UMR TETIS, Montpellier, F-34093 France
Email: [email protected], [email protected], [email protected]
Abstract— Multi-source information fusion usually deals with
redundant sources; the goal is to aggregate decisions, or evidence which supports one or another class. Many frameworks are then available: OWA, fuzzy integrals, etc. In this paper we are interested in managing complementary information sources. The integration is done using a fuzzy rule base. The rules are generated using a fuzzy decision tree algorithm. The application consists in the design of a crop harvest monitoring system. The three information sources are a time series of satellite images, a crop growth model and expert knowledge. The results show that the system is ready to use in an operational way.
Keywords— Crop growth modeling, Decision, Expert
knowledge, Fuzzy rules, Learning, Remote sensing.
1
Introduction
Over the past decade, time series of satellite images acquired at high spatial resolution have proven to be an important source of information for different agricultural applications. Several authors have recognized the benefits of this kind of data for monitoring agricultural lands [1], classifying land cover [2-4], mapping seasonal patterns and crop rotations [5, 6], and for many other uses (see papers collected in [7, 8]).
Nevertheless, the quantity of information extracted from time series of optical images is often restricted by several factors: acquisition gaps, atmospheric conditions, imperfect radiometric normalization, radiometric confusion, etc. Therefore, to make credible decisions, this information needs to be supplemented with data from other sources.
Let us focus on the sugarcane industry. One of its principal needs is to have continuous information about the harvest progress throughout the season. Such information helps increasing the effectiveness in fields and factory. The main method reported in the literature, to monitor the sugarcane harvest is based on a multispectral classification [9-11]. The major limitations of this method are the subjectivity and the considerable time to invest in the photo-interpretation phase and the confusion between the various states of a sugarcane field when the gap between two released images is important (more than 2 months). Since the harvest campaign extends over several months, it is difficult in some cases to distinguish
between a standing crop and the regrowth in a field harvested at the beginning of the season.
In order to improve and automate the monitoring of sugarcane harvest using time series of high spatial resolution satellite images, it is necessary to develop a new method that process the time series in co-operation with other sources. This co-operation allows compensating for the possible lack of data in the time series of images by the integration of temporal and environmental constraints.
As the sources are complementary and of different nature, usual frameworks of fusion information cannot be used. In this paper we propose to make the source integration within a fuzzy inference system. Next section introduces the study site and the data used. The characteristics of the three information sources are presented in section 3. Section 4 describes the fuzzy inference system and section 5 goes into detail of the experiments. The last section deals with concluding remarks.
2
Study site and data sets
The study site consists of two sugarcane farms located in the north-east part of Reunion Island, which is a small territory of ~2,500 km² in the Indian Ocean (21°7' to 19°40' S, 55°13' to 61°13' E), where sugarcane is the main crop. The first farm is at an average altitude of 70 m and includes 33 fields with an average size of 5.4 ha. The second farm is at an altitude ranging from 400 to 700 m, and has 46 fields with an average size of 3.5 ha. As the study area is located in a tropical zone, the year is divided into two seasons: a hot rainy season from November to April, and a cool dry season from May to October. The satellite data set used in this study consists of 18 SPOT5 images acquired over Reunion Island between January 10th, 2003 and December 7th, 2004. Both SPOT5 instruments (HRG1 and HRG2) acquire radiation in four spectral bands1 with high spatial resolution: 10 m for the Green, Red, and Near Infra-Red (NIR) bands, and 20 m for the Short Wave Infra-Red (SWIR) band. The images belong to the Kalideos-ISLE REUNION database
1
Green (0.50 - 0.59 µm), Red (0.61 - 0.68 µm), Near Infra-Red (0.78 - 0.89 µm), Short Wave Infra-Red (1.58 - 1.75 µm).
set up by the CNES2 [12, 13]. All images were ortho-rectified and co-registered to the UTM coordinate system (zone 40 South) with a root mean square error of less than 0.5 pixel per image.
The radiometry of the images was corrected so that pixel values represent the top of canopy reflectances in the four spectral bands [14, 15]. Cloud mask was available for each image.
Block field boundaries for all Reunion Island were provided by the DDAF3 and were refined by the CIRAD4 to define the boundaries of each field in the study site. Daily climatic data recorded at La Mare meteorological station near the two sugarcane farms were collected for the period covered by the satellite time series. These data are daily estimations of rainfall (mm), potential evapo-transpiration (mm), global radiation (J/m2), and minimum, maximum and mean temperature values (°C). Climatic data were required to run the crop growth model.
A ground truth database was built by using harvest dates reported by farmers for each field during the 2003 and 2004 harvest campaigns. This database indicates the status of each field (whether it was harvested or not) between each pair of consecutive satellite acquisition dates in the time series.
3
Three information sources
3.1 SPOT5 time series
The time series of SPOT5 images are the principal source of information. By using field boundaries, the temporal profiles of reflectances in the four spectral bands, Green, Red, NIR and SWIR, were extracted from the images for each field in the study site. This extraction was carried out by calculating the average value of field pixels in each spectral band. The calculation was done after discarding cloud pixels using the cloud masks. Temporal profiles of NDVI (Normalized Difference Vegetation Index) where then calculated for each field using reflectance values in the Red, ρRed, and NIR, ρNIR, bands:
Red NIR Red NIR ρ + ρ ρ ρ = NDVI − (1)
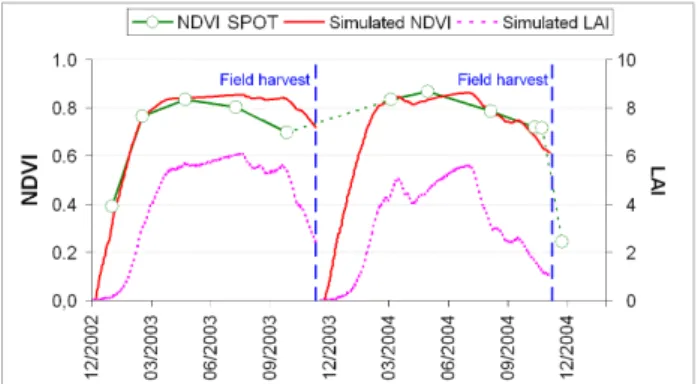
The temporal profile of NDVI provides useful information about the actual field status, and about its different historical stages. In general, this profile can be divided into two periods: a period in which NDVI values increase, corresponding to the vegetative development of the field crop, and another period with steady or decreasing values, corresponding to the maturation phase. Fig.1 shows an example of the temporal profile of a sugarcane field NDVI, extracted from a time series of SPOT5 images acquired with high temporal repeatability.
2
Centre National d'Etudes Spatiales ; French Spatial Agency.
3
Direction Départementale de l'Agriculture et de la Forêt ;
Departmental Directorate of Agriculture and Forestry. 4
Centre de coopération Internationale en Recherche Agronomique pour le Développement ; French Agricultural
3.2 Sugarcane growth model
To cope with missing data or cloudy images, the sugarcane growth model MOSICAS [16] was used. It provides information on the field harvest possibility that is independent of the satellite images and based essentially on climatic data. This information is particularly interesting when the gap between two cloud-free satellite images is more than two months.
MOSICAS is a dynamic model that estimates the growth of the sugarcane on a daily time scale by using climatic and biophysical data of the environment of the sugarcane field. It allows the simulation of LAI (Leaf Area Index) profiles (Fig.1) that can be converted into NDVI profiles using a linear model [17]. An illustration of such a simulated profile is plotted in Fig.1. From the simulated NDVI temporal profiles, we build a helpful indicator for harvest detection: this indicator represents the nominal time required (in days) to reach a given threshold of NDVI starting with a given harvest date.
Figure 1: Example of temporal profiles of a sugarcane field NDVI extracted from SPOT5 time series, as well as NDVI and LAI temporal profiles simulated using the sugarcane growth model MOSICAS.
3.3 Expert Knowledge
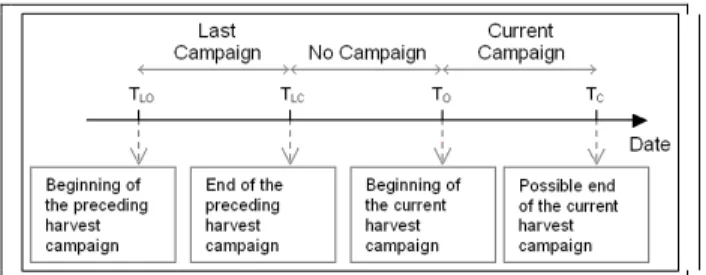
The third source of information is the knowledge about phenological stages of the sugarcane, as well as its cropping system. This knowledge allows a better understanding of the relationship between the dynamics of the signals extracted from the satellite image time series and the sugarcane field status; it offers also very useful temporal constraints that particularly help in making decisions when there is a lack of satellite data. Examples of parameters defining these temporal constraints are the nominal length of the sugarcane cycle and the dates of opening and closing of the sugar factories which determine the harvest campaigns, as illustrated in Fig.2.
Various variables are built from the three information sources and used as inputs of the decision system. The inputs are divided into three main groups:
- The first group (4 inputs) is based on the NDVI and SWIR values calculated at field scale using each satellite image.
- The second group (5 inputs) relates to the dynamics in the temporal profiles of NDVI and SWIR.
- The third group (5 inputs) represents the temporal constraints resulting from the sugarcane growth model
Figure 2: Temporal intervals used for the classification of image acquisition dates. TLO, TLC, TO and TC are opening
and closure dates of the preceding and the current campaign respectively.
A thorough description of the inputs can be found in [18].
4
Decision system
The information coming from the three sources (SPOT5 time series, sugarcane growth model and expert knowledge) is heterogeneous and of different nature. The information extracted from the SPOT5 images is based on reflectance “measurements”. The sugarcane model provides “estimates” using parameters that are not directly connected to the studied phenomenon (i.e. the field harvest). Expert knowledge contribution is neither “measurements” nor “estimates”. Another important characteristic to highlight is that the sources are not redundant but complementary. That means that none of them is able to make a decision on its own; the cooperation is needed within the decision process. This discards usual aggregation techniques such as votes, OWA or fuzzy integrals. The general framework used to combine the different and complementary information sources is a fuzzy inference system.
The rules are of the following form: “if X Then Y”, e.g.
Rule1: if x1 is A1 1 and x2 is A2 1 … and xn is An 1 then y is B1
Rule2: if x1 is A12 and x2 is A22 … and xn is An2 then y is B2
:
Ruler: if x1 is A1r and x2 is A2r … and xn is Anr then y is Br
(2)
where Akr is the fuzzy set of the kth input variable
involved in the rule r, and Br is the conclusion of the rth
rule.
The rule conclusion is a symbolic label, related to the field status. Two are possible: H (harvested) or NH (not harvested).
For each input universe a partition is defined. Some of the input partitions are crisps (see Fig.2), the other are fuzzy. In this case, we built standardized partitions according to expert knowledge. Fig.3 illustrates the fuzzy sets of NDVI and an example of NDVI profiles plotted according to thermal time for several sugarcane fields. NDVI fuzzy sets were designed according to expert knowledge about the phenology and field status of sugarcane as well as about its NDVI temporal profiles. Linguistic labels are related to the NDVI:
- “Low” NDVI values (< 0.30) generally correspond to residues and bare soil after field harvesting.
- “Medium” NDVI values (between 0.30 and 0.75) are observed in the growth and senescence phases. The growth phase is characterized by an accumulation of biomass and an increasing length of the stems. The senescence is caused by the sugarcane ageing, the reduction in the temperature and the lack of water.
- “High” NDVI values (>0.75) are obtained at the end of the growth stage and before senescence. In this phase sugarcane fields are well developed and green covered.
The inference technique used in our system is based on Mamdani's method [19]. The weight attributed to the conclusion of an activated rule is calculated by combining the membership degrees of rule premises in a conjunctive way using the min operator. The aggregation of the distinct conclusions of the activated rules is done in a disjunctive way using the max operator.
Once system inputs and output as well as inference parameters are defined, the last step is reasoning rule description. In a previous version [18], the rules were defined according to expert knowledge. 116 rules were needed to cover all possible situations. The system proved to be accurate. A comparison between fuzzy and crisp partitions showed that the former ones increase a 15% the overall accuracy. The rules can also be generated by an automatic procedure. A fuzzy decision tree induction algorithm, which is a fuzzy extension of the well known ID3 algorithm [20], is used. The main advantage of the decision trees is to generate incomplete rules, only defined by a subset of the available input variables. The generated rules are informative for experts to the condition that the partitioning is carefully defined. The Fispro [21] implementation is used with the partitions proposed by the experts, those which proved efficient in the expert fuzzy system.
Figure 3: NDVI profiles plotted according to thermal time for several sugarcane fields. On the right are the fuzzy sets of NDVI-defined inputs.
5
Results and discussion
The learning process includes a cross validation. It has been carried out with various configurations to assess the system sensitivity to important parameters: the size of the training set and the number of satellite images per year. Finally, the contribution of each of the information sources is evaluated.
The data set has been randomly split to build training and test sets. For each proportion, the given result is the
Figure 4: System performances using different percentages of training set (OA: overall accuracy; PA Harvested and PA Not Harvested: producer's accuracy for the two classes "Harvested" and "Not Harvested" respectively). These performances are obtained from confusion matrices.
average of ten runs. Nine percentages have been tested for the training set: 10%, 20%, 30%, 40%, 50%, 60%, 70%, 80% and 90%. The performance is measured over the test set.
Fig.4 shows the average values and the standard deviations (for ten iterations) of the overall accuracy (OA) of the system and the producer’s accuracy for the classes “Harvested” and “Not Harvested” (PA Harvested and PA Not Harvested, respectively). Let's notice that the performance for the Not Harvested decision is quite independent from the size of the training set, while the Harvested one increases with the sample size. This is due to the respective proportions of both cases in a given image: the not harvested fields are much more numerous than the harvested ones. So, only a small number of images is needed to learn the not harvested case.
The other key parameter related to system robustness, is the number of available images. It is likely to vary from a year to another because of the lack of acquisition or cloudy weather which makes unusable the satellite images.
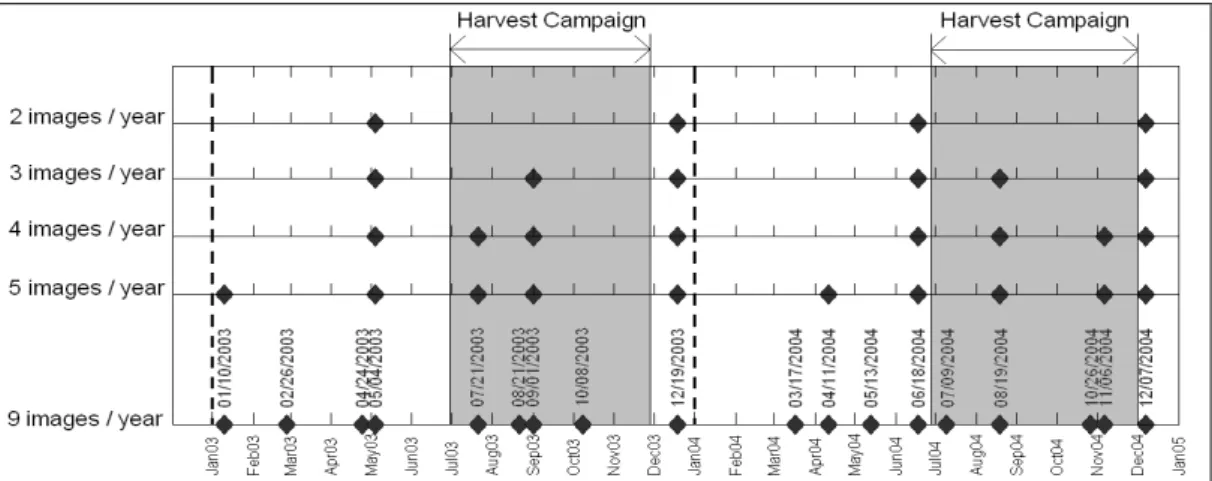
Fig.5 shows the selected images for each of the studied years. The selection takes into account the campaign organisation. For instance, in the case of 3 images per
Figure 6: System performances according to the number of satellite images per year. (OA: overall accuracy; PA Harvested and PA Not Harvested: producer's accuracy for the two classes "Harvested" and "Not Harvested" respectively).
year, one is chosen before, the other between and the last one after the harvest campaign.
Fig.6 shows that the system performance is still acceptable even when the number of images per year drops to 3.
The number of generated rules also evolves with the number of images per year. It reaches an average of 38 for the 5 image configuration as shown in Fig.7.
Figure 7: Number of induced rules according to the number of satellite images per year. Histogram bars represent the average values for the different training sets, and error bars the standard deviation.
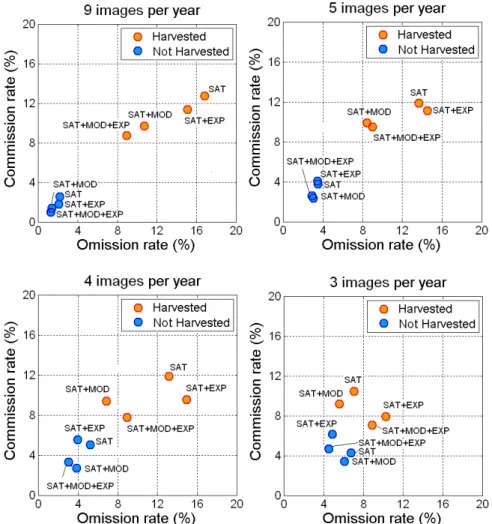
To assess the information source contribution three sets of input variables have been considered:
- SAT: the set of input variables that are related to the information extracted from the satellite images;
- MOD: the set of input variables built using the sugarcane growth model;
- EXP: the set of some input variables dealing with expert knowledge. Although the expert knowledge is difficult to isolate since it contributes to the design of the whole system, some variables are only related to this sources. They are encoding agronomic knowledge such as the nominal cycle length.
Four combinations have been tested and the results are reported in Fig.8. The best ones are the closest to the origin. As expected, all of them include SAT and MOD, and in most cases, the best one is SAT+MOD+EXP. The sugarcane growth model contribution is interesting to analyze for each of the two classes “Harvested” and “Not Harvested”. Fig.9 shows that it is higher in the harvested case. This result was expected: there is no need of a growth model to label a field as not harvested. The essential role of the model is to remove potential ambiguity concerning harvested fields.
6
Conclusions
This paper presented a novel approach for dealing with time series of optical satellite images used for crop monitoring. Data extracted from time series were combined with information from crop model output and expert knowledge, in order to make credible decisions. The description of the approach was done using an application example of sugarcane harvest monitoring with a SPOT5 time series. A decision system designed and implemented for automatic harvest detection was described.
Results obtained when evaluating the system were in substantial agreement with ground truth data; the overall accuracy reached 96.07%. The next step concerning the sugarcane application consists in examining the robustness of the automatically generated rules by testing the system at other sites and in other years.
The approach outlined in this paper is generic and very promising. Many models that simulate the growth of the main annual crops exist (e.g., STICS [22]), and expert knowledge about these crops could be obtained easily either from farmers or from agronomic knowledge bases [23].
Figure 8: System performances obtained for different image frequencies by using different combinations of information sources.
Figure 9: Crop growth model contribution in the system performances (PA Harvested and PA Not Harvested: producer's accuracy for the two classes "Harvested" and "Not Harvested" respectively). Histogram bars represent the average values for the different training sets, and error bars the standard deviation.
The combination of crop model outputs and expert knowledge with time series of high spatial-resolution satellite-images seems to be an excellent tool for crop monitoring.
Acknowledgment
We would like to thank Hélène de Boissezon and Sébastien Garrigues (CNES) for their help and support. We would also like to thank the CNES for funding the Kalideos database (http://kalideos.cnes.fr) and for generously providing the SPOT5 images.
References
[1] M. Pax-Lenney and C. E. Woodcock, "Monitoring agricultural lands in Egypt with multitemporal landsat TM imagery: How many images are needed?," Remote
Sensing of Environment, vol. 59, pp. 522-529, 1997.
[2] G. A. Ippoliti-Ramilo, J. C. N. Epiphanio, and Y. E. Shimabukuro, "Landsat-5 Thematic Mapper data for pre-planting crop area evaluation in tropical countries,"
International Journal of Remote Sensing, vol. 24, pp.
1521-1534, 2003.
[3] C. S. Murthy, P. V. Raju, and K. V. S. Badrinath, "Classification of wheat crop with multi-temporal images: Performance of maximum likelihood and artificial neural networks," International Journal of Remote Sensing, vol. 24, pp. 4871-4890, 2003.
[4] M. D. Turner and R. G. Congalton, "Classification of multi-temporal SPOT-XS satellite data for mapping rice fields on a West African floodplain," International
Journal of Remote Sensing, vol. 19, pp. 21-41, 1998.
[5] J. A. Martinez-Casasnovas, A. Martin-Montero, and M. A. Casterad, "Mapping multi-year cropping patterns in small irrigation districts from time-series analysis of Landsat TM images," European Journal of Agronomy, vol. 23, pp. 159-169, 2005.
[6] S. Panigrahy and S. A. Sharma, "Mapping of crop rotation using multidate Indian Remote Sensing Satellite digital data," ISPRS Journal of Photogrammetry and Remote
Sensing, vol. 52, pp. 85-91, 1997.
[7] L. Bruzzone and P. Smits, "Analysis of Multi-temporal Remote Sensing Images : Multitemp 2001," in Series in
remote sensing, vol. 2, A. P. Cracknell, Ed.: World
Scientific Publishing Co. Pte. Ltd., 2002, pp. 440. [8] P. Smits and L. Bruzzone, "Analysis of Multi-temporal
Remote Sensing Images : MultiTemp 2003," in Series in
remote sensing, vol. 3, A. P. Cracknell, Ed.: World
Scientific Publishing Co. Pte. Ltd., 2004, pp. 387. [9] C. Gers and E. Schmidt, "Using SPOT4 satellite imagery
to monitor area harvested by small scale sugarcane farmers at Umfolozi," presented at 75th South African Sugar Technologists' Association (SASTA), 2001. [10] E. Bappel, A. Bégué, P. Degenne, V. Lebourgeois, and B.
Siegmund, "Real time sugarcane harvest monitoring using SPOT4&5 satellite data," presented at Proceedings of International Society of Sugar Cane Technologists (ISSCT), Guatemala, 2005.
[11] A. Bégué, P. Degenne, A. Pellegrino, P. Todoroff, and F. Baillarin, "Application of remote sensing technology to monitor sugar cane cutting and planting in Guadeloupe (French West Indies)," presented at Geomatica, Cuba, 2004.
[12] H. DeBoissezon and A. Sand, "Reference Remote Sensing Data Bases: Temporal series of calibrated and ortho-rectified satellite images for scientific use," presented at Proceedings of Recent Advances in Quantitative Remote Sensing, Valencia, Spain, 2006.
[13] http://kalideos.cnes.fr, "Images Spot: copyrigth CNES, Distribution Spot Image," 2007.
[14] M. El Hajj, A. Bégué, B. Lafrance, O. Hagolle, G. Dedieu, and M. Rumeau, "Relative radiometric normalization and atmospheric correction of a SPOT 5 time series," Sensors, vol.8, pp. 2774-2791, 2008.
[15] M. El Hajj, M. Rumeau, A. Bégué, O. Hagolle, and G. Dedieu, "Radiometric normalization of high spatial resolution multi-temporal imagery: A comparison between a relative method and atmospheric correction," presented at Proceedings of SPIE Europe Remote Sensing - The International Society for Optical Engineering, Florence, Italy, 2007.
[16] J. F. Martiné and P. Todoroff, "Le modèle de croissance Mosicas et sa plateforme de simulation Simulex: état des lieux et perspectives," Revue Agricole et Sucrière de l'Ile
Maurice, vol. 81, pp. 133-147, 2002.
[17] M. El Hajj, A. Bégué, and S. Guillaume, "Multi-source information fusion: Monitoring sugarcane harvest using multi-temporal images, crop growth modelling, and expert knowledge," presented at MULTITEMP-2007, Fourth International Workshop on the Analysis of Multi-Temporal Remote Sensing Images, Provinciehuis Leuven, Belgium, 2007.
[18] M. El Hajj, A. Bégué, S. Guillaume, and J. F. Martiné, "Integrating SPOT-5 time series, crop growth modeling and expert knowledge to monitor agricultural practices - Case of sugarcane harvest on Reunion Island," Accepted
in Remote Sensing of Environment, 2009.
[19] E. H. Mamdani and S. Assilian, "Experiment in linguistic synthesis with a fuzzy logic controller," International
Journal of Man-Machine Studies, vol. 7, pp. 1-13, 1975.
[20] J.R. Quinlan, "Induction of decision trees," Machine
learning, vol.1, pp. 81-106, 1986.
[21] S. Guillaume, B. Charnomordic, and J.-L. Lablée, "FisPro: An open source software for fuzzy inference systems," http://www.inra.fr/internet/Departements/MIA/M/fispro/, Ed.: INRA-Cemagref, 2002.
[22] INRA, "STICS : Simulateur mulTIdisciplinaire pour les Cultures Standard," http://www.avignon.inra.fr/stics/. [23] G. Russell, R. I. Muetzelfeldt, K. Taylor, and J. M. Terres,
"Development of a crop knowledge base for Europe,"
European Journal of Agronomy, vol. 11, pp. 187-206,