HAL Id: hal-00856762
https://hal.archives-ouvertes.fr/hal-00856762
Submitted on 2 Sep 2013HAL is a multi-disciplinary open access
archive for the deposit and dissemination of sci-entific research documents, whether they are pub-lished or not. The documents may come from teaching and research institutions in France or abroad, or from public or private research centers.
L’archive ouverte pluridisciplinaire HAL, est destinée au dépôt et à la diffusion de documents scientifiques de niveau recherche, publiés ou non, émanant des établissements d’enseignement et de recherche français ou étrangers, des laboratoires publics ou privés.
in small farms
D. Deurveilher, Frédéric Chiroleu, M. Chanet, J.P. Chanet, D. Boffety
To cite this version:
D. Deurveilher, Frédéric Chiroleu, M. Chanet, J.P. Chanet, D. Boffety. ICT for traceability of sugar-cane harvesting operations in small farms. CIGR-Ageng 2012. International Conference on Agricul-tural Engineering, Jul 2012, Valencia, Spain. 6 p. �hal-00856762�
ICT for traceability of sugarcane harvesting operations
in small farms
D. Deurveilher1, F. Chiroleu2, M. Chanet3, J.P. Chanet3*, D. Boffety3
1
UR SCA, CIRAD, 7, chemin de l'Irat, 97410 Saint Pierre, France
2UMR PVBMT, CIRAD, Pôle de Protection des Plantes,
7 chemin de l’Irat, 97410 Saint Pierre, France
3UR TSCF, Irstea, 24 avenue des Landais, BP 50085, Aubière Cedex, France
*Corresponding author. E-mail: jean-pierre.chanet@irstea.fr Abstract
The purpose of our work is to analyze different harvesting solutions in different situations in order to provide players of the sugarcane sector viable solutions in the context of Réunion island. Two sugarcane harvesters, with different technologies have been instrumented in order to trace the various phases of work and better understand the operating conditions of machines in collective management. The embedded sensors could discriminate and localize the various stages of the harvest operations. The data collected were stored in a data logger on the machine and could be downloaded via a GPRS connection to a server. Data were daily recorded on the machine throughout the harvesting campaign (5 months). Once the data acquired, their processing with the R software and their linkage with other data (i.e. economic) collected during the harvest campaign give us different information that are integrated in a GIS. With the developed tools, we can produce references at different spatiotemporal scales: parcels / production areas, daily / annually.
Key words: harvesting operations, Traceability, ICT, GPS. 1. Introduction
The uncertainties of the economic world and especially the agricultural market require with the companies to be more efficient. However, all territories do not have the same production conditions and therefore they do not have the same production costs. The insular areas, like Réunion island, are increasingly facing with the production of many farms employing intensive production practices of those countries with low costs labour. As the European grants decrease, it will be increasingly difficult to keep a local agricultural production in the Reunion if the farms are subject to the laws of the global market. The stakes are very important because in these island areas, agriculture plays more roles than only the food production one (Martignac 2004).
The cultivation of sugarcane has several roles in the island (Lejars and Siegmund 2004): economic, social, energy, landscaping, environmental. Farms are generally small ones: 86% of them have less than 10 ha. Sugarcane is produced on small parcels often in relief, due to the profile of the mountainous island (see Figure 1). In addition to these handicaps, in recent decades, the island is facing a problem of manpower for agricultural activities, especially for the harvesting of sugarcane. In long term, this problem may cause the decrease of the number of sugarcane cultivated parcels and therefore the production chain could be severely disrupted.
In an effort to find alternatives to hand harvesting and to revitalize the industry, the local agricultural organisations have experienced in recent decades several mechanical harvesting technologies. These represent a costly investment for local small sugarcane producers. In this situation, the solution of collective management of harvesting equipment was tested in groups of several farms located in same sugarcane supply areas. Despite this effort to pool ressources, investments are difficult to be profitable. The causes are due to multiple constraints that exist at several spatial and temporal scales. The understanding of these constraints requires the acquisition of references and information on the harvesting process
on the different areas. These information are not available because the mechanization process of the harvest in the small-scale farms is just beginning (Le Gal et al. 2004).
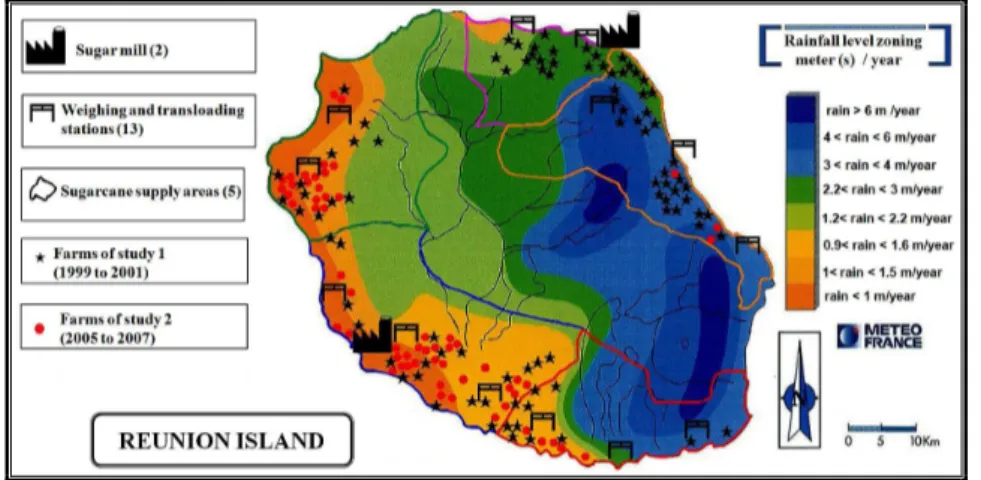
Figure 1: Sugarcane production areas on Réunion island
The purpose of our study is to examine two harvesting technologies for identifying and quantifying the whole set of linked constraints. The objective is to propose implementations of corrective actions to achieve optimal management of harvesting operations of sugarcane. For this, we experiment a traceability tool including the embedded equipments on the harvest machine with Information and Communication Technologies (ICT), GIS (Geographic Information System) tools and more traditional sources of information. Studies have been made on the traceability of mechanized agricultural operations (Thirion et al. 1999; Chanet et al. 2005) even for sugarcane harvester (Magalhães and Cerri 2007). However, our objectives are not the same, because we want to use local informations collected on the harvest machine to globally analyse of the sugarcane harvesting at the scale of the different areas and not only for the understanding of the unit harvesting operation.
To sum up, our objectives are:
• the creation of a database containing geolocalized data about each followed harvest; • the classification of harvest according to their economic performances with their
representation in a GIS linked with the database;
• the definition of one or more “reference harvest” for each harvesting technology studied from the collected data in the different production conditions;
• the identification of the causes of poor performance harvests from crop performance indicators contained in “reference harvest”;
• the annual assessment of the technical and economic performances of the harvesting chain based on its profitability;
• the definition of a harvest management method for each mechanized technology within a group of farmers arranged in one or more sugarcane areas. This management method must be reproducible in the other spatial scales, under identical conditions.
The paper presents in the section 2 the embedded equipments on the harvest machine and the methods used to process the data. The section 3 introduces the results and the discussion. Finally, we conclude our study in section 4.
2. Materials and methods
2.1. Different scales of information for the traceability of sugarcane harvesting operation After studying economic forecasting investment, the profitability of the harvesting machine is controlled during the sugarcane harvesting campaign in two ways: i) Daily: based on the tonnage of cane harvested on one area; ii) Annually: the accumulated daily tonnage collected on all parcels of the harvest. In both cases, minimum production goals must be achieved.
Based on these objectives, our studies have been directed towards two spatiotemporal scales traceabilities:
• Time scales: daily traceability is made from 4 am to 8 pm. Annually traceability is the annual aggregation of daily ones over the period of the harvesting campaign.
• Spatial scales: the parcel for the day and all the parcel surface of the entire area for the campaign (mid July to mid December).
We consider two types of data for traceability: the seized ones and the captured by embedded devices ones.
The seized data are entered at the cooperative that manages the harvest. This set of information is composed with:
• the technical information: interventions on the machines, types of failure, etc., • the economic information like the annual cost of the harvester,
• the organizational information like observations on harvest,
• the administrative information: parcel ID, cooperative ID, harvester ID, etc., • the production information: the tonnage of sugarcane harvested each day. The information recorded by the embedded system are:
• the temporal information: the work time of the machine on the day,
• the spatial information: moving of the machine in the areas and the parameters measured on the harvested parcels (harvested area, geometry, etc.),
• the technologic information: the measured parameters of the machine (speed, etc.), • the production information like the output of the harvester on site.
2.2. The harvesting campaigns
To better understand the various constraints that affect the profitability of harvesting chains in small farms, we set up experimental sites in close cooperation with local agricultural cooperatives. These sites were selected on Réunion island, on the one hand according to the different conditions of production and labor problems encountered and, on the other hand, to test two different technologies of harvest chains.
These experiments were conducted in two studies at different periods:
• a first study (Study 1), from 1999 to 2001. The method of harvesting is the whole stalk cane and the two harvest machines used are from SIMON manufacturer. Two experimental sites were chosen, one in the east of the island and one in the west part of the island. This type of harvest machine is associated with a classic farm tractor and is designed to collect preferably the small and flat sugarcane field (slope max 25%). At both sites, the experiment was conducted on a sample of 73 farms.
• a second study (Study 2), from 2005 to 2007. The method of harvesting is cut cane into segments and the harvest machine used is a self-propelled sugarcane harvest machine (CAMECO CH3500). Two sites were involved in the experiment: one in the west of the island and the second one in the south. In a sample of 53 farms, the machine harvested in all production conditions except parcels in relief (slope > 10%) and wetland areas.
2.3. The embedded devices on harvest machine and the data processing
Several sensors are installed on the harvest machines : position of the cutting head, odometer, speed sensor, GPS, etc. Data were collected every 6 seconds and were stored in a Campbell data acquisition system. The Figure 2 shows the dedicated harvest machine CAMECO with its embedded equipments.
Figure 2: Embedded devices on sugarcane harvester
The embedded devices have collected the information of 457 harvesting operations (292 from Study 1 and 165 from Study 2). At the beginning, data were stored in a PCMCIA memory card and at the end of the experimentation, data were sent every days via GSM to the cooperative.
Raw data were processing according to the flow processing presented in Figure 3.
Figure 3: Data flow processing
3. Results and discussion
3.1. Daily informations on harvesting
The daily informations were synthesized in 47 variables that traced the activity of the harvest machine for each day of harvest (see Figure 4). All data were geolocalized and imported in the GIS. We obtained three kinds of geographic objects: i) polygons representing harvested areas; ii) lines representing the harvest trajectories and sugarcane rows; iii) dots for the positions of standby phases of the harvest machine. From the theoric daily break-even of the harvest machine (tonnes of sugarcane harvested per day) and the real tonnage collected at each harvest, we performed a thematic analysis in the GIS software to obtain a classification
into four levels of economic performance. This geolocalized classification of harvest as "Very Good", "Good," "Middle," "Bad" can qualify the different areas of production.
With this classification, we defined a "reference harvest" for the optimized management of the harvesting chain under well-defined conditions of production (yield / ha, topography, etc.). To define this reference harvest, we selected in the recorded information samples from several harvests rated "Very Good" or "Good" and with identical operating conditions. After statistical analysis, data from these samples were used to define the variables of the reference harvest. This reference site was considered as a "model" for the traceability of daily activities. The variables (temporal, spatial,!) calculated for a harvest could be compared to this "reference harvest" allowing a diagnosis for inefficient harvesting operations.
3.2 Information obtained for all campaigns
The aggregation of the daily harvest information allowed, at the end of the production cycle, to obtain a traceability of all annual activities of the sugarcane crop chain in the production areas. The analyzes provided the following annual information:
• the economic performances of the machine in the cluster harvest,
• the performances of harvests organization and/or the quality of the parcels through the analysis of time spent to harvest compared to time spent on other phases of machine: the travel to sites, the stanby phase, maneuvers, etc.,
• A "model" for optimal management of harvesting technology studied in a cooperative located in the harvesting areas. This "model" has been defined from the data analysis of displacement phases of the sugarcane harvest machine in the basins, combined with information on the “reference harvest” data and the economic requirements.
4.Conclusion
The data acquisition with embedded equipments on sugarcane harvester, is an interesting methodology for understanding multiscale constraints. The collected data could be used to understand local aspect of the harvesting process like the optimization of the harvest machine functioning, but they could also contribute to understand the global aspect of harvesting chain at the scale of production areas. Analyzes conducted at the GIS helped to understand better the optimization problems of the harvest machine movement in the production areas and in the sugarcane field. They also helped to better visualize the diversity of harvesting machines yields, often to a neighboring parcels to another. In these environments, currently, other harvesting technologies are being tested and traceable methods of this study could be used to obtain references. All the studies may lead to the establishment of a more global project to create a database for all harvesting technologies across Réunion island. After all, the database would be a very useful tool for various local organizations involved in the decision-making of the selection of harvest machine for different sugarcane production conditions. It would be also useful for a efficient reparcelling needed for a generalization of mechanical harvesting.
5. References
Chanet, J P, D Boffety, G André, T Humbert, P Rameau, A Amamra, G De Sousa, E Piron, K M Hou, and F Vigier. 2005. “Wireless Technologies for Field Data Acquisition.” In EFITA 2005, 6. Vila Real, Portugal.
Le Gal, Pierre-Yves, Caroline Lejars, P. Lyne, and E. Meyer. 2004. “De La Diversité Spatiale Aux Performances Des Bassins D’approvisionnement": Cas Des Sucreries De Canne.” Cahiers Agricultures 13 (6): 554–562.
Lejars, Caroline, and B. Siegmund. 2004. “Overview of Réunion Sugar Industry.” In 78th Annual Congress of South African Sugar Technologists’ Association, 29–37. Kwa-Shukela, Mount Edgecombe, South Africa.
Magalhães, P.S.G., and D.G.P. Cerri. 2007. “Yield Monitoring of Sugar Cane.” Biosystems Engineering 96 (1) (January): 1–6. doi:10.1016/j.biosystemseng.2006.10.002.
Martignac, Cécile. 2004. “Soutien D’une Filière Dominante Ou Développement Territorial"? Le Cas Du Sucre à La Réunion.” Cahiers Agricultures 13 (6): 516–521.
Thirion, F., T. Chateau, F. Chabot, and D. Boffety. 1999. “An Integrated Management of Sewage Sludge Spreading in Agriculture by Using GPS and GIS.” In Colloque EFITA 99 European Association for Information Technology in Agriculture Food and the Environment, Bonn, DEU, 27-30 September 1999, -, 721–728.