MIT
ICAT
MIT
ICAT
A
NALYSIS OF
C
OMPLEXITY
E
VOLUTION
M
ANAGEMENT AND
H
UMAN
P
ERFORMANCE
I
SSUES IN
C
OMMERCIAL
A
IRCRAFT
A
UTOMATION
S
YSTEMS
Sanjay S. Vakil and R. John Hansman
Report No. ICAT-2000-3
May 2000
MIT International Center for Air Transportation
Department of Aeronautics & Astronautics
Massachusetts Institute of Technology
Analysis of Complexity Evolution Management and Human Performance
Issues in Commercial Aircraft Automation Systems
by Sanjay Vakil
Submitted to the Department of Aeronautics and Astronautics in May 2000, in Partial Fulfillment of the Requirements for the Degree of
Doctor of Philosophy in Aeronautics and Astronautics
Abstract
Autoflight systems in the current generation of aircraft have been implicated in several recent incidents and accidents. A contributory aspect to these incidents may be the manner in which aircraft transition between differing behaviours or “modes.” The current state of aircraft automation was investigated and the incremental development of the autoflight system was tracked through a set of aircraft to gain insight into how these systems developed. This process appears to have resulted in a system without a consistent global representation.
In order to evaluate and examine autoflight systems, a “Hybrid Automation Representation” was developed. This representation was used to examine several specific problems known to exist in aircraft systems. Cyclomatic complexity is an analysis tool from computer science which counts the number of linearly independent paths through a program graph. This approach was extended to examine autoflight mode transitions modelled with the Hybrid Automation Representation. A survey was conducted of pilots to identify those autoflight mode transitions which airline pilots find difficult. The transitions identified in this survey were analyzed using cyclomatic complexity to gain insight into the apparent complexity of the autoflight system from the perspective of the pilot. Mode transitions which had been identified as complex by pilots were found to have a high cyclomatic complexity.
Further examination was made into a set of specific problems identified in aircraft: the lack of a consistent representation of automation, concern regarding appropriate feedback from the automation, and the implications of physical limitations on the autoflight systems. Mode
transitions involved in changing to and leveling at a new altitude were identified across multiple aircraft by numerous pilots. Where possible, evaluation and verification of the behaviour of these autoflight mode transitions was investigated via aircraft-specific high fidelity simulators.
Three solution approaches to concerns regarding autoflight systems, and mode transitions in particular, are presented in this thesis. The first is to use training to modify pilot behaviours, or procedures to work around known problems. The second approach is to mitigate problems by enhancing feedback. The third approach is to modify the process by which automation is
designed. The Operator Directed Process forces the consideration and creation of an automation model early in the design process for use as the basis of the software specification and training. Thesis Supervisor: R. John Hansman
Acknowledgments
In the official sense, this work was financially supported by the National Aeronautics and Space Administration under grants NAG1-1581 and NAG-1-1857. Support was also provided by FAA and NASA Grant FAA-95-G-017. I would like to thank the following individuals for their suggestions and contributions: Michael Palmer, Terrence Abbot, Everett Palmer, NASA; Kathy Abbot, FAA.
In a less official, but no less important, sense this thesis could not have been completed without a great deal of support from a number of individuals. The small number of names on the title sheet belies the people who helped in major and minor ways to bring this work to fruition.
Associated with the MIT International Center for Air Transportation (formerly the Aeronautical Systems Laboratory) are a supportive and gregarious group of people willing to invest time and energy in assisting students. Alan Midkiff provided valuable real world input at multiple stages. Ping Lee kept me on the financial straight-and-narrow, that is to say “paid.” Jennie Leith went above and beyond the call of duty multiple times to keep my slice of the world organized. The ASRS database review which motivated the creation of the display was carried out by Thomas Vaneck, as was one kicking lobster feast back in ‘90.
The students in the lab were no less helpful. I’d like to thank Jim, Amy and JP for showing me that it can be done, and prodding me to make it over the finish line. Richard, Lee and Lee were my stalwart counterparts on this journey. Tom introduced me to squash—and one day I’ll win a game! Then there were the scads of people who got out while the getting was good. Debbie, Todd, Brenda, Jeremy and others all helped at various points on the long and winding path. Other MIT and lab associated assisted in running scenarios on high fidelity simulator. Thanks to Sherwin and Richard for helping to generate that data
This work would not have come together without the support and guidance of my committee members. Mica Endsely kept involved from afar, Walt Hollister helped me to question my most fundamental assumptions, and Jim Kuchar pointed out, and assisted in correcting, logical flaws in my arguments. As chair, John Hansman provided more support than I could have hoped for as I
learned to juggle the completion of this work while helping to get a startup company off the ground. If not for his patience, persistence and understanding I would not have reached completion. My fervent wish is that more students have the opportunity to associate with people like John. People who realize that there must be a life for students outside and beyond their research.
Outside of MIT, a number of friends came together to provide various types of necessary help. I’d like to thank both George and Matthew for poring over and critiquing copies of this work
before it was polished to the final form. I’d also like to thank the entire “party-of-five” at VIRTMED
for assisting with this work. Not only were they understanding about the time necessary to achieve completion, but they also allowed the publishing of some experimental results as part of an appendix in this work. In fact, the entire survey was based on some in-house technology—thanks to Craig for the help in creating the first GlobalSync-enabled survey.
Important to this process was the support of my family. I would also like to thank my parents for providing the spiritual, mental, and financial support to allow me to complete my education and my sister for always putting a smile on my face when I talked to her. Even my in-laws got into the action by frightening me over the finish lines with the stories of friends that never quite made it!
Finally, I have to thank one additional bit of my family. Without Sally’s help, understanding and love, this thesis would not have gotten done. Sally, your support was broad and deep: helping code the survey, shouldering extra duties at work, proofreading at the last minute and generally keeping my life running while I sank into necessary thesis stupor. By my calculations you deserve some piece of the degree. Instead, you’ll just have to settle for having me back.
Table of Contents
Acknowledgments...5
List of Figures ...11
List of Tables ...17
1 Introduction and Motivation ...19
1.1 Accidents and Incidents...20
1.2 Introduction to Service Problems ...24
1.2.1 Questionnaire on Pilot Understanding of Boeing B757 ...25
1.3 Motivation ...27
1.3.1 Aircraft Automation as a Leading Indicator to Issues in Other Fields ...28
1.4 Thesis Argument Overview...29
2 Evolution of Autoflight System Complexity...33
2.1 Modes and Transitions within Autoflight Systems ...33
2.2 Autoflight System Evolution ...37
2.2.1 First Generation Automation: B727 (1964)...37
2.2.2 Second Generation Automation: B747 (1973) ...38
2.2.3 Third Generation Aircraft: B757 (1983)...39
2.2.4 Fourth Generation Aircraft: B777 (1995) ...41
2.2.5 Technical Factors in Evolutionary Growth...42
2.3 Growth in Complexity ...44
2.3.1 Measures of Complexity ...45
2.3.2 Apparent Complexity of Autoflight Systems ...49
2.4 Chapter Summary ...50
3 Hybrid Automation Representation ...51
3.1 Analysis of Quasi-Steady-State Behaviour ...52
3.1.1 Attitude Control Loops ...53
3.1.2 Velocity Vector Control Loops...54
3.1.3 Trajectory Control Loops...59
3.1.4 Other Control Loops in Modern Aircraft...59
3.1.5 Limitations of Control Block Diagrams ...60
3.2 Analysis of Modal Behaviour...61
3.3 Hybrid Automation Representation...63
3.3.1 Detailed Mode Transition Diagrams...63
3.4 Relation to Other Modeling Efforts...68
3.4.1 OFAN...68
3.4.2 Operator Function Model...68
3.4.3 Operator Procedure Model...69
3.4.4 SpecTRM ...70
3.4.5 Simplification Modeling ...70
3.5 Measuring Autoflight Mode Transition Complexity Using Cyclomatic Complexity...71
3.5.1 Cyclomatic Complexity ...71
3.5.2 Analysis Using Cyclomatic Complexity...73
3.5.3 Measuring the Cyclomatic Complexity of Transitions...77
3.5.4 Level of Abstraction and Apparent Complexity...87
3.5.5 Complexity Management...89
3.5.6 Cyclomatic Complexity Mode Transition Matrices ...92
3.6 Chapter Summary ...93
4 Web-based Pilot Automation Complexity Survey ...95
4.1 Survey on Automation Complexity...95
4.2 Demographic Results...99
4.3 Pilot Characterization of Complex Transitions ...100
4.4 Cyclomatic Complexity of Identified Complex Transitions ...103
4.4.1 Comparison of Cyclomatic Complexity ...103
4.4.2 Number of Conditions...104
4.4.3 Number of Branches ...105
4.4.4 Number of Terminal States...106
4.4.5 Pilot Ratings of Identified Complex Transitions ...107
4.5 Chapter Summary ...110
5 Analysis of Autoflight System Issues...111
5.1 Limitations of Physical Systems ...111
5.1.1 Windshear Alert Suppression ...112
5.1.2 Altitude Capture “Linger Timer”...112
5.1.3 MD-11 Changes in Vertical Rate...115
5.2 Representation Issues ...115
5.2.1 Concerns with Mental Models ...118
5.2.2 Rare modes...119
5.2.3 Lack of Consistency and Predictability ...123
5.2.4 Discrepancy Between Pilots’ and Designers’ Representations ...129
5.3 Feedback and Lack of Observability ...134
5.3.1 Observability in the Vertical Domain ...135
5.3.2 Identifying Feedback Using the Hybrid Automation Representation...139
5.4 Case Study: Altitude Transitions...144
5.4.1 Target Change during Altitude Capture...144
5.5 Chapter Summary ...148
6 Approaches to Mitigating Automation Complexity ...151
6.1 Training and Procedure Modifications ...151
6.1.1 Public Detailing of Issues ...151
6.1.2 Modification of Procedures...152
6.1.3 Modification of Training Process ...154
6.1.4 Utilizing the Hybrid Automation Representation for Targeted Training...155
6.2 Feedback...155
6.2.1 Electronic Vertical Situation Display ...156
6.3 Operator Directed Process ...160
6.3.1 Process-oriented Solutions...161
6.3.2 Operator Directed Process ...162
6.3.3 Functional Analysis ...165 6.3.4 Automation Model ...165 6.3.5 Incremental Instantiation ...167 6.3.6 Training Material ...169 6.3.7 Certification ...171 6.3.8 Configuration Management ...173
6.3.9 Experimental Evaluation of ODP ...174
6.4 Chapter Summary ...175
7 Conclusions...177
References...181
Appendix A Known Accidents / Incidents and Automation Concerns ...189
Appendix B Predictability and Measures of Modal Structures...191
Appendix C Web-based Pilot Automation Complexity Survey...201
Appendix D Web-based Pilot Automation Complexity Questionnaire...213
Appendix E Electronic Vertical Situation Display ...223
Appendix F Electronic Vertical Situation Display Questionnaire...241
List of Figures
Figure 1.1: Commercial Fleet Hull Accident Rate (per million departures)
1988-1997 (Boeing Data, 1998) ...21
Figure 1.2: Primary Causes of Aircraft Accidents (Boeing Data, 1998)...22
Figure 1.3: Breakdown of ASRS reports into Perceived Causes and Flight Domain ...23
Figure 1.4: Worldwide Commercial Fleet Hull Loss and/or Fatal Accident Rates by Years Following Introduction 1959-1997 (Boeing Data 1998)...25
Figure 1.6: In the B757 automation, there are still things that happen that surprise me. (adapted from Weiner, 1985) ...26
Figure 1.5: Worldwide Hull Loss Accident Rates (1988-1997) (Boeing, 1998) ...26
Figure 1.7: There are still modes and features of the B757 FMS that I don’t understand (adapted from Weiner, 1985)...27
Figure 2.1: Abstraction of Autoflight System ...34
Figure 2.2: Horizontal and Vertical Mode Counts in Selected Aircraft...37
Figure 2.3: Vertical Modes in the B727 ...38
Figure 2.4: Lateral Modes in the B727...38
Figure 2.6: Lateral Modes in the B747...39
Figure 2.5: Vertical/Speed Modes in the B747 ...39
Figure 2.7: Vertical/Speed Modes in the B757 ...40
Figure 2.8: Lateral Modes in the B757...41
Figure 2.10: Lateral Modes in the B777...42
Figure 2.9: Vertical/Speed Modes in the B777 ...42
Figure 2.11: Notional Diagram of Beacon-based Navigation ...43
Figure 2.12: Notional Diagram of Area Navigation...44
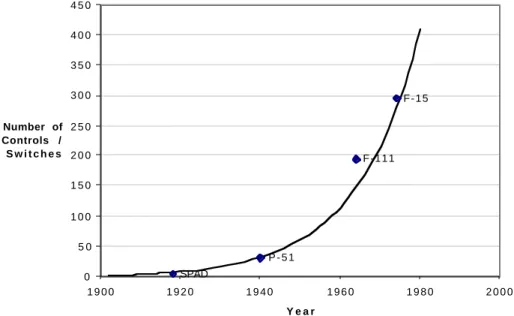
Figure 2.13: Growth of Controls/Switches in Cockpits (Ostgaard, 1981) ...45
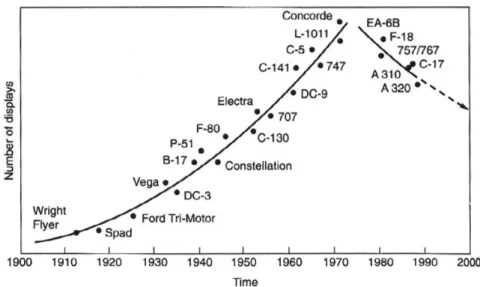
Figure 2.14: Growth of Displays in Cockpits (Weiner, 1988) ...46
Figure 2.15: PFD Airspeed/Mach Display (Honeywell, 1992)...47
Figure 2.17: Growth of Signals (Weener, 1998) ...48
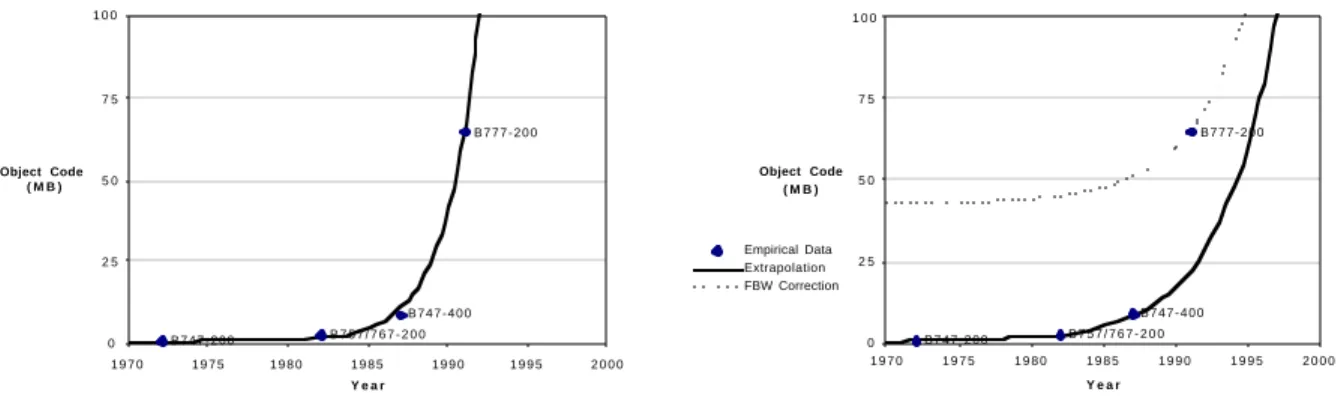
Figure 2.16: Growth of Software (Weener, 1998) ...48
Figure 3.3: Bank Angle Hold Autopilot (McRuer, 1973) ...54
Figure 3.4: Example of Velocity Vector Control: Vertical Speed ...55
Figure 3.5: Coupled Control in Flight Level Change Climb...56
Figure 3.6: Multiple Input, Multiple Output Velocity Vector Control...57
Figure 3.7: Lateral Trajectory Control ...59
Figure 3.8: Changing Control Laws ...60
Figure 3.9: Modal Structure of Simple Autoflight System ...62
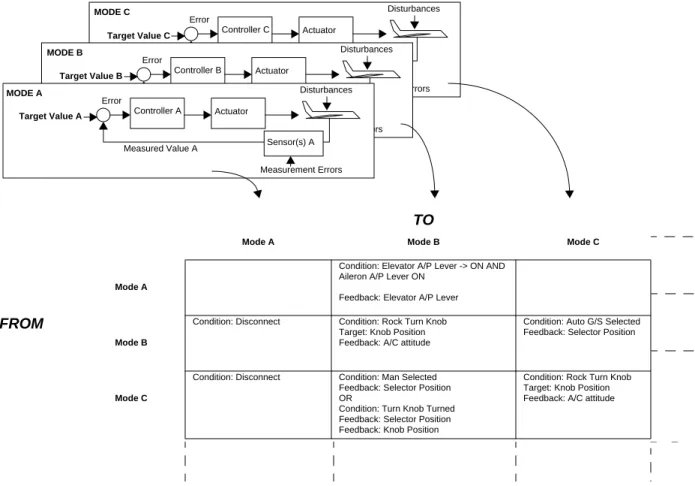
Figure 3.11: Mode Transition Diagram Abstraction ...64
Figure 3.10: Hybrid Automation Representation ...64
Figure 3.12: Transition between Altitude Hold and Vertical Speed ...65
Figure 3.13: Changing Vertical Speed using Pitch Wheel ...65
Figure 3.14: Changing Vertical Speed using Pitch Wheel, Alternate Notation ...66
Figure 3.15: Automatic Transition to Flight Level Change Mode...66
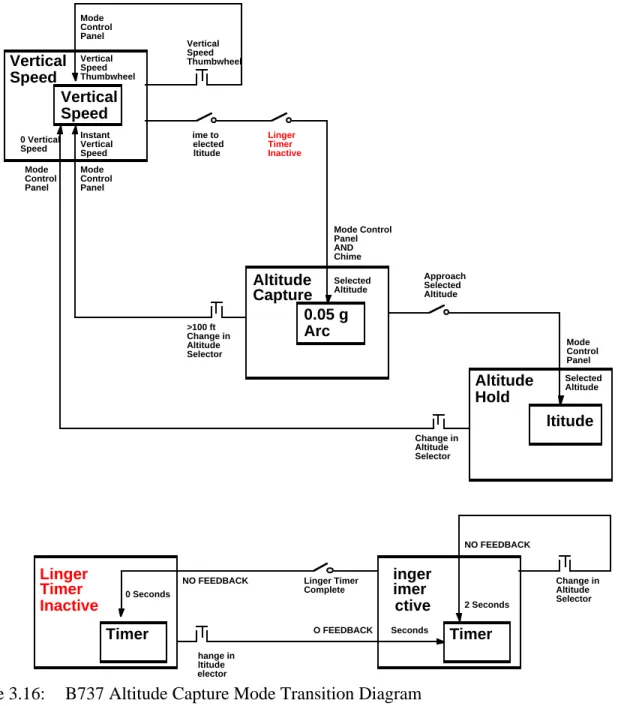
Figure 3.16: B737 Altitude Capture Mode Transition Diagram ...67
Figure 3.17: Mode Transition Diagram Abstraction ...72
Figure 3.19: Simple Strongly Connected System with Additional Edges: v = 2 ...74
Figure 3.18: Simple Strongly Connected System: v = 1 ...74
Figure 3.21: Strongly Connected System through Additional Virtual Edges: v = 2...75
Figure 3.20: Non-strongly Connected System ...75
Figure 3.22: Edge and Node diagram with Multiple Terminal Nodes (squares are terminal nodes) ...76
Figure 3.23: Simple Conditional Transition...76
Figure 3.24: Edge and Node Diagram of Simple Conditional Transition: v = 2 ...77
Figure 3.26: Edge and Node Diagrams of Conditional Transition with an AND: v = 3...78
Figure 3.27: Conditional Transition with an OR: v = 4 ...78
Figure 3.25: Multiple Conditional Transitions...78
Figure 3.28: Edge and Node Diagrams of Conditional Transition with an OR: v = 4...79
Figure 3.30: Edge and Node Diagram of Multiple New Target Values: v = 4 ...80
Figure 3.29: Conditional Transitions with Multiple New Target Values...80
Figure 3.32: Complex Edge and Node Diagram: v = 8...81
Figure 3.34: Straightforward Conversion of Common Conditions into Edge and Node Diagram v = 10...82
Figure 3.33: Mode Transition Diagram with Common Conditions ...82
Figure 3.35: Conversion of Common Conditions into Edge and Node Diagram: v = 8 ...83
Figure 3.36: Four-way Conditions Connected by ORs: v = 8...85
Figure 3.37: Cyclomatic Complexity Measurement of Common Sets: v = 8 ...86
Figure 3.38: Mode Transition Diagram of MD-11 Altitude Change ...93
Figure 4.1: Web-based Survey, Page 3 ...96
Figure 4.2: Web-based Survey, Page 8-10 ...97
Figure 4.3: Web-based Survey, Page 11 ...98
Figure 4.5: Number of Paths per Transition (n=139) ...102
Figure 4.4: Types of Transitions (n=139) ...102
Figure 4.6: Cyclomatic Complexity in Complex Transitions (n=29) ...104
Figure 4.7: Cyclomatic Complexity of Typical Mode Transitions (n=33) ...104
Figure 4.8: Number of Conditions in Identified Complex Transitions (n=29) ...105
Figure 4.9: Number of Conditions in Typical Mode Transitions (n=31) ...105
Figure 4.10: Number of Branches in Identified Complex Transitions (n=29) ...106
Figure 4.11: Number of Branches in Typical Mode Transitions (n=33)...106
Figure 4.12: Number of Terminal States in Identified Complex Transitions (n=29) ...107
Figure 4.13: Number of Terminal States in Typical Mode Transitions (n=33) ...107
Figure 4.15: Pilot Ratings of Identified Complex Transitions versus LNAV to Heading Select (v = 2) ...108
Figure 4.14: Pilot Ratings of Identified Complex Transitions versus Flight Level Change to Altitude Hold (v = 5) ...108
Figure 4.16: Detailed Analysis of Comparison of Identified Complex Transitions to Flight Level Change to Altitude Hold ...109
Figure 4.17: Detailed Analysis of Comparison of Identified Complex Transitions to LNAV to Heading Select...109
Figure 5.1: B737 Altitude Capture Mode Transition Diagram ...113
Figure 5.3: Inappropriate Reversion to Altitude Hold...115
Figure 5.4: System Image versus Design Model and User’s Model (adapted from Norman, 1988)...117
Figure 5.5: Partial List of Observed and Allowed Transitions...122
Figure 5.6: Partial List of Infrequently or Unused Transition Matrix...123
Figure 5.7: Transitions to Altitude Capture and Altitude Hold Modes...124
Figure 5.8: Linger Timer Consistency in B737 During Flight Level Change...126
Figure 5.9: B737 Altitude Capture Mode Transition Diagram ...127
Figure 5.10: Vertical Trajectory of B737 After Change in Altitude Target...128
Figure 5.11: Hypothetical Differing Representations of Autoflight Systems ...129
Figure 5.12: Engineering Representation of A310 Envelope Protection ...131
Figure 5.13: Pilot: Expected A310 Response to Overspeed during Descent ...132
Figure 5.14: Flight Control Unit Depiction of Active Mode (adapted from Pritchett, 1995) ...136
Figure 5.15: Map Mode Display ...137
Figure 5.16: Primary Flight Display...138
Figure 5.17: Feedback of Mode Transition Occurring...140
Figure 5.18: Observability of Conditions and New Target Values ...141
Figure 5.19: Lack of Observability in MD-11 Altitude Capture...142
Figure 5.20: MD-11 Inflight Upset ...143
Figure 5.21: Target Change during Altitude Capture...144
Figure 5.22: Reversion to Vertical Speed during Glide Slope Capture ...145
Figure 6.1: Electronic Vertical Situation Display ...157
Figure 6.2: Overspeed Envelope Protection during Altitude Change ...158
Figure 6.4: Subjective Questionnaire: How Valuable was the EVSD ...159
Figure 6.3: Amalgamated Pilot Understanding Histogram ...159
Figure 6.5: Subjective Questionnaire: Comparison between the EVSD and Current Vertical Feedback Mechanisms...160
Figure 6.6: Subjective Questionnaire: Value of Specific EVSD Elements...160
Figure 6.7: Operator Directed Process (Waterfall Model) ...163
Figure 6.8: Operator Directed Process (Iterative Model) ...164
Figure B.2: RPN Calculator Response Profile...194
Figure B.3: Four Function Calculator Mode Transition Diagram ...196
Figure B.4: RPN Calculator Mode Transition Diagram ...197
Figure D.1: Web-based Survey, Page 1 ...213
Figure D.2: Web-based Survey, Page 2 ...214
Figure D.3: Web-based Survey, Page 3 ...215
Figure D.4: Web-based Survey, Page 4 ...216
Figure D.5: Web-based Survey, Page 5 ...217
Figure D.6: Web-based Survey, Page 6 ...218
Figure D.7: Web-based Survey, Page 7 ...218
Figure D.8: Web-based Survey, Page 8-10 ...219
Figure D.9: Web-based Survey, Page 11 ...220
Figure D.10: Web-based Survey, Page 12 ...221
Figure E.1: EVSD During Descent, Reaching High Speed Limit ...224
Figure E.2: EVSD in VNAV Descent...227
Figure E.3: EVSD Near Approach...228
Figure E.4: Glide Slope Transmitter Failure during Approach ...230
Figure E.5: Overspeed Envelope Protection during Altitude Change ...231
Figure E.6: Altitude Capture Failure during Altitude Change...232
Figure E.7: VNAV Path to VNAV Speed Transition due to High Winds...233
Figure E.8: Target Error by Pilot Flying during Non-Precision Approach ...234
Figure E.9: Underspeed during Altitude Change due to ATC Directive...235
Figure E.11: Subjective Questionnaire: How Valuable was the EVSD ...236
Figure E.10: Unexpected Climb during Approach due to Flap Overspeed ...236
Figure E.12: Subjective Questionnaire: Comparison between the EVSD and Current Vertical Feedback Mechanisms...237
Figure E.13: Subjective Questionnaire: Value of Specific EVSD Elements...238
Figure G.1: Paper Billing Card...250
Figure G.2: List of Patients and Patient Card...254
Figure G.3: Additional Screens of Data ...255
Figure G.5: Example Storyboard...256
Figure G.6: Physician Interactions with Electronic Billing Card...262
Figure G.8: Did you find the electronic billing card simple, intuitive,
and easy to use ...263
Figure G.7: Did you find the electronic billing card training adequate ...263
Figure G.10: How do you feel the electronic billing card compares with
the current paper system for...264
Figure G.9: Would you want to use the electronic billing card on
a permanent basis...264 Figure G.11: Please rate the value of each of the following features of
List of Tables
Table 3.1: Representative Vertical and Speed Modes in the MD-11...57
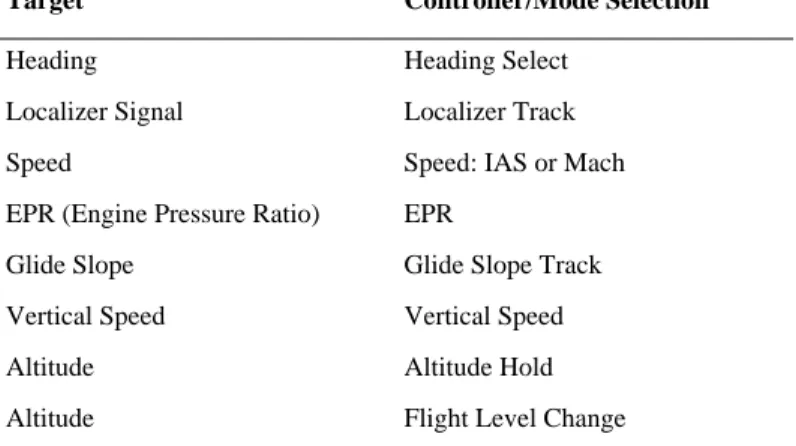
Table 3.2: Possible Targets in the Boeing B737 ...58
Table 3.3: Transition Matrix for Simple Autopilot System ...63
Table 3.4: Cyclomatic Complexity Mode Transition Matrix...93
Table 4.1: Breakdown of Responses by Aircraft Type (total n=93) ...99
Table 4.2: Flight Hours of Respondents (total n=93) ...99
Table 4.3: Transitions Identified by Respondents...100
Table 4.4: Starting Modes Identified by Respondents ...100
Table 4.6: Most Commonly Identified Modes...101
Table 4.5: Ending Modes Identified by Respondents ...101
Table 5.1: Observed Autoflight Transition Matrix showing Absolute Percentage of Transitions ...121
Table 5.2: Pilot versus Engineer Perspective on Incidents (Feary, 1999) ...133
Table 5.3: Representative Horizontal Modes in the MD-11 ...139
Table 5.4: Representative Vertical and Speed Modes in the MD-11...140
Table 5.5: Altitude Target Change during Vertical Speed Maneuver ...146
Table 5.6: Altitude Target Change during Flight Level Change Maneuver ...147
Table 5.7: Behavior while Altitude Knob is in Motion. ...148
Table 6.1: Possible Automation Model Representations ...166
Table A.1: Examples of Incidents and Accidents (adapted from the FAA Report on The Interfaces Between Flightcrews and Modern Flight Deck Systems)...190
Table B.1: Example Keystroke Sequences ...194
Table B.2: Error Prone Keystroke Sequences ...195
Table C.1: Breakdown of Responses by Aircraft Type (total n=93) ...201
Table C.2: Flight Hours of Respondents (total n=93) ...202
Table C.3: Transitions Identified by Respondents...202
Table C.4: Starting Modes Identified by Respondents ...203
Table C.6: Most Frequently Identified Transitions ...205
Table C.7: B737-3/4/5/6/7/800 Analyzed Transitions...207
Table C.8: B757/767 Analyzed Transitions ...208
Table C.9: A320 Analyzed Transitions ...210
Table C.10: B737-300 Typical Transitions ...211
Table C.11: B757 Typical Transitions...212
Table G.1: Primary Functions Required of Electronic Billing System...251
Table G.3: Supplementary Functions Required of Electronic Billing System ...252
Table G.2: Secondary Functions Required of Electronic Billing System...252
Chapter 1
Introduction and Motivation
Advances in computation, algorithmic, and sensor capabilities have driven a trend towards more automation in dynamic systems. In particular, the commercial aircraft cockpit has been augmented by automation, causing changes to the task of flying an aircraft. Current advanced commercial transport aircraft, such as the Boeing B777/B747-400, the Airbus A320/A340, and the McDonnell Douglas MD-11, rely on AutoFlight Systems (AFS) for flight management, trajectory control, and interaction with control surfaces (Boeing 1986, 1989, 1997; Honeywell 1992, 1994). These systems have evolved from simple autopilots, such as the single axis autopilots created by Sperry in 1912 (McRuer, 1973) to multiple processor systems capable of sophisticated and interrelated tasks such as those that are used in the Boeing B777 cockpit. These tasks span the range from high-level flight management to low-level control of individual actuators.
Aircraft automation has been designed to improve performance and to increase flight safety. Performance can be increased by allowing more accurate tracking of altitude and path targets, cost can be reduced by flying algorithmically optimized fuel efficient paths, and sensors can be used to warn pilots or deal directly with unsafe situations. Flight safety can be enhanced by automatically performing critical maneuvers, by not allowing the aircraft to perform possibly dangerous maneuvers, or by augmenting the control characteristics to make the aircraft easier to fly. However, automation has also become a potential safety liability. The rapid evolutionary development of autoflight systems in commercial transport aircraft is suspected as a contributory factor in a number of incidents and accidents. Hull losses have occurred at France (Strasbourg, 1992), India (Bangalore, 1990), Japan (Nagoya, 1994), and Colombia (Cali, 1995). Numerous autoflight-related incidents have also occurred, including a rapid pitch-up (Orly, 1994), multiple incidents of overspeeds, and numerous large altitude deviations.
As automation systems become more capable, the human element may become a limiting factor in system operation and design. If so, procedures and design processes may need to be modified to acknowledge known limitations. This issue is likely to be particularly critical in
future generations of aircraft automation. Work is currently underway on the next generation of cockpits. Clearly stating the issues and solutions may improve safety and prevent costly fixes once the next generation is flying.
Many modern dynamically controlled systems use humans in a supervisory manner by having them monitor the automation which is performing the task rather than performing the task directly
(Sheridan, 1992). Nuclear power plants, process control plants, and air traffic control are
additional examples of supervisory systems. This thesis uses the commercial aviation environment as a case study to identify and discuss issues which may be important in other fields which use automation to support humans in supervisory systems.
1.1
Accidents and Incidents
One of the goals of aircraft autoflight systems was an increase in safety. Each successive generation of aircraft has become safer, in aggregate, than the previous generations. Figure 1.1 shows data compiled by Boeing depicting hull loss accident rates in commercial fleets (Boeing Data, 1998). This data is grouped by generation of aircraft airframes and shows a general reduction in the accident rate between generations.
The generations are based on airframe as well as automation capability. The first generation consists of early commercial jet transports, many of which have been retired from service. The second generation is comprised of widebody jets and shows a marked reduction in accident rate. The third generation consists of the first wave of “glass cockpit” aircraft, but does not include those which are fly-by-wire. Finally, the fourth generation consists of most currently manufactured narrow and widebody aircraft. Limited data exists for the most recent aircraft such as the A330, A340, MD-90 (now B717), and the B777. It is important to note that this chart documents “rare” events, and so the statistical relevance is minimal and care must be taken when observing trends.
In spite of the overall reduction in accident rate, flight crew error still appears as the dominant factor in hull loss accidents. The impact that pilots have on aircraft safety have been recognized for some time. Figure 1.2 show a breakdown of data from 2032 incidents reported over
1959-has remained the primary cause of aircraft hull loss accidents as determined by the investigative authority. The second set of data on this graph shows that the accident causes from 1988-1997 have not changed significantly and that the fraction of accidents attributed to the flight crew has remained largely stable at about 70%.
Within the set of errors attributed to flight crews, automation problems are emerging as a key safety area. The incorporation of new flight automation has resulted in a new set of human factors issues. Sufficient concerns have been raised to warrant government investigation in the form of the 1996 FAA Report on the Interfaces Between Flightcrews and Modern Flight Deck Systems.
Figure 1.1: Commercial Fleet Hull Accident Rate (per million departures) 1988-1997 (Boeing
Data, 1998) .2 .9 .5 .5 .6 .6 .2 .5 .0 .3 .4 .5 .4 .6 .2 .5 .7 .0 .0 .0 .4 irst Generation 727 rident * C-10 * AC 1-11 C-9 737-1/-2 -28 747-1/-2/-3/-SP C-10 -1011 300 D-80 767 757 310 Ae 146 300-600 737-3/-4/-5 -100/-70 320/319/321 747-400 D-11 340* 330* D-90* 777* verall <100 000 Departures econd Generation hird Generation ourth Generation
This document also discusses human factors and interface issues, which include mode awareness problems (Vakil, 1995), incomplete pilot understanding of automation (Sarter 1992; Weiner, 1988; Vakil 1996; Javaux 1998; others), and loss of automation situation awareness (Endsley, 1994, 1995). In contrast to mechanical aircraft failure, these problems appear to be based in confusion between the pilots' expectations of the autoflight system and what the system is actually doing.
Review of Aviation Safety Reporting System
Flight crew automation issues were examined through the use of the Aviation Safety Reporting System (ASRS), a volunteer mechanism for documenting problems in flight operations with a degree of amnesty. A search was performed on the ASRS database by researchers at the MIT Aeronautical Systems Laboratory (Vakil, Vaneck, and Midkiff, 1995) from the years 1990-94 with a set of keywords designed to elicit problems related to mode awareness. The keywords consisted of the following: annunciation, annunciator, FMC, flight management computer, FMS, flight management system, CDU, mode, capture, arm, automatic flight system, vertical, horizontal, and program. A total of three hundred ASRS reports were returned by the keyword search. After analysis, 184 were categorized as appropriate to flight crew automation issues.
The most commonly reported errors were “Programming Errors,” “Mode Transition
Figure 1.2: Primary Causes of Aircraft Accidents (Boeing Data, 1998)
0 10 20 30 40 50 60 70 80
Flight Crew Airplane Maintenance Weather Airport/ATC Miscellaneous
Primary Factor Percentage of Total
Accidents with Known Causes
the “Programming Errors” category may be overstated, since a single typographical error could cause an ASRS filing. However, if a such a minor error can lead to a filing, it may be indicative of an additional concern: the usage of automation can allow relatively minor errors on the part of the human to have significant repercussions. While this is not a new phenomenon, automation may have made these sorts of errors more likely to occur.
The dominant causal areas are of particular importance because they suggest there can be confusion between the pilots’ expectations of the automation and what it is actually doing. “Mode Transition Problems” indicate that pilots may not realize when the automation changes its behaviour or the implications of the new behaviour. “Insufficient Understanding of Automation” is equally problematic since it suggests that the pilots may not be able to supervise the automation: in order to effectively monitor automation, a pilot must understand what its intended behaviour should be.
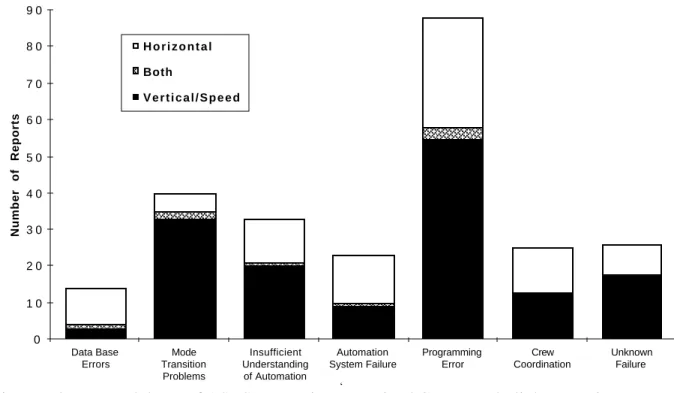
As shown in Figure 1.3, these reports were also categorized by the perceived cause of the problem and by the flight path (vertical/speed, horizontal or both) that was impacted. Since the vertical flight path and the speed are implicitly coupled, they were grouped together. In instances
‘
Figure 1.3: Breakdown of ASRS reports into Perceived Causes and Flight Domain
0 1 0 2 0 3 0 4 0 5 0 6 0 7 0 8 0 9 0 Data Base Errors Mode Transition Problems Insufficient Understanding of Automation Automation System Failure Programming Error Crew Coordination Unknown Failure Number of Reports H o r i z o n t a l Both V e r t i c a l / S p e e d
where the problems spanned multiple causal categories, the reports were counted in each category. In Figure 1.3, it can be seen that vertical/speed problems dominate many of the categories; of all categories 62.7% of the reports were of this type. In particular, the “Mode Transition Problems” category is dominated by vertical/speed problems. The data classified into the “Insufficient Understanding of Automation” also suggests a deficiency in knowledge of the vertical domain automation.
It should be noted that there exists a potential for over-reporting vertical deviations. Air Traffic Control (ATC) radar can measure altitude much more precisely than location. This may result in pilots reporting vertical/speed incidents more often than lateral ones.
1.2
Introduction to Service Problems
As new, complex automation systems are introduced into operation, problems are discovered early during operation and dealt with through training and procedural changes (Weiner, 1985). This process of fixing issues as they appear results in incidents early in the aircraft lifetime, typically after introduction. However, this does lead to a stable set of automation within which all of the problems have been identified. These identified problems can then be dealt with through training, procedural changes, or automation modification. Underlying this process is an implicit higher failure rate early in operational usage, rather than later as mechanical failure appears.
Figure 1.4 shows hull losses or fatal accidents for aircraft from 1959-1997 organized by the number of years since introduction of an aircraft type that the accident occurred. In a manner consistent with Figure 1.1, the number of accidents has been decreasing with successive generations. However, each generation shows a spike a short time after introduction. This increase corresponds with problems that are found early in the operational life of the aircraft that were not foreseen before they were put into active usage.
Figure 1.5 shows the Hull Loss Accident Rate of the worldwide commercial aircraft fleet from 1988-1997 by individual aircraft. Multiple aircraft that have been introduced since 1981 are shown with the accident rate per one million departures. While noting that the statistical significance of the information in this chart is limited since hull loss accidents are rare events,
compares to other aircraft. Part of the reason behind the anomalous nature of the A320 derivative record is an early hull loss during operational usage at the Habsheim airshow on June 26th, 1988. However, the accident rate of this aircraft also appears to be improving as pilots and airlines gain more experience with its detailed behaviour, and as these details are disseminated. A hypothesis for this improvement is that training material, procedures, and flight crews are becoming more proficient with the aircraft. This is consistent with the nature of the A320, which was the first fully digital commercial fly-by-wire aircraft. It also included numerous departures from previous designs, such as a full authority envelope protection system, a side-stick controller, and non-moving throttles. This experience also explains the lack of hull losses of the recently introduced A330 and A340, which have very similar cockpit automation.
1.2.1 Questionnaire on Pilot Understanding of Boeing B757
Work has also been done to gauge pilot understanding of flight automation. This work looked at pilots’ understanding of the Boeing B757 early in its operational lifetime. The results indicate that pilots did not feel that they completely understood the aircraft (Weiner, 1985). The research consisted of a questionnaire (“Phase 1”) designed to probe pilots’ opinions, experience levels,
Figure 1.4: Worldwide Commercial Fleet Hull Loss and/or Fatal Accident Rates by Years
specific information and viewpoints on the new “glass cockpit” technology that was distributed to Boeing B757 pilots at a pair of carriers.
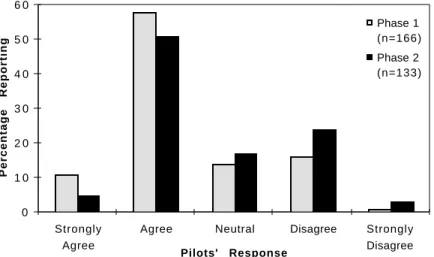
A follow-up questionnaire (“Phase 2”) was distributed a year later. The second questionnaire is interesting in that it shows insight into the effect of familiarity, practice and experience with the technology. Each questionnaire consisted of a large set of questions organized using the Likert scale to assess the pilot attitude. In this study, five response levels were employed. The response to the statement “In the B-757 automation, there are still things that happen that surprise me.” is shown in Figure 1.6. The particularly striking point of this graph is that after a year flying the aircraft, over half of the pilots were still being surprised by the automation.
Figure 1.5: Worldwide Hull Loss Accident Rates (1988-1997) (Boeing, 1998)
Figure 1.6: In the B757 automation, there are still things that happen that surprise me.
(adapted from Weiner, 1985)
Aircraft Type 0 1 2 3 4 5 6 7 8 9 0
C-9-80 67 57 A310 Bae 146 A300-600 737-3/4/5 F-100 320/321 47-400 D-11
1988 1989 1990 1991 1992 1993 1994 1995 1996 1997
Accidents per Million Departures
*4500 Departures, 1 Hull Loss *71000 Departures, 1 Hull Loss N/AN/A N/A N/A
N/A
N/AN/A N/AN/A N/AN/A
0 1 0 2 0 3 0 4 0 5 0 6 0 Strongly Agree
Agree Neutral Disagree Strongly
Disagree Pilots' Response Percentage Reporting Phase 1 (n=166) Phase 2 (n=133)
While the distribution of responses changed between Phase 1 and Phase 2 of the study, even after at least a year of experience, pilots were being surprised by the automation. The premise that pilots have an incomplete understanding of the automation is further bolstered by Figure 1.7 which shows that pilots felt that there were modes and features of the FMS which they did not understand.
The results of this survey seem to indicate that it may take more time to train pilot to maximal proficiency in new aircraft. The time necessary for this training and the operational experience required have not been determined by this survey. What is necessary is a longitudinal study looking across pilots of varying operational experience to determine when individuals feel that they have mastered the aircraft.
1.3
Motivation
The primary motivation for this research is to gain insight into the underlying causal basis for the human factors issues which have been identified as appearing in new autoflight systems. By understanding the reasons for these issues, mitigation approaches can be identified and suggested. Flight automation systems in successive generations of aircraft have been gaining in capability. This growth in capability has increased the size, and likely the complexity, of new generations of automation. This growth may result in future generations of aircraft which are more susceptible to interface and autoflight systems problems. It is expected that the issues which are identified
Figure 1.7: There are still modes and features of the B757 FMS that I don’t understand
(adapted from Weiner, 1985) 0 1 0 2 0 3 0 4 0 5 0 6 0 Strongly Agree
Agree Neutral Disagree Strongly
Disagree Pilots' Response Percentage Reporting Phase 1 (n=166) Phase 2 (n=133)
through this analysis are early indicators—the leading edge—of these automation problems in future systems. As such, the intention of this work is to serve as a preemptive mechanism to forestall this increase by providing guidance for the design of future generations.
1.3.1 Aircraft Automation as a Leading Indicator to Issues in Other Fields
Aircraft autoflight systems are an effective area in which to study the human factors issues. They can serve as a leading indicator with automation interaction and complexity management and problems in other domains. A number of additional fields may be served by the insights suggested in this work. Nuclear power plants and process control plants represent areas in which workers are trained specifically for their task, albeit not as rigorously as in aerospace. These plants are highly automated in a manner similar to aircraft and in many cases have warning systems and alerts to maximize safety. Air traffic control may also be served by these insights since controllers are highly skilled individuals whose task involves them interacting with automation.
Leading Indicator
Aircraft automation is thought to be an exploratory case study for the identification and consideration of issues which may be important in many other human-automation systems. Pilots are a homogeneously trained group of subjects to investigate, so that fundamental human-automation issues can be seen with fewer confounding factors. The medical and currency requirements on pilots are also stringent. The automation with which pilots interact has rigorous performance requirements due to its life-critical nature.
As a population, commercial airline pilots are homogeneous, intelligent, and highly trained. In the United States, the Federal Aviation Administration verifies that pilots are free of medical disorders, and meet specified educational standards. In addition to initial flight training and check out, commercial pilots are subject to yearly reviews, checkrides, and medical examinations (Federal Aviation Administration 1998). These stipulations are imposed by governmental certification organizations to ensure that the safety of the flying public is not jeopardized. Individual airlines attempt to verify that their pilots do not suffer from drug or alcohol abuse problems. Training is completed and documented on a recurring basis by the airlines. Medical
logs and histories are maintained for each pilot. Stiff competition tends to limit the population to those who are well educated. In general, pilots are held to high standards medically, cognitively, and from the standpoint of co-ordination. Problems in this highly trained and motivated population are likely to indicate problems with other automation areas.
Other Fields
The medical arena is another in which highly skilled and trained practitioners work within a proceduralized environment. In recent years, the drive towards managed medical care has resulted in the adoption of additional proceduralization in order to standardize the care provided to patients. Automation which is used in this field must be designed in a manner which is consistent with a care-giver’s model of the task, can be used by a task- rather than technology-oriented audience, and must be able to exist within the procedural environment.
Another important class of operators is composed of those who are not highly trained to specific automation or to the task. Luxury automobiles are an area in which rapid innovation is leading to the adoption of some very interesting automation. Antilock brake systems place a microprocessor between the pedal and the actuator for the brake shoe; one could argue that modern systems provide “brake-by-wire” capabilities. There are other advanced being planned (Port, 1998). “Road-following” is an advanced form of cruise control which allows the vehicle to follow curves and maintain spacing within its lane; other systems can automate lane changes.
1.4
Thesis Argument Overview
The goal of this thesis is to gain insight into the underlying basis for the source of human factors problems which are appearing in commercial autoflight systems and to consider approaches for dealing with these problems. The next chapter will examine the incremental development of these systems, which have been evolving for the past thirty years. Detailed analyses of available aircraft operators manuals, inferred autoflight system behaviour, and accident reports have enabled insight into the structure of autoflight systems and how to segment and extend their behaviour.
The results of autoflight system analysis are used to develop the Hybrid Automation Representation, an abstraction of the autoflight system which captures both the continuous and discrete behaviour of these systems. This abstraction bears strong resemblance to modern hybrid models being researched in the control area. The Hybrid Automation Representation will be compared to other similar modeling efforts underway. One of the strengths of this model is that it can be used to measure the “cyclomatic complexity” of autoflight system behaviour. Cyclomatic complexity is a rigorous measure from theoretical computer science of the number of linearly independent paths through a system, which has been extended to allow the measure of an aspect of automation complexity, namely the number of independent paths through which a transition can occur.
Chapter 4 will present a survey designed to validate the applicability of cyclomatic complexity by examining the cyclomatic complexity of autoflight system mode transitions of those transitions identified as difficult by pilots. A survey was conducted on the World Wide Web and made accessible via the Internet. Pilots were instructed to detail autoflight system mode transitions which they found to be most complicated. A subset of these transitions was then analyzed in order to characterize their cyclomatic complexity.
Chapter 5 will use hybrid automation representation to examine several types of underlying causal factors that have been identified through focused interviews and accident/incident reports. The use of the Hybrid Automation Representation in identifying some types of the accidents and
incidents a priori will be discussed. One of the results of the pilot survey was the identification of
the Altitude Capture mode transition as problematic. A case study will be presented of Altitude Capture behaviour in which problems are identified via the hybrid automation representation and were then verified through high fidelity simulator testing.
Chapter 6 will discuss mitigation techniques which have been identified to address aircraft automation problems. The first is the use of procedures and changes in training as a means to mitigate some automation problems resulting from complexity. Directed additional training may be useful to allow pilots to build more robust mental representations of automation. Procedures can be used to “work around” automation issues. The second approach is to enhance feedback to change the nature of interaction with automation and allow more accurate mental representations
when the existing displays are not sufficient or appropriate. Adding feedback in the aircraft may allow a more accurate representation of automation state to be determined. The third approach is to explicitly manage the complexity of the system so that it is more consistent with human capabilities and limitations by modifying the process by which these systems are designed. An Operator Directed Process will be presented as a development process which considers the human pilot’s limitations and capabilities early in the design process.
Chapter 2
Evolution of Autoflight System Complexity
Autoflight systems have developed in an evolutionary manner over the past fifty years. During this time, the complexity of these systems has increased as they have been made capable of performing additional functions, enabled by advances in sensors, computational capability, and new algorithms. This complexity is hypothesized to be a contributory factor in aircraft incidents, as suggested in Section 1.1. The evolutionary growth of these systems is examined for a particular family of aircraft to investigate the manner, and order, in which functions were added. Other factors, such as the size of software in the autoflight system, and the number of controls with which the pilot has to interact are discussed. The material for this analysis is based on public information sources, such as aircraft manuals, focused interviews with pilots and airline check pilots.
2.1
Modes and Transitions within Autoflight Systems
Autoflight systems have developed incrementally based on the adoption of new technologies. One way to track the incremental growth is to examine the number of independent, quasi-steady-state behaviours available to pilots as documented in the flight operations manuals. Control block diagrams are an effective representation of closed loop control, where the system is typically controlled to a target value. However, each controller is limited to a single behaviour. In order to allow the multiple behaviours necessary during various stages of flight, autoflight systems include multiple controllers for each flight domain, only one of which is active at any time.
Modes are a mechanism to allow disparate behaviours to coexist within a single system. Disparate behaviours will appear when new functionality is added to system which cannot be parsed as an extension to existing function, or cannot be constructed by combining existing functions. In the case of autoflight systems, new modes were needed when necessary behaviours could not be generated by existing closed loop controllers. New modes were added in the form of new controllers. Dividing the system into separate controllers can allow selection among multiple behaviours. The active mode defines the active controller to determine the behaviour of the
system. Figure 2.1 shows this abstraction of the autoflight system graphically. Modes allow the autoflight system to be decomposed into separate behaviours which can be selected. Only one controller can be active at a time.
Modes also allow the incremental adoption of the functions and behaviours into pre-existing systems. They also allow a single system to be more capable by allowing it a larger set of behaviours to deal with more environments, situations, procedures, and scenarios. Systems which have evolved incrementally are more likely to require to take advantages of modes as a tool to manage complexity, as seen in the previous section where new autoflight systems tended to carry forward the majority of older modes. Incremental evolution is often characterized by the adoption of new functions. If new functions need to be added which are not an extension to existing function, or cannot be constructed by combining existing functions, a new mode must be created to encapsulate this new behaviour.
In aircraft, a single mode is unable to allow all the various behaviours required in flight. As an example, consider the recent additions to vertical aircraft automation. A Vertical Speed (V/S) mode has been available since the B727, shown in Figure 2.5. This mode controls the vertical rate of the aircraft, usually by referencing barometric pressure. As such, Vertical Speed is an
“air-Figure 2.1: Abstraction of Autoflight System
Controller C Actuator
Target Value C
Measured Value C Sensor(s) C Error Disturbances Measurement Errors MODE C Controller B Actuator Target Value B
Measured Value B Sensor(s) B Error Disturbances Measurement Errors MODE B Controller A Actuator Target Value A
Measured Value A Sensor(s) A Error
Disturbances
Measurement Errors
path angle, which is fundamentally different in that it is an ground-referenced mode because it measures the angle between the flight vector and the ground. In order to add this capability, a new mode needed to added; more recent aircraft also have a Flight Path Angle (FPA) mode, seen in Figure 2.9.
Modal Structure of Autoflight Systems
Aircraft automation has been parsed to consist of an irreducible set of base modes which are
used in quasi-steady-state conditions, have an invariant set of targets, and correspond to an unambiguously defined automation behaviour. This definition is consistent with the manner in which pilots model the system, and how engineers model the system—each base mode
corresponds to single controller, generally a state level controller (Vakil 1996). A macro mode
consists of a specific sequence of base modes where a specific order of transitions is expected based on procedural or nominal usage. Each base mode in the macro mode sequence has its own set of targets, so that the automation’s set of targets varies over the course of the macro mode. Transitions among the base modes are made based on the mode transition criteria, such as altitude or indicated air speed. An example of a macro mode is the Autoland sequence, which transitions (in the vertical channel) between Altitude Hold, Glide Slope Capture, Flare, and Rollout with a different set of targets in each base mode. Other examples include Vertical Navigation or Profile, Lateral Navigation, Flight Level Change and Autoland.
Transitions Between Modes
Each possible transition between modes consists of a starting mode, an ending mode,
conditional statements which must be satisfied in order to effect the transition, and the target value of the new mode. Conditions determine whether the transition will occur. A transition will only occur if all of the conditions are satisfied. Transitions among modes can be caused by various factors, including intervention by the human operator (pressing a button), environmental changes (winds), or due to specific conditions being met (reaching a waypoint or speed limit). Each of these is one element in the set of conditions which must be satisfied before a transition will occur from the starting mode to the ending mode. Individual conditional statements can be combined in a Boolean manner to create more sophisticated interaction. In modern aircraft automation, these statements can become quite complex.
From the standpoint of the pilot, transitions can be further grouped into three categories. A
commanded transition is active as soon as the selection is made: the transition condition consists solely of the selection itself. An example is moving the Altitude Hold switch to the on position,
thereby activating the Altitude Hold behaviour. An uncommanded transition is one that is not
directly activated by the pilot: the transition conditions consist of elements not under the control of the pilot. These transitions are usually some type of envelope protection, or failure in the automation. Another example is a transition caused by overspeed protection in more modern
aircraft. Finally, armed transitions occur when, after arming, a mode engagement occurs at some
further condition. At least two conditions are necessary: pilot selection and the occurrence of an external condition. An example is the use of Glide Slope Capture to transition to a descent mode after the aircraft intersects with the ILS glide slope signal.
Concerns with Modal Automation
As discussed in Section 1.1, automation problems have been identified as a key safety area. Within this area it appears that modal automation, and mode transitions in particular, are of particular concern. Figure 1.3 shows the that a number of ASRS reports were related to mode transitions. In addition, it appears that pilots have suitable experience with continuous time behaviour of aircraft automation and that is well understood. By contrast, numerous researchers have raised concerns regarding the discrete modal behaviour is more modern aircraft (Sarter 1992, Weiner 1988, Vakil 1996, Javaux 1998, others).
There is also evidence that pilots model the system in a modal manner. If this is found to be a widely adopted representation, it may be the appropriate form upon which to base the training material. Focused interviews showed that pilots have adopted a modal representation of automation behaviour, as described by mode transition diagrams (Javaux, 1999b). Note that this is different from a detailed Finite State Machine type of representation of the underlying automation, but rather an organization of the behaviour into separate modes. The differences appear in the parsing of what constitutes a mode, a trigger event, or a conditional clause. These differences acknowledge the operational viewpoint rather than the design viewpoint. This thesis is going to focus on examining mode transitions in aircraft autoflight automation.
2.2
Autoflight System Evolution
This section will examine the growth in number of modes to support the hypothesis of incremental growth. Based on the open literature and training materials for each aircraft, an estimate was made of the number of independent modes in a series of aircraft as shown in Figure 2.2 (American Airlines 1997, American Airlines 1994, Boeing 1989, Honeywell 1992). These diagrams shows that the number of modes available for use by the pilot has been increasing in a linear manner. The data may be incomplete from the standpoint of system design, but is a measure of the number of modes articulated to pilots. The number of modes may be undercounted. In particular, the high level Airbus PROF and Boeing VNAV modes consist of a set of submodes. These submodes are difficult to directly compare as the manufacturers have parsed the submodes differently. Therefore these modes could not be counted separately. This implies that the mode count in Figure 2.2 is conservative for these aircraft, since modes associated with trajectory control are underrepresented.
The following sections will show the growth of aircraft modes in a more detailed manner organizing modes by the control level at which loop closure is accomplished. Four generations of aircraft will be examined, consisting of the Boeing B727, B737, B757, and B777.
2.2.1 First Generation Automation: B727 (1964)
The Boeing B727 is the representative aircraft for the discussion of first generation of transport jet automation (American 1997). It had limited ability to control its lateral and vertical flight path, but did not have autothrottle capability. As shown in Figure 2.3, in this aircraft, the
Figure 2.2: Horizontal and Vertical Mode Counts in Selected Aircraft
Horizontal Mode Count
B757 B727 A 3 0 0 - 6 0 0 MD11 A 3 2 0 0 2 4 6 8 1 0 1 2 1 4 1 9 6 0 1 9 7 0 1 9 8 0 1 9 9 0 Number of Modes
Vertical Mode Count
A 3 2 0 B757 MD11 A 3 0 0 - 6 0 0 B727 0 2 4 6 8 1 0 1 2 1 4 1 9 6 0 1 9 7 0 1 9 8 0 1 9 9 0 Number of Modes
vertical modes are not coupled to the speed modes. The Turn/Pitch knob was used to control the attitude of the aircraft. Altitude Hold was the available state control mode and Glide Slope Track was used to control the trajectory during approach. Glide Slope Arm maintained the current altitude (in an identical manner to Altitude Hold) until the glide slope was acquired. At that point, the system transitioned to Glide Slope Track.
Lateral modes are shown in Figure 2.4. The Boeing B727 included an automatic “yaw damper,” which acted as a stability augmentation system. This device counteracted the Dutch Roll mode to which swept wing aircraft are susceptible. The Turn and Pitch knob was used to control the roll of the aircraft. State control allowed the selection of a heading, maintenance of a heading, and the ability to track a VOR signal. Trajectory control was used during approach to follow a ILS localizer and Glide Slope signal.
2.2.2 Second Generation Automation: B747 (1973)
The Boeing B747-100/200 will be used as a representative aircraft for the discussion of second generation autoflight systems (Boeing 1985). Figure 2.5 shows the vertical and speed modes in this aircraft. Sections that are shaded existed in the previous generation.
In addition to those in the B727, the B747 had several new modes, some of which were introduced by the inclusion of an autothrottle. The Turbulence mode was added to provide the ability to hold altitude through turbulent weather conditions and functioned in a manner similar to Altitude Hold. IAS Speed used the pitch of the aircraft to maintain a specified airspeed. Vertical Speed allowed descents at a specified rate. The Speed mode controlled to a target velocity by
Figure 2.3: Vertical Modes in the B727
Figure 2.4: Lateral Modes in the B727
Stab Augmentation Attitude Control State Control Trajectory Control Envelope Protection
Turn/Pitch Knob Altitude Hold Glide Slope Track Glide Slope Arm
Stab Augmentation Attitude Control State Control Trajectory Control Envelope Protection
Yaw Dampers Turn/Pitch Knob Heading Select Localizer
Heading Hold VOR Track
closing the loop around the throttles and was typically used in conjunction with the Altitude Hold and Vertical Speed modes. Altitude Capture or Select was used to smoothly transition to a level flight path after a climb or descent.
The more interesting new mode was the addition, on certain B747s, of the “Performance Management System” (PMS) which provided trajectory control during the cruise segment of flight. This is in contrast to the Glide Slope Track and Localizer modes which was only available during approach. PMS was an early version of Area Navigation (RNAV). Synthesized information from multiple ground-based navigation aids was fused with onboard Inertial Navigation Systems (INS). This enabled the aircraft automation to know its location laterally and vertically at any point in time to a much higher degree of accuracy than previously possible. The RNAV capability increased the number of functions it was possible to have the aircraft perform, including enabling it to automatically fly between waypoints defined laterally and vertically.
2.2.3 Third Generation Aircraft: B757 (1983)
The third generation of jet transport aircraft incorporated multiple radical changes from previous generations, many driven by a Presidential Task Force which allowed widebody aircraft to be flown by two person crews. In order to reduce the workload on the smaller crew, airline manufacturers automated more aircraft systems and graphical displays were used rather than analogue dials to allow more rapid retrieval of information. The Boeing 757/767 was the first of
Figure 2.5: Vertical/Speed Modes in the B747
Figure 2.6: Lateral Modes in the B747
Stab Augmentation Attitude Control State Control Trajectory Control Envelope Protection
Turn/Pitch Knob Altitude Hold Glide Slope Track Glide Slope Arm Perf. Management Sys. Turbulence
IAS Speed (pitch) Vertical Speed
Speed Retained from B727
Altitude Capture/Select New on B747
Stab Augmentation Attitude Control State Control Trajectory Control Envelope Protection
Yaw Dampers Turn/Pitch Knob Heading Select Localizer
Heading Hold Perf. Management Sys. Retained from B727
the breed of “glass cockpit” aircraft and will be used as the example in this section (Boeing, 1988). This cockpit design is also very similar to those used in successive Boeing aircraft.
Figure 2.7 shows the Vertical/Speed modes in the B757. Shaded modes are those from previous generations, and those crossed out are modes which were not carried forward to the third generation.
The B757 exchanged the Turn/Pitch knob for Control Wheel Steering, which can allow direct control over aircraft attitude. It is hypothesized that the Turbulence mode was removed because its function could be handled by a more capable Altitude Hold mode. IAS Speed was replaced with a more capable Flight Level Change mode, designed to allow efficient climbs and descents. Additional modes, such as Thrust Hold, were added to allow more complete control over the autothrottle. Engine Pressure Ratio (EPR) mode was used to allow fuel efficient flight. Takeoff and Go Around mode were used to control the thrust setting to predefined levels during critical flight segments. The Flare mode was used during autoland maneuvers. The PMS was replaced with a more capable Vertical Navigation mode consisting of Path, Speed, and Altitude submodes. Automatic envelope protection also appeared in this generation. Stall protection automatically added power when approached a stall condition. Overspeed conditions were dealt with by reducing the throttle to an idle setting and controlling the aircraft to a maximum safe airspeed.
In the lateral domain, additional state level modes were added to assist during critical maneuver near departure and approach. Rollout was added to assist in post-touchdown
Figure 2.7: Vertical/Speed Modes in the B757
Stab Augmentation Attitude Control State Control Trajectory Control Envelope Protection
Turn/Pitch Knob Altitude Hold Glide Slope Track Stall protection Control Wheel Steering Glide Slope Arm Perf. Management Sys. Overspeed protection
Turbulence VNAV Path
IAS Speed (pitch) VNAV Speed Vertical Speed VNAV Altitude Speed
Altitude Capture/Select EPR
Takeoff
Flare Retained from B727
Go Around Retained from B747
Flight Level Change New on B757
maneuvers. A Lateral Navigation (LNAV) mode replaced the PMS system in the B747. The LNAV system was also augmented through the use of a “moving map” display which showed the aircraft position graphically in the context of ground based navigations aids.
2.2.4 Fourth Generation Aircraft: B777 (1995)
The most modern generation of aircraft represent the fourth generation of automation and have been introduced since 1988, starting with the A320 (Honeywell, 1992), and continuing with the B777 (Boeing 1997). These aircraft differ from previous generations in that they are Fly-By-Wire rather than cable-actuated: control signals are carried via electrical impulses rather than over mechanical or hydraulic linkages. In practice the distinction to the pilot can be made to be minimal, but a fundamental change is that the inputs from the pilot are now always processed by a computer before the actuation occurs. Automation has become a necessity to fly these aircraft. This capability has been enabled by the adoption of much higher bandwidth digital buses and by placing additional computational power into the aircraft. The latter enables signal processing to occur fast enough to allow interaction with low level flight control.
In the Vertical/Speed domain, Figure 2.9 shows that few additional modes have been added. Shaded modes are those from previous generations, and those crossed out are modes which were not carried forward to the fourth generation. Fly-by-wire (FBW) is used for stability augmentation and serves to interpret any manual control from the pilot. Flight Path Angle mode is used to fly a ground-referenced descent path. This is in contrast to Vertical Speed, which flies an air-referenced descent.
The lateral modes have been augmented by the FBW system as well. A new attitude control mode, ATT: Hold Engage, is used to maintain a roll immediately upon engaging the autopilot. Track Select and Track Hold are the ground-referenced equivalents to Heading Select and
Figure 2.8: Lateral Modes in the B757
Stab Augmentation Attitude Control State Control Trajectory Control Envelope Protection
Yaw Dampers Turn/Pitch Knob Heading Select Localizer
Control Wheel Steering Heading Hold Perf. Management Sys.
VOR Track LNAV Retained from B727
Rollout Retained from B747
Takeoff New on B757
Heading Hold. Finally, Envelope Protection has been extended to the lateral domain. AutoBank Limiting limits the bank angle during aggressive high altitude turns to prevent loss of altitude.
2.2.5 Technical Factors in Evolutionary Growth
Multiple technical factors have contributed to the evolutionary growth of aircraft. Advances in control theory have resulted in a capability for more optimal control. Advances in multivariable control have generated systems capable of smooth transitions utilizing blended control. Servomechanism work has created control surfaces with better response, especially when coupled with the switch from hydraulic to electrical actuation. Increases in computing power and memory densities have enabled more complex flight paths to be calculated and flown and, when used in conjunction with advanced display technology, have created moving map displays to increase situational awareness. The move from analogue to digital flight controls has allow a large number of changes, both in physical signal transmission, and in the interpretation of pilot inputs. For
Figure 2.9: Vertical/Speed Modes in the B777
Figure 2.10: Lateral Modes in the B777
Stab Augmentation Attitude Control State Control Trajectory Control Envelope Protection
FBW System Turn/Pitch Knob Altitude Hold Glide Slope Track Stall protection Control Wheel Steering Glide Slope Arm Perf. Management Sys. Overspeed protection
Turbulence VNAV Path IAS Speed (pitch) VNAV Speed Vertical Speed VNAV Altitude Speed
Altitude Capture/Select EPR
Takeoff
Flare Retained from B727
Go Around Retained from B747
Flight Level Change Retained from B757
Thrust Hold New on B777
Flight Path Angle Removed
Stab Augmentation Attitude Control State Control Trajectory Control Envelope Protection
Yaw Dampers Turn/Pitch Knob Heading Select Localizer Auto Bank Limiting FBW System Control Wheel Steering Heading Hold Perf. Management Sys.
ATT: Hold Engage VOR Track LNAV
Rollout Retained from B727
Takeoff Retained from B747
Go Around Retained from B757
Track Select New on B777