HAL Id: lirmm-01184562
https://hal-lirmm.ccsd.cnrs.fr/lirmm-01184562
Submitted on 16 Aug 2015
HAL is a multi-disciplinary open access
archive for the deposit and dissemination of
sci-entific research documents, whether they are
pub-lished or not. The documents may come from
teaching and research institutions in France or
abroad, or from public or private research centers.
L’archive ouverte pluridisciplinaire HAL, est
destinée au dépôt et à la diffusion de documents
scientifiques de niveau recherche, publiés ou non,
émanant des établissements d’enseignement et de
recherche français ou étrangers, des laboratoires
publics ou privés.
RNA-SequenLens for Visualizing RNA Secondary
Structures
Florence Ying Wang, Arnaud Sallaberry, Mathieu Roche
To cite this version:
Florence Ying Wang, Arnaud Sallaberry, Mathieu Roche. RNA-SequenLens for Visualizing RNA
Secondary Structures. BioVis: Biological Data Visualization, Jul 2015, Dublin, Ireland.
�lirmm-01184562�
RNA-SequenLens for Visualizing RNA Secondary Structures
Florence Ying Wang Arnaud Sallaberry Mathieu Roche
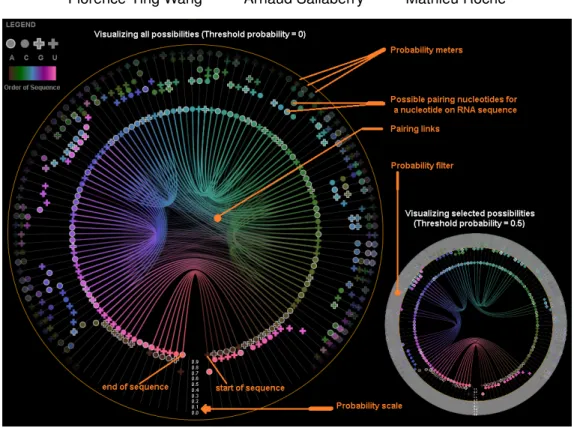
Fig. 1. Visualizing all the possible base pairing probabilities of ancestral(chimp) RNA with RNA-SequenLens. A threshold probability can be set interactively by the probability filter to determine the amount of pairing links shown in the center of SequenLens.
Abstract—In this paper, we present RNA-SequenLens to facilitate the visualization and comparison of RNA secondary structures.
With RNA-SequenLens, all possible base pairings of a RNA sequence can be visualized at the desired probability threshold. Different RNA secondary structures can be easily compared. The interactive demo is available at https://youtu.be/C6EDC8LZJXw
1 INTRODUCTION
Traditionally, computational biologists use dot-plot to visualize the base pairing probabilities, where each grid on N × N grids encodes the base pair binding probability [3]. Furthermore, the predicted sec-ondary structure is often represented as a graph or arc diagram [1]. Although these visualizations have been popular, they have limitations such as: (1) with dot-plot and arc diagram, possible pairing nucleotides are not easily perceived, therefore it is difficult to compare RNA struc-tures; (2) rainbow colors are often adopted, which can not reveal the characteristics of data that has implied ordering [2]. In this paper, we introduce a visual design called “RNA-SequenLens” to address above problems and the visualization tasks raised in the re-design contest.
• Florence Ying Wang, LIRMM & Universite de Montpellier, France. E-mail: [email protected].
• Arnaud Sallaberry, LIRMM & Universite Paul Valery Montpellier, France. E-mail: [email protected].
• Mathieu Roche, TETIS & LIRMM& CIRAD, France. E-mail: [email protected]
2 VISUALIZATIONREQUIREMENTS FORCHALLENGE1AND2 The overall purpose of challenge 1 is to design an intuitive visual rep-resentation of RNA secondary structure to encode the uncertainty for all the possible base pairing possibilities. Detailed visualization re-quirements for challenge 1 are summarized as follows:
[T1-1] Visualizing a RNA sequence.
[T1-2] For each nucleotide (i.e. A, C, G, U) on a RNA sequence, vi-sualizing its possible pairing nucleotides.
[T1-3] For a RNA sequence, visualizing all base pairing possibilities. The overall purpose of challenge 2 is to design a visual representation that supports comparison of the predicted RNA structures. Detailed visualization requirements for challenge 2 are summarized as follows: [T2-1] Comparing different RNA sequences.
[T2-2] Comparing different predicted RNA secondary structures. 3 VISUALMAPPING
The features of RNA-SequenLens are shown in Figure1.
(1) For [T1-1], a RNA sequence is displayed circularly in the inner most circle, then color is used to encode the order of nucleotides on the RNA sequence. As shown by the legend, RNA sequence start with brown and ends with pink (i.e. counterclockwise). For visualizing dif-ferent nucleotides, we use “circle” to present A (with outline) and C (without outline), “cross” to represent G (with outline) and U (without outline). This is due to the fact that A is likely to bind with U and C is
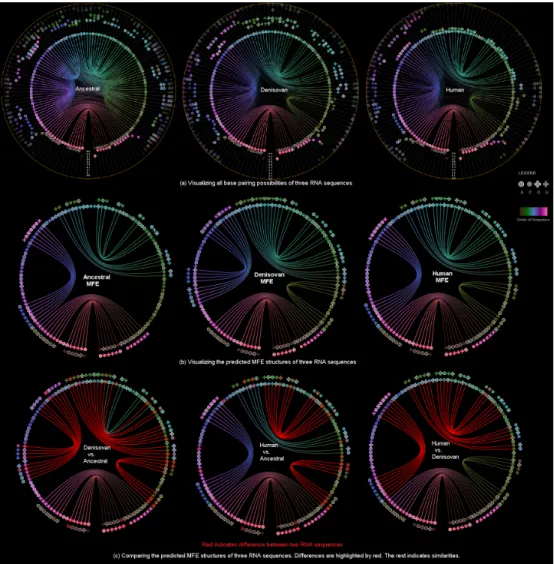
Fig. 2. Visualizing the changes of RNA primary and secondary structures of Ancestral(chimp), Denisovan and Human with RNA-SequenLens.
likely to bind with G. Hence, in SequenLens, circles often bind with crosses.
(2) For [T1-2], we plot one probability meter for each nucleotide on a RNA sequence. On the probability meter of a nucleotide, all its possible pairing nucleotides are displayed sequentially based on prob-abilities. The closer the pairing nucleotides to the center, the higher the probability. Paring links are used to link possible binding nu-cleotide pairs. The color of a Pairing link is gradient color that gradu-ally changes from one nucleotide color to its pair’s color. The opacity of both pairing links and pairing nucleotides on probability meters in-dicate probabilities. The higher the opacity, the higher the probability. (3) For [T1-3], we introduce a probability filter (gray mask in Figure1 right corner) to allow the interactive visualization of pairing possibil-ities at the desired threshold. By interactively changing the size of the probability filter, paring links of different probabilities will be dis-played in the center of SequenLens.
(4) The visualization of predicted RNA secondary structures (e.g. MFE structure) can be considered as a special case of uncertainty visu-alization where the threshold probability is fixed (Figure2(b)). Then, for [T2-1][T2-2], we can highlight the differences between two RNA sequences and their predicted secondary structures (Figure2(c)). 4 CASESTUDIES
In this section, we use two case studies to further illustrate our visual design in solving problems raised in the re-design contest.
Case Study 1: Visualizing Uncertainty of Ancestral RNA In Fig-ure1, circles often pair with crosses, symbols with white outlines often
pair with symbols without outlines, which validate the binding proper-ties of A, C, G, U. Also, there is a strong likelihood of pairing between the start and end segments of the sequence. By changing the probabil-ity threshold to 0.5 (Figure1right corner), we can see that there are 3 major groups of base pairings indicated by 3 major pairing link colors: green, purple and pink. This finding also aligns with the 3 groups of pairing linksin the MFE structure (1st image Figure2(b)).
Case Study 2: Visualizing Sequence Evolution In Figure2(c), the first image shows that between the MFE structures of denisovan and ancestral, segments with the most variations in primary structure also have the most difference in secondary structure. The middle im-age shows that human and ancestral have less differences in the MFE structure than human and denisovan, whereas the last image indicates that human and denisovan have the least differences in terms of RNA primary structure (only 1 nucleotide is different).
5 CONCLUSION
In this paper, we have introduced RNA-SequenLens for visualizing RNA secondary structures. Our case studies show the effectiveness of our design in visualizing uncertainty and sequence evolution. REFERENCES
[1] D. P. Aalberts and W. K. Jannen. Visualizing rna base-pairing probabilities with rnabow diagrams. RNA, 19(4):475–478, 2013.
[2] D. Borland and R. M. Taylor II. Rainbow color map (still) considered harmful. IEEE computer graphics and applications, 27(2):14–17, 2007. [3] I. L. Hofacker. Vienna rna secondary structure server. Nucleic acids