Archaeological Arsenical Bronzes
and Equilibrium in the As-Cu System
The MIT Faculty has made this article openly available. Please share
how this access benefits you. Your story matters.
Citation
Mödlinger, Marianne et al. "Archaeological Arsenical Bronzes and
Equilibrium in the As-Cu System." Metallurgical and Materials
Transactions B 49, 5 (July 2018): 2505–2513 © 2018 The Minerals,
Metals & Materials Society and ASM International
As Published
https://doi.org/10.1007/s11663-018-1322-8
Publisher
Springer Science and Business Media LLC
Version
Author's final manuscript
Citable link
https://hdl.handle.net/1721.1/128610
Terms of Use
Article is made available in accordance with the publisher's
policy and may be subject to US copyright law. Please refer to the
publisher's site for terms of use.
Archaeological Arsenical Bronzes and
Equilibrium in the As-Cu System
Marianne Mödlinger, Andreas Cziegler, Daniele Macció, Holger Schnideritsch, Benjamin Sabatini
Corresponding author: Marianne Mödlinger
IRAMAT-CRP2A - UMR 5060 CNRS, Université Bordeaux Montaigne Maison de l’archéologie, Esplanade des Antilles, 33607 Pessac, France email: marianne.modlinger@u-bordeaux-montaigne.fr
Tel.: +33.0680.54.41.90 (France)
Andreas Cziegler
Lehrstuhl für Gießereikunde, Montanuniversität Leoben Franz-Josef-Strasse 18, 8700 Leoben, Austria
Daniele Macciò
Dipartimento di Chimica e Chimica Industriale, Università degli Studi di Genova Via Dodecaneso, 31, 16146 Genova, Italy
Holger Schnideritsch
Lehrstuhl Nichteisenmetallurgie, Montanuniversität Leoben Franz-Josef-Strasse 18, 8700 Leoben, Austria
Benjamin Sabatini
Department of Materials Science & Engineering, Massachusetts Institute of Technology, 13-5065, 77 Massachusetts Avenue, Cambridge, MA 02139-4307, USA
Abstract
Understanding the effects of impurities, segregation, undercooling, and solidification velocity is necessary to reconstruct prehistoric As-Cu alloy manufacturing processes and practices. Moreover, these alloys often contain a wide variety of minor and trace elements so that the binary As-Cu
equilibrium phase diagram is not yet a full and adequate representation of the system in relation to arsenical bronze artifacts as-cast in ancient molds. Furthermore, the variable cooling rates in as-cast As-Cu predominant alloys due to mold material choice would have had profound effects on the formation of inversely segregated arsenic.
Alloys with 1–15 wt.% arsenic were prepared and studied using differential thermal analysis (DTA), metallography, and scanning electron microscopy with energy-dispersive X-ray spectroscopy (SEM-EDXS). Equilibrium diagrams were established and the potential influence of trace elements discussed. A new liquidus curve for the equilibrium diagram in this composition range, slightly higher in temperature, was established.
Keywords
Introduction
Arsenic-copper alloys were the first alloy intentionally produced by mankind, appearing in the archaeological record as early as c. 5000 BC on the Iranian plateau, and later in Central Europe in the fourth and early third millennium BC [cf. 1]. Although commonplace in prehistory, they were replaced by safer and more capable alloys such as tin-bronzes and brasses, and have since had few historic applications. Because of their early prehistoric origins and manufacture, the alloy is highly important to archaeologists seeking to interpret the pyrotechnological past. The study of the As-Cu system is therefore essential to improve our understanding of prehistoric metallurgy.
In order to understand solidification in the As-Cu binary system, providing useful information for the interpretation of ancient arsenical bronzes, we have measured phase formations in the regions of 1 – 15 wt.% arsenic at cooling rates from 2 – 20 K/min, and compared them to two reference equilibrium phase diagrams [2-3]. For most casting scenarios, local interfacial equilibrium is sufficient in explaining the temperature and composition of phase boundaries, even at significant undercooling and in non-uniform phase compositions [4].
The paper is structured in the following manner. The ancient production and history of As-Cu alloys, and recent related research, are briefly discussed. Following this, the experimental protocol and methodology is outlined. Preparation of several As-Cu ingots for Differential Thermal Analysis (DTA), taken at several progressively increasing cooling rates and weight percentages of arsenic, are then given. The acquired DTA data were then plotted and tabulated.
The results of this study provide insight into the relationship between As-Cu alloy phase formation and prehistoric manufacturing practices in relation to cooling rate. It is likely that the microstructure of as-cast prehistoric As-Cu alloys would have been significantly affected by the choice of casting mold materials, causing severe arsenic enrichment on the surface of objects in even the least thermally conductive mold types available at the time. Knowledge of the formation of arsenic-rich phases in the system can aid in determining the manufacturing methodologies employed by prehistoric metalsmiths. Furthermore, it is clear that a significant means of arsenic loss in ancient metal, seen in the steady decline of arsenic from recycled ancient metal over time [5], is due to the ease at which arsenic-rich solute exudes to the surface of as-cast As-Cu alloys.
Background
Because of scant evidence, the production of ancient As-Cu alloys is not well understood. However, it likely varied significantly between regions and across time periods. Several possible means of production have been discussed by metallurgists, archaeologists, and historians, and include: 1) the combining of native copper with copper-arsenide minerals [1]; 2) the smelting copper ores rich in arsenic (e.g. Fahlore); 3) the reduction of roasted copper sulfarsenides such as tennantite and enargite [6]; 4) the co-smelting of oxidic and sulphidic ores such as malachite and arsenopyrite [7]; and 5) the melting together of speisses and copper [8]. There is currently no evidence for the ancient production and use of pure arsenic for alloying, or the cementation of arsenic vapor with copper.
With the onset of the production of tin bronzes in antiquity, so called arsenical bronzes (As-Cu alloys) were phased out, but in modern history, from the end of the 19th century AD, As-(As-Cu alloys were used in the manufacturing of boilerplates for steam engines [9-10]. The alloy has higher mechanical and chemical resistance than steel, and so was more suitable for locomotive fireboxes. Beyond its historic application, and with few exception [11-12], a lack of practical application of As-Cu alloys in modern society has resulted in a substantial lack of their study.
Interest in As-Cu alloys with more than 1 wt.% arsenic have been investigated almost exclusively in relation to archaeological interests in recent years [13-14]. However, these studies have
typically focused on the initial production of the alloy rather than its secondary processing and working. Of these studies only a handful exist, including, but not limited to, H. Lechtman [6-7, 15], P. Budd [16-17], P. Northover [18], and J. R. Marechal [19] study on the alloy’s mechanical properties. Outside of archaeological interests, the As-Cu system has most recently been assessed by Subramanian – Laughlin [2
]
, and optimized by Pei et al. [3]. It is from these two works that comparisons to our DTA results have been made.Common to all archaeologically related research of the alloy, and misleading in studies focused on archaeological questions regarding an objects’ use and technological placement in prehistory, is their reliance on the As-Cu equilibrium phase diagram. In As-Cu alloys, phase formation depends on various factors such as pressure, solubility, cooling rates, and the homogeneity of the liquid metal. Thus the characterization of phases in arsenical copper artifacts may have led archaeometallurgists to incorrectly assess prehistoric metal material culture (see [20-21] for variable phase formation outcomes). The underlying problem being that inferences are drawn between identified phases and microstructures in artifacts to specific ancient manufacturing practices [1]. These interpretations are especially problematic when one considers the formation of inversely segregated arsenic. The term “inverse segregation”, found throughout archaeometallurgical literature, simply infers that arsenic solute had been enriched on the surface of As-Cu alloys due to solidification contraction and an increase in the liquid density during cooling. The term is also commonly found in modern casting and metallurgy related textbooks [22-24]. Arsenic-rich phases on the surfaces of archaeological As-Cu objects impart a silvery appearance that is retained without post-casting treatment; this may suggest intentionality. However, it has also recently been shown that post-depositional aging of the alloy over thousands of years can result in the formation of stable γ-phases on the surface. Gamma phases may appear silvery in color, but are not indicative of the intentional segregation of arsenic [1; 25].
The solidification of As-Cu castings, throughout historic and prehistoric metallurgy would have occurred at fast cooling rates and among various minor and trace elements, invoking non-equilibrated phase formations [26]. Segregation under such instances can occur when atoms in the liquid and solid phases are not able to move fast enough to establish equilibrium concentrations. For the solid, the movement is restricted by diffusion and controlled by temperature; while for the liquid, movement takes place by diffusion and convection. For the latter the extent of atom movement and flow pattern is dependent on several factors including the casting conditions mentioned above, and results in compositional gradients and non-uniform or dendritic / cored structures of inhomogeneous composition. A common result of the aforementioned factors often leads to the non-uniform distribution of alloying elements during non-equilibrated cooling, and to coring and segregation [27]. Discontinuous solidification and segregation, as a result of variations in casting such as the material, shape and temperature of the mold, as well as inconsistent temperature of the molten metal, leads to uneven solidification rates throughout a casting. Given the uniform phase formation was certainly an issue in prehistory [6, 8]. Differential thermal analyses at fast cooling rates, at up the maximum achievable by our equipment of 20 K/min, offer the possibility to better simulate and understand past casting conditions [28-29].
Experimental Protocol and Methodology
1. Alloys preparation
Several alloys weighing 200 g each were prepared with electrolytic copper and arsenic lump (99.99 wt.% pure) using the below procedure. The ingots were prepared with the nominal compositions of 1, 2, 3, 4, 5, 6, 7, 11, 15 wt.% arsenic. The copper was placed into graphite crucibles, covered, and
heated until molten in an electric furnace. Graphite was chosen in order to prevent losses of volatile arsenic oxides during preparation of the ingot. When the furnace reached 1373 K (1100 °C), the arsenic lump was added to the molten copper through an aluminum pipe and the crucible and furnace immediately covered and closed. The addition of the arsenic to the melt often resulted in flames. The flames are caused by an exothermic reaction and the oxidation of hot arsenic vapors that come into contact with oxygen in the atmosphere. The furnace temperature was then increased to 1378 K (1115 °C), held for 30 minutes at this temperature to homogenize the alloys, then the alloy was cast into cast-iron molds at 25 °C.
2. DTA-analyses
Once cast, and upon cooling to room temperature, samples of approximately 0.7 — 1.0 g were cut for DTA (model: NETZSCH DSC 404C) from the top of the ingots. A horizontal cross-section of the ingot was sampled to account for segregation effects caused by the use of iron molds. The samples were placed in tantalum crucibles that were sealed by welding under a pure argon atmosphere. The argon prevented the oxidative losses of arsenic. Each sample was heated to 1100 °C within the tantalum container and held for 1 minute, and cooled at progressively increasing rates. For all rate measurements, the same samples were used and the crucibles were not opened. Cooling rates were fixed at 2 K/min, 5 K/min, 10 K/min, and 20 K/min. For the measured temperatures, the accuracy was estimated to be ± 1-3 °C for T ≤ 700 °C, and ± 3-5 °C T for > 700 °C. Evident contamination of the alloy by the crucible material was not observed by SEM-EDXS. Exothermic reactions and transformations that occurred during the solidification process were recorded and plotted. The acquired data provided the liquidus, solidus, and eutectic transformations and reactions for each run.
3. Phase analyses
The DTA samples were removed from the tantalum crucibles. Then they were embedded and mounted in hot epoxy resin. Sample cross-sections were polished with diamond paste of up to ¼ μm for bulk and microstructural analysis. The microstructures of each sample were then studied using light microscopy in bright and dark fields. The chemical compositions of the alloys were evaluated by energy-dispersive X-ray (EDX) spectroscopy (using a PENTAFET® EDXS detector sensitive to light elements, Z>5) connected to a scanning electron microscope (SEM, Evo40 Zeiss), and compared to the nominal alloy composition. The SEM operating conditions were an acceleration voltage of 20 kV, pressure of < 10−5 bars , with an acquisition time of 60 s. In order to increase the precision of the quantitative analyses, the microscope was calibrated with pure cobalt, physical standards, and ZAF 5 correction. The measured compositional error in our prepared As-Cu samples is estimated to be ± 0.4 wt.%.
Results
1. Alloy composition
The chemical compositions of the prepared alloys, before being subjected to the sequence of DTA measurements, were measured by SEM-EDXS (Table 1). As expected, the As-concentration in the ingot prepared was lower than that of the nominal (weighted before casting) composition. This was likely due to both volatilization during the addition of the arsenic lump, and segregation during the casting of the ingots (Figure 1). Such initial losses were taken into account in all following calculations.
Figure 1 - Deviation of the arsenic content before and after casting in relation to the DTA measurements. Y [wt.% EDXS] = y0 + aX [wt.% theoretical]. Y = 0.1405 + 0.8722X.
2.
Differential Thermal Analysis
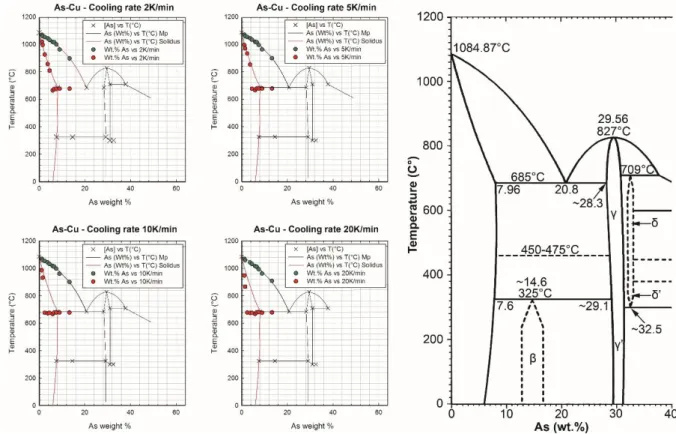
Using DTA, the liquidus and solidus/eutectic points were measured at several cooling rate intervals, plotted, and compared to equilibrium (see Table 1 and Figure 2). In contrast to the data published by Subramanian – Laughlin [2], the DTA results obtained for the liquidus are tendentially higher, and the eutectic temperature significantly lower [958 K (685 °C) compared to 945-952 K (672-679 °C)]. Our liquidus data corresponded better to those found by Pei et al. [3] than those by Subramanian – Laughlin [2].
Due to coring, where the center of a grain is poorer in solute, and/or increased cooling rates, the eutectic can form at lower temperatures and at alloy compositions where, contrary to the equilibrium phase diagram, it should not exist [30-31]. The presence of impurities may also contribute to the formation of an uncharacteristic eutectic [32]. A lower temperature eutectic occurs, and is frequently detected during undercooling, because the DTA measurements typically record some deviation. A more accurate measurement can be obtained by zero rate extrapolation [33].
Figure 2 - Left: DTA cooling rate results at 2, 5, 10, and 20 K/min for As-Cu. The drawn phases roughly correspond to the
equilibrium As-Cu phase diagram. Right: Equilibrium phase diagram of the Cu rich end of the Cu-As system illustrating a eutectic at 685°C and 20.8 wt.% As with a maximum solubility of 7.96 wt.% As; adapted and modified from Ref. [2]
DTA measurements at a cooling rate of 2 K/min were in good agreement with the equilibrium As-Cu phase diagram (Figure 2). However, alloys from 5.92 wt.% As and upwards were not detected
on the equilibrium solidus line, but are instead directly on the eutectic. No eutectic transformations were noted for alloys with up to 4.55 wt.% arsenic.
At 5K/min the alloys with a composition above 3.71 wt.% arsenic were not detected on the equilibrium solidus, but on the eutectic, which appears in each instance at lower temperatures. The measured solidus values were in agreement with those at equilibrium. At lower compositions, and up to 3.71 wt.% arsenic, there was no recorded eutectic transformation.
Increasing the cooling rate to 10 K/min resulted in a lower temperature solidus, following the decreasing trend from 5 K/min and 2 K/min. It was found that the solidus was reached at significantly lower temperatures for the 1.18 and 1.56 wt.% arsenic samples than those that had undergone slower cooling. Only the 5.92 wt.% arsenic alloy showed the eutectic transformation significantly below equilibrium at 939 K (666 °C).
At 20 K/min the 3.71 and 4.55 wt.% arsenic alloys showed a lower temperature liquidus and solidus transformation. A non-equilibrated eutectic transformation was also noted for all alloys from 2.44 wt.% upwards at 948-952 K (675-679 °C).
3. Metallography
After completion of the DTA measurements, each alloy was removed from their tantalum crucibles, sampled, and characterized under optical light microscopy. Only the As-Cu-1 sample was etched with 5% FeCl3 aqueous solution (see Figure 3). Gamma-phase was detected in small, but increasing
amounts with increasing arsenic in all samples except As-Cu-1. It appeared mainly on the surface of the alloys, or close to regions with shrinkage porosity. The γ-phase concentrated on the metal’s surface and formed a thin and almost continuous layer from the As-Cu-6 sample through As-Cu-15. The layer did not form a smooth edge, but was instead frayed, as was As-Cu-3. The thickness of the
layer also increased with increasing amounts of arsenic, as does the appearance of non-equilibrated
(α+γ) eutectic. Beginning with As-Cu-2 (with 1.6 wt.% arsenic), and continuing to As-Cu-15, a non-equilibrated (α+γ) eutectic was also identified, and, too, in increasing amounts with increasing arsenic. The formation of the eutectic is archaeologically important as it has been shown to occur during the segregation of arsenic in cast As-Cu alloys, even at less than 2 wt.% [1]. For the analyzed phases, and contrary to first-principle calculations and a tentative study of the As-Ta binary system [34-36], no Ta contamination from the crucibles was detected in the samples. The combination of past assessments, and calculations, of the Cu-Ta system, have, however, predicted a eutectic at 1072 °C and 1.2 at.%, and 1065.7 °C and 1.8 at.% Ta, respectively [37-40].
Figure 3 also illustrates the difference between the microstructure of the 20 K/min DTA samples (Rows A-C) and the original as-cast ingots (Row D). Row E shows micrographs of Bronze Age Caucasian daggers, which exemplify the fairly typical presence of minor and trace elements in ancient alloys.
Figure 3 – Row A-C (from left to right): Microstructure of As-Cu alloys from the 20 K/min DTA cooled sample. Note the
increasing amounts of γ-phase and (α+γ) eutectic with increasing amount of As. As-Cu-1 was etched with FeCl3; and the others untreated. The black areas in the centre of the samples are mainly interdendritic porosity. In As-Cu-1 - As-Cu-3, the arsenic is mainly in the α-solid solution. As-Cu-4 and As-Cu-5 showed increasing γ-phase and α+γ eutectic. Arsenic-rich and arsenic-poor zones of the α-solid solution are visible even without etching. As-Cu-7 As to Cu-15 showed significant amounts of γ-phase and α+γ eutectic, and increasing porosity. As-Cu-11 and As-Cu-15 showed “inverse segregation” of α+γ eutectic on the surface of the samples (see also [1]). Row D: Microstructure of selected as-cast ingots (As-Cu 4, As-Cu-6, and As-Cu-8). Row E – Microstructure of an archaeological As-Cu alloy Caucasian Bronze Age dagger c. 1000 BC [B] (from left to right): The alloy was cold deformed and annealed, and gamma phase precipitated on the surface and along the grain boundaries. No As was found in the corrosion. Dark inclusions of CuS were present with c. 21 wt.% S, and white inclusions of mainly of Cu-Pb with c. 20–22 wt.% Pb. Within the latter were other elements such as Sb, Sn, and Ag, each with up to 1.5 wt.%.
Discussion
Phase formation in several As-Cu alloys in the range of 1-13 wt.% As, were analysed at several cooling rates with DTA (2, 5, 10, and 20 K/min). The microstructure of the 20 K/min samples were imaged and compared to the same as-cast alloys from iron molds, which are close to as-casts produced in prehistory in terms of cooling speed. The potential influence of impurities is especially important in relation to ancient alloys since they affected phase formations that should otherwise not be present in the binary system. In the case of our experiments, our DTA measurements could have been even influenced by Ta contamination from the crucible that would significantly offset phase formation from the equilibrium diagram. Similarly, the influence of individual impurities in historic and prehistoric copper alloys, which often exceed 1 wt.%, would have had a profound effect. Most notably, copper-based artifacts often contain unintentional Ag, Co, Fe, Ni, Sb, and, especially more common and problematic, O and S (all in percentage amounts).
Possible problems associated with the crucible, i.e. potential reactions between Cu and Ta and As and Ta, are discussed below in relation to our current experimental results and past assessments for the As-Ta and Cu-Ta systems. The majority of the recorded solidus values in our experiments were problematic, being significantly offset due to a likely reaction between Cu and Ta between 1100 and 1065.7 °C, and possible additional reaction(s), which resulted in the premature stabilization of the eutectic of the As-Cu system, while it should not exist. We also recorded a significantly lowered solidus for all the runs but the 2 K/min ones that plotted on the eutectic. For all samples, only the 2 K/min cooling runs showed results comparable to the equilibrium diagram for the majority of the DTA solidus points, which instead deviated substantially further all the other (faster) cooling rates.
During cooling from 1100 °C to the Cu-Ta eutectic, a thin layer of the Ta crucible was likely made mushy without diffusing into the sample, having its melting point lowered by the presence of liquid Cu. Despite this reaction the crucible remained intact and sealed; and it did not seem to offset our DTA results for the liquidus for the compositional percentages that were tested. Once cooled to the eutectic, solid Ta and As-Cu phases may have precipitated due to the extremely low solubility of Ta in Cu [38]. It is very likely that no diffusion of Ta into the sample occurred by virtue of the predominance of Cu in the system, and the limited time (i.e. the alloys were kept in the liquid state) the Ta spent mushy. Despite the suspected formation of AsTa3 [35], no evidence of this compound
was found in the samples; it is not possible, however, to exclude its formation onto the inner walls of the crucible. Unfortunately, these are not preserved anymore. However, a similar reaction has been noted by Gröbner et al. [41] in their study of the Mg-Mn binary system. In this case a reaction between Ta and Mn led to the formation of a TaMn2 phase layer along the inner wall of the Ta
crucible. Notably, only a preliminary assessment of the As-Ta system has been made [34-35], making it difficult to ascertain what reactions, and whether a similar situation to that reported by Gröbner et al. [41], occurred.
Despite these lack of data, it is possible that the thermal diffusivity of the experimental setup might have been altered during cooling by a reaction between Cu and Ta, and that unaccounted additional reactions between As and Ta, likely further spurred by increasing concentrations of As inversely segregating to the surface of the sample with increasing cooling rates, were responsible for our recorded eutectic and solidus temperatures. As evidenced by our DTA results, for almost every concentration of As departure from equilibrium was least apparent for the 2 K/min cooling rate compared to the 5, 10, and 20 K/min cycles. The offset from equilibrium during the 2 K/min cycle occurred at 6 wt.%, which may be the point where the concentration of As was sufficient relative to the cooling rate for a reaction to occur between As and Ta; likewise, the same may be true for the 5 K, 10 K, and 20 K cycles at 5 wt.%, 3 wt.%, and 1 wt.%, respectively. A combination of increased
cooling rate, and additional unrealized reactions, undoubtedly also had profound effects on heat transfer and phase formation in metal artifacts.
Our results, although faulty, bring to light an issue common to some archaeometallurgical studies in regard to the characterization of metal types by the identification of phases and the practice of focusing only on the major alloying elements [2]. With few exceptions in archaeometallurgy, in instances where chemical analyses have shown that artifacts contain far more than a few weight percent of an element [42], it has been commonplace to ignore trace, minor, and alloying elements in favor of classification schemes meant to categorize chemically complex artifacts into archaeological and historical narratives associated with binary systems. Since these elements, often carried over as impurities from copper ores (such as Au, Ag, Sb, As, Ni, O, S, Fe, Co, Bi, P, of which As, Ni, Sb, Fe, S, O) regularly account for over 1 wt.%, are not typically considered, their influence on phase formation is disregarded. In respect to the influence of these impurities on phase formation, and unlike modern alloys, artifacts can often contain a vast multitude of additional elements, making their characterization, and understanding their influence, extremely difficult (e.g. [43]). As shown by our DTA data, a binary phase can lie dramatically eschewed from equilibrium by the presence of these additional elements and/or the influence of cooling rate. Other aspects of typologically assigned archaeological alloys that may have been influenced by unaccounted elements, depending on their amount, are grain size and physical properties such as hardness and ductility, e.g. [6]. Ideally, the best course of action in investigating metal artifacts would be to understand relevant systems in their entirety, or at least to work towards that goal rather than generalizing and interpreting objects by discounting their composition to simple binaries.
Conclusion
Compositional analyses of the ingots were carried out using SEM-EDXS, and compared to their As-weighted amounts before alloying. Some losses of arsenic were noted during preparation of the ingots due to volatilization and segregation during DTA. The acquired data accounts for phases up to 13.5 wt.% arsenic. The results show that the liquidus measured slightly above equilibrium – hence an
improvement to the last assessment of the As-Cu system [3] – and theeutectic equilibrium present at 945-952 K (672-679 °C). With increasing cooling rates, the liquidus’ of each alloy were not significantly affected and were recorded at only slightly higher temperatures; however, the solidus and eutectic had noticeably deviated with the former, occurring at as much as 288 K (15 °C) lower with respect the assessed diagram. Our results in As-Cu alloys with less than 2 wt.% As also show the presence of the γ-phase and (α+γ) eutectic (Figure 3, row D). The latter is especially important in the interpretation of ancient arsenical bronzes because of the increased cooling rates imparted by any ancient mold materials (e.g. stone, terracotta, and quartz sand). Dendritic and inverse segregation would have occurred readily using these mold materials. It should be noted that the inverse segregation of arsenic has even been shown possible in steatite molds, which has a thermal conductivity of roughly 3 W/m K at 25 ᵒC, that were preheated to 300 °C for As-Cu alloys containing 6 and 9 wt.% As [44].
Furthermore, the micrographs, both of the as-cast ingots and DTA specimens, suggest that , if the objects were secondarily worked or scalped after casting, the loss of arsenic would have been appreciable due to segregation. The loss of arsenic in form of volatile oxides, was shown to be relatively significant: first, compared to the volatility of pure arsenic species in ancient metallurgy [45], and second, due to segregation. These are the most probable and predominant contributors to the metalloids temporal from the archaeological record. These findings and data are especially important
when one considers the current focus in archaeometallurgy towards the understanding of the metal flow of ancient copper-based alloys.
The noted influence of Ta, as an impurity in this case, is important since it most likely affected phase formation. It has to be noted that the number of the studies of the As-Cu and As-Ta systems is not high, and our DTA results show at least that they warrant further investigation. In terms of the archaeological significance of our results, this research may be viewed as an further evidence and confirmation of the possible and likely influences of impurities in historic and prehistoric alloys that were considerably impure compared to modern standards. Ancient copper-based objects often contain up to several percent impurities, mostly the alloys such as arsenical and tin bronzes. These alloys are commonly identified by archaeologists and archaeometallurgists as bronzes, implying that they only contain As and Cu or Cu and Sn, respectively, and the impurities do not matter, when they in fact likely have many phase influencing elements. The identification of the phases in ancient bronzes is a cornerstone of archaeometallurgical research in the identification of choice of thre manufacturing technologies and preferences, . However, this research approach, given our results, may grossly mischaracterize the metallurgical past. We do not suggest that Ta played a significant role in historic and prehistoric casting, only that greater attention should be given to the presence of impurities and their connection to mold materials in relation to cooling.
Outlook
The results of this study strongly suggest that additional work is required to understand the complexities of ancient alloy composition and casting. Also, the interactions between the studied As-Cu alloys with the tantalum system needs further investigations. Fundamental studies on the influence of impurities, as they are common in modern and ancient alloys, on segregation and phase formation during undercooling and solidification, should be undertaken. Such studies are necessary to fully understand the As-Cu alloy manufacturing processes. Future simulations and casting of As-Cu alloys, accounting for present impurities when present and at various cooling rates , may help the understanding the past cultural material and make better contemporary choices for modern alloy production.
Acknowledgements
The authors acknowledge financial support provided by the European Union’s Horizon 2020 research and innovation programme under the Marie Skłodowska-Curie Actions, grant agreement no. 656244.
Bibliography
[1] M. Mödlinger and B. Sabatini: J. Archaeol. Sci., 2016, vol. 74, pp. 60–74.
[2] B. R. Subramanian and D. E. Laughlin: Bull. Alloy Phase Diagrams, 1988, vol. 9, p. 605.
[3] B. Pei, B. Björkman, B. Jansson and B. Sundman: Zeitschrift für Metallkunde, 1994, 85, 178–184. [4] D. M. Stefanescu: Science and Engineering of Casting Solidification, Springer, New York, 2015. [5] P. Bray, A. Cuenod, C. Gosden, P. Hommel, R. Liu and A.M. Pollard: Journal of Archaeological
Science, 2015, vol. 56, p. 202.
[6] H. Lechtman: J. Field Archaeol., 1996, vol.23, pp. 477–514.
[7] H. Lechtman and S. Klein: J. Archaeol. Sci., 1999, vol. 26, pp. 497–526.
[8] T. Rehren, L. Boscher and E. Pernicka: J. Archaeol. Sci., 2012, vol. 39, pp. 1717–1727. [9] Edward C. Rollason: Metallurgy for Engineers, Edward Arnold & Co, London, 1949.
[10] E.G. Garrison: A history of engineering and technology. Artful methods, 2nd ed., CRC Press, Boca Raton, 1998.
[11] J. Günter, K.J.A. Kundig, J.A. Konrad: Copper: Its Trade, Manufacture, Use, and Environmental
Status, Materials Park, Ohio, 1999.
[12] A. Nayar: The Metals Databook, McGraw-Hill Companies, New York, 1997.
[13] A. Giumla-Mair: The metal of the moon goddess, Surface Engineering, 2008, vol. 24, pp.110-117.
[14] F. Pereira, R.J.C. Silva, A. Soares, M. Araújo and J. Cardoso: Metallurgical production from the Chalcolithic settlement of Moita de Ladra, Portugal, Materials and Manufacturing
Processes,2016, pp. 1-11.
[15] H. Lechtman: Historical Metallurgy, 1985, vol. 19, p. 141.
[16] Paul D. Budd: A metallographic investigation of Eneolithic arsenical copper (University of Bradford 1991).
[17] Paul D. Budd: Historical Metallurgy, 1991, vol.25, p. 99.
[18] P. J. Northover: In: A. Hauptmann, E. Pernicka and G. A. Wagner, G. A. (eds). Old work
archaeometallurgy (Bochum 1989), pp. 111–118.
[19] J. R. Marechal: Métaux, Corrosion, Industries, 1958, vol. 33, p. 377. [22] ASM Handbook vol. 15: Casting, ASM International; 9th edition, 1988. [23] Fleming, M.C. Solidification Processing. McGraw-Hill, London, 1974.
[24] Glicksman, M.E. Principles of Solidification: An Introduction to Modern Casting and Crystal
Growth Concepts, Springer Science & Business Media, 2010.
[25] F. Pereira, R. Silva, A. Monge Soares, M. Araújo, M. Oliveira, R. Martins and N. Schell:
Microscopy and Microanalysis, 2015, vol. 21, pp. 1413–1419.
[30] W. Gutt and A. J. Majumdar: In: R. C. Mackenzie (ed). Differential Thermal Analysis Vol. II, Academic Press, New York, 1972, pp. 97–117.
[31] R. Ferro and S. Delfino. In: G. Della Gatta and A. Lucci (eds). Corso di Metodologie
Calorimetriche e Termoanalitiche, San Donato Milanese, 15 giugno 198, 1981, p. 53.
[32] L. K. Bigelow and J. H. Chen: Metallurgical Transactions B, 1976, vol. 7, pp. 661–669. [33] Y. T. Zhu and J. H. Devletian: J. Phase Equilib., 1994, vol. 15/1, pp. 37–41.
[34] J. J. Murray, J. B. Taylor, L. D. Calvert, Yu Wang, E. J. Gabe, J. G. Despault: Journal of the Less
Common Metals, 1976, vol. 46, pp. 311–320.
[35] Q. Han and R. Schmid – Fetzer: Materials Science and Engineering, 1994, B22, pp. 141–148. [36] J. Sun and D. J. Singh: Journal of Applied Physics, 2017, 121, 015101.
[37] J.D. Verhoeven, F.A. Schmidt, E.D. Gibson, and W.A. Spitzig: JOM, 1986, vol. 38, pp. 20–24. [38] P. R. Subramanian and D. E. Laughlin: Bull. Alloy Phase Diagr., 1989, 10, pp. 652–655. [39] P. R. Subramanian, D. J. Chakrabarti and D. E. Laughlin, Phase Diagrams of Binary Copper
Alloys, ASM International, Materials Park, OH, 1994.
[40] X. Liu, W. Huang, Y. Guo, S. Yang, Y. Lu, and C. Wang: Journal of Phase Equilibria and
Diffusion (JPEDAV), 2015, vol. 36/1, pp. 28–38.
[41] J. Gröbner, D. Mirkovic, M. Ohno, and R. Schmid-Fetzer: Journal of Phase Equilibria and
Diffusion (JPEDAV), 2005, vol. 26, pp. 234–239.
[42] S. Uhland, H. N. Lechtman & L. Kaufman: Calphad-Computer Coupling of Phase Diagrams and Thermochemistry, 2001, vol. 25, pp. 109–124.
[43] R. Krause, tudien zur upfer- und fr h ronzezeitlichen etallurgie zwischen arpaten ec en
und Ostsee, Vorgeschichtliche Forschungen 24 (Rahden 2003).
[44] N. V. Ryndina and L. V. Kon‘kova: Sovetskaya Archeologia, 1982, vol. 2, pp. 30–42. [45] B. J. Sabatini: JOM, 2015, vol. 67, pp. 2984-2992.
Figure captions
(all figures ONLY in the pdf/online version in color, otherwise in b/w)
Figure 1 Deviation of the arsenic content before and after casting in relation to the DTA measurements. Y [wt.% EDXS] = y0 + aX [wt.% theoretical]. Y = 0.1405 + 0.8722X.
Figure 2 Left: DTA cooling rate results at 2, 5, 10, and 20 K/min for As-Cu. The drawn phases roughly correspond to the equilibrium As-Cu phase diagram. Right: Equilibrium
phase diagram of the Cu rich end of the Cu-As system illustrating a eutectic at 685°C and 20.8 wt.% As with a maximum solubility of 7.96 wt.% As; adapted and modified
from Ref. [2]
Figure 3 Row A-C (from left to right): Microstructure of As-Cu alloys from the 20 K/min DTA cooled sample. Note the increasing amounts of γ-phase and (α+γ) eutectic with increasing amount of As. As-Cu-1 was etched with FeCl3; and the others untreated. The black areas in the centre of the samples are mainly interdendritic porosity. In As-Cu-1 - As-Cu-3, the arsenic is mainly in the α-solid solution. As-Cu-4 and As-Cu-5 showed increasing γ-phase and α+γ eutectic. Arsenic-rich and arsenic-poor zones of the α-solid solution are visible even without etching. As-Cu-7 As to Cu-15 showed significant amounts of γ-phase and α+γ eutectic, and increasing porosity. As-Cu-11 and As-Cu-15 showed “inverse segregation” of α+γ eutectic on the surface of the samples (see also [1]). Row D: Microstructure of selected as-cast ingots (As-Cu 4, As-Cu-6, and As-Cu-8). Row E – Microstructure of an archaeological As-Cu alloy Caucasian Bronze Age dagger c. 1000 BC [B] (from left to right): The alloy was cold deformed and annealed, and gamma phase precipitated on the surface and along the grain boundaries. No As was found in the corrosion. Dark inclusions of CuS were present with c. 21 wt.% S, and white inclusions of mainly of Cu-Pb with c. 20–22 wt.% Pb. Within the latter were other elements such as Sb, Sn, and Ag, each with up to 1.5 wt.%.
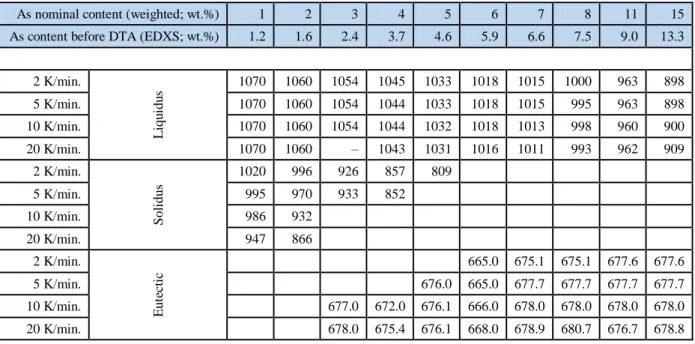
Table 1 DTA results for the liquidus, solidus, and eutectic of each As-Cu alloy.
Tables
Table 1 – DTA results for the liquidus, solidus, and eutectic of each As-Cu alloy.
As nominal content (weighted; wt.%) 1 2 3 4 5 6 7 8 11 15
As content before DTA (EDXS; wt.%) 1.2 1.6 2.4 3.7 4.6 5.9 6.6 7.5 9.0 13.3
2 K/min. L iqu idu s 1070 1060 1054 1045 1033 1018 1015 1000 963 898 5 K/min. 1070 1060 1054 1044 1033 1018 1015 995 963 898 10 K/min. 1070 1060 1054 1044 1032 1018 1013 998 960 900 20 K/min. 1070 1060 – 1043 1031 1016 1011 993 962 909 2 K/min. S ol idus 1020 996 926 857 809 5 K/min. 995 970 933 852 10 K/min. 986 932 20 K/min. 947 866 2 K/min. E ut ec ti c 665.0 675.1 675.1 677.6 677.6 5 K/min. 676.0 665.0 677.7 677.7 677.7 677.7 10 K/min. 677.0 672.0 676.1 666.0 678.0 678.0 678.0 678.0 20 K/min. 678.0 675.4 676.1 668.0 678.9 680.7 676.7 678.8