0099-2240/09/$08.00
⫹0 doi:10.1128/AEM.00228-09
Copyright © 2009, American Society for Microbiology. All Rights Reserved.
Investigation of Associations of Yarrowia lipolytica, Staphylococcus xylosus,
and Lactococcus lactis in Culture as a First Step in Microbial
Interaction Analysis
䌤
†
S. Mansour,
1‡ J. Bailly,
1‡ S. Landaud,
1C. Monnet,
1A. S. Sarthou,
1M. Cocaign-Bousquet,
2S. Leroy,
3F. Irlinger,
1and P. Bonnarme
1*
Agro Paris Tech-INRA, UMR 782 Ge
´nie et Microbiologie des Proce
´de
´s Alimentaires, 78850 Thiverval Grignon, France
1; UMR 5504,
UMR 792 Inge
´nierie des Syste
`mes Biologiques et des Proce
´de
´s, CNRS, INRA, INSA, 31400 Toulouse, France
2; and
INRA, Centre de Clermont-Ferrand-Theix, Unite
´ Microbiologique, Qualite
´ et Se
´curite
´ des Aliments,
63122 Saint-Gene
`s Champenelle, France
3Received 30 January 2009/Accepted 10 August 2009
The interactions that may occur between microorganisms in different ecosystems have not been adequately
studied yet. We investigated yeast-bacterium interactions in a synthetic medium using different culture
associations involving the yeast Yarrowia lipolytica 1E07 and two bacteria, Staphylococcus xylosus C2a and
Lactococcus lactis LD61. The growth and biochemical characteristics of each microorganism in the different
culture associations were studied. The expression of genes related to glucose, lactate, and amino acid
catab-olism was analyzed by reverse transcription followed by quantitative PCR. Our results show that the growth
of Y. lipolytica 1E07 is dramatically reduced by the presence of S. xylosus C2a. As a result of a low amino acid
concentration in the medium, the expression of Y. lipolytica genes involved in amino acid catabolism was
downregulated in the presence of S. xylosus C2a, even when L. lactis was present in the culture. Furthermore,
the production of lactate by both bacteria had an impact on the lactate dehydrogenase gene expression of the
yeast, which increased up to 30-fold in the three-species culture compared to the Y. lipolytica 1E07 pure culture.
S. xylosus C2a growth dramatically decreased in the presence of Y. lipolytica 1E07. The growth of lactic acid
bacteria was not affected by the presence of S. xylosus C2a or Y. lipolytica 1E07, although the study of gene
expression showed significant variations.
Complex microbial activities play an important role in
nu-merous biological transformations, such as the cheese-ripening
process. The global activity of a mixed microbial community is
determined by the functions of each species (e.g., yeast and
bacteria), which are strongly influenced by the interactions
between the different partners. However, the current
knowl-edge of microbial physiology is generally based on pure-culture
studies performed under conditions that are different from
those encountered in a complex ecosystem. As a consequence,
performing mixed-culture studies is an essential way to get
closer to the reality of a complex community.
One key limitation of such studies is the fact that most of the
approaches used to study microbial communities are
essen-tially descriptive and examine the influence of one microbial
species on another microbial species based only on
identifica-tion (e.g., 16S rRNA phylogeny) or enumeraidentifica-tion (e.g.,
fluores-cent in situ hybridization). Nevertheless, some articles mention
the use of DNA biochips with rRNA gene sequences without
quantification of the levels of expression (47, 49). Additional
insights into functional interactions are difficult to obtain.
In food processes such as cheese making, molecular
ap-proaches are still exploratory. Until recently, the
transcrip-tomic approach for studying mixed-culture associations
in-volved only two (25) or three microorganisms (9). Real-time
reverse transcription (RT)-PCR is the most sensitive method
for the detection and quantification of gene expression levels,
particularly for low-abundance mRNA (8, 39). However, use of
this method to study a heterogeneous microbial community
presents a scientific challenge. Lactate metabolism and amino
acid metabolism play a central role during cheese ripening.
Lactate is involved in pH variation (19), and amino acids are
precursors for cheese flavor formation (44, 48).
Yarrowia lipolytica is a ubiquitous yeast that naturally occurs
in a variety of food products. It has been isolated from dairy
products, such as cheese and yoghurt, as well as kefir and
shoyu, and from salads containing meat or shrimp (3). Previous
studies demonstrated involvement of the yeast Y. lipolytica in
the production of cheese aroma compounds (7, 10). Moreover,
the impact of Y. lipolytica in association with other ripening
yeasts was studied. The results suggested that the presence of
this organism inhibited Geotrichum candidum mycelial
expan-sion and affected Debaryomyces hansenii cell viability (31).
However, in most cases, Y. lipolytica lives with other
micro-organisms, such as lactococci and staphylococci (16, 29). It is
therefore important to be able to study the behavior of Y.
lipolytica in mixed cultures. The lactic acid bacterium (LAB)
Lactococcus lactis was shown to coexist with Y. lipolytica strains
in cheese (2). L. lactis is encountered in numerous food
fer-mentation processes, particularly cheese production (11, 24,
37, 45). Its contribution primarily consists of the formation of
* Corresponding author. Mailing address: Agro Paris Tech-INRA,
UMR 782 Ge
´nie et Microbiologie des Proce
´de
´s Alimentaires, 78850
Thiverval Grignon, France. Phone: 33 (0)1 30 81 53 88. Fax: 33 (0)1 30
81 55 97. E-mail: bonnarme@grignon.inra.fr.
† Supplemental material for this article may be found at http://aem
.asm.org/.
‡ S.M. and J.B. contributed equally to this article.
䌤Published ahead of print on 14 August 2009.
lactate from the available carbon source, which results in rapid
acidification of the food raw material. In addition, starter
cul-tures containing LAB and Staphylococcus xylosus are widely
used in the production of fermented sausages to enhance the
organoleptic properties of the products (32, 36). Moreover, S.
xylosus was found to naturally occur in many food microfloras,
such as those in cheese and sausages (30, 45).
In this study, the transcription of three cheese-ripening
mi-croorganisms in association was investigated by focusing on
glucose metabolism, lactate metabolism, and amino acid
me-tabolism. Due to the difficulty of studying a transcriptional
ecosystem in a real food environment, pure and mixed Y.
lipolytica 1E07, L. lactis LD61, and S. xylosus C2a batch
cul-tures were grown in a synthetic medium (SM). The growth
behavior of each microorganism was analyzed together with
nutritional parameters and the levels of expression of target
genes involved in important metabolism (amino acids and
lac-tate) in the cheese-ripening process. Possible microbial
inter-actions were investigated by comparison of combinations of
one-, two-, and three-species associations for each species. This
paper describes an efficient way to investigate the microbial
interactions using a transcriptional approach.
MATERIALS AND METHODS
Strains and storage conditions.The microorganisms used in this work were Y. lipolytica 1E07, S. xylosus C2a, and L. lactis LD61. Y. lipolytica 1E07 was originally isolated from Livarot cheese; it was obtained from the Laboratoire des
Micro-organismes d’Intereˆt Laitier et Alimentaire, Caen, France, and was selected
because of its biotechnological potential. S. xylosus C2a was derived from type strain DSM20267 of human skin origin and was cured of its endogenous plasmid, pSX267 (13). L. lactis subsp. lactis biovar diacetylactis LD61 was provided by
Soredab (Bongrain, La Boissie`re-Ecole, France). This strain contains plasmids
that allow optimal growth in milk (41). Strains were stored in 5% glycerol-nonfat
dry milk at⫺80°C until they were used.
Culture conditions.The microorganisms were cultivated in 500-ml flasks con-taining 100 ml of medium. A preculture of each microorganism was grown in a 100-ml flask containing 20 ml of potato dextrose broth (Difco Laboratories, Detroit, MI) for the yeast, brain heart infusion broth (Biokar Diagnostc, Beau-vais, France) for S. xylosus C2a, and M17 (Biokar Diagnostc, BeauBeau-vais, France)
for L. lactis LD61. These media were inoculated with 200l of a strain stock
suspension and incubated for 48 h at 25°C with agitation (100 rpm) for Y. lipolytica 1E07 and S. xylosus C2a. The anaerobic bacterium L. lactis LD61 was cultivated at 30°C without agitation. The precultures served as inocula for the cultures. A defined SM, adapted from the medium described by Otto et al. (34), was used for all culture conditions since it contains the substrates that allowed us to study glucose and amino acid metabolism. It essentially contained 48 compo-nents, including glucose as the main carbon source, 19 free amino acids, 14 vitamins, five metallic ions, and four nucleic acid bases (see the supplemental material). The pH of the culture media was adjusted to 6.7. Cultures were incubated at 30°C (100 rpm) for either 14 h or 24 h.
Microbial and substrate analyses.Viable cell counts, expressed in CFU ml⫺1, were determined using a standard aerobic plate count procedure. Different media were used for the three microorganisms, as follows: yeast extract glucose chloram-phenicol agar (Biokar Diagnostics, Paris, France) for Y. lipolytica, brain heart infu-sion agar supplemented with 50 mg/liter amphotericin (Biokar Diagnostics, Beau-vais, France) for S. xylosus, and M17 agar supplemented with 50 mg/liter amphotericin (Biokar Diagnostics, Beauvais, France) for L. lactis. Colonies were enumerated after incubation for 2 days at 25°C or at 30°C for the LAB.
Amino acid production was analyzed using the ninhydrin method, as previ-ously described by Grunau and Swiader (14).
Glucose and lactate were quantified by performing high-performance liquid chromatography (Waters TCM; Waters, Saint Quentin en Yvelines, France) with a cation-exchange column (diameter, 7.8 mm; length, 300 mm; Aminex HPX-87H; Bio-Rad, Ivry-sur-Seine, France) and a thermostat set at 35°C. The culture supernatants were filtered using a polyethersulfone membrane filter (pore size,
0.22m; diameter, 25 mm). The mobile phase was sulfuric acid (0.01 N) at a flow
rate of 0.6 ml · min⫺1. Detection of compounds of interest was performed with
a Waters 486 tunable UV/visible detector regulated at 210 nm. All compounds were quantified using calibration curves established with pure chemicals.
Genomic DNA extraction.Yeast or bacterial cultures (5 ml) were centrifuged
for 5 min at 5,000⫻ g, washed with 1 ml of distilled water, and then harvested
again by centrifugation for 5 min at 5,000⫻ g. Fifty-five microliters of TES (50
mM Tris, 0.1 mol liter⫺1EDTA, 6.7% sucrose; pH 8) was added to each pellet
along with 75l of a lysozyme (3 mg)-lyticase (20 l of a 5,000-U/ml solution)
mixture. The mixture was incubated for 60 min at 37°C. Forty microliters of
proteinase K (14 mg ml⫺1) and 100l of a sodium dodecyl sulfate solution
(20%) were added and incubated for 30 min at 65°C. The solution was mixed every 30 min and then poured into 2-ml tubes containing 200 mg zirconium beads (diameters, 0.1 and 0.5 mm; BioSpec Products, Bartlesville, OK) for better efficiency. The tubes were vigorously shaken in a bead beater (Fast-Prep-24; MP
Biomedicals, France) by using three 45-s mixing sequences at a speed of 6 m s⫺1.
They were cooled on ice for 5 min before each mixing sequence. After
centrif-ugation for 45 min at 12,000⫻ g and 4°C, the supernatant was collected. It was
transferred to a 2-ml tube (Eppendorf, Hamburg, Germany), and 500l of
phenol-chloroform-isoamyl alcohol (25:24:1, vol/vol/vol; pH 8) was added. The
tubes were gently mixed by inversion and then centrifuged for 15 min at 12,000⫻
g and 4°C. The aqueous phase was treated with RNase A (20 mg/ml; SERVA Electrophoresis GmbH, Heidelberg, Germany) and was transferred to two tubes (Eppendorf, Hamburg, Germany). A volume of sodium acetate 3 M correspond-ing to 1/10 of the final volume and 2 volumes of cool pure ethanol were added.
The tubes were then incubated overnight at⫺20°C. The DNA was recovered by
centrifugation for 15 min at 12,000⫻ g and 4°C, and the pellet was subsequently
washed three times with 2 ml of 80% (vol/vol) ethanol. The pellet was then dried
for 15 min in an incubator at 42°C and dissolved in 100l of Tris-EDTA.
Extraction and purification of total RNA.Cultures were centrifuged for 5 min
at 8,200⫻ g and 4°C. Each pellet was resuspended in 1.25 ml of Trizol reagent
(Invitrogen, Cergy Pontoise, France), and the suspension was poured into 2-ml tubes containing 800 mg zirconium beads (diameters, 0.1 and 0.5 mm; BioSpec Products, Bartlesville, OK). The tubes were vigorously shaken in a bead beater (Fast-Prep-24; MP Biomedicals, France) by using three 60-s mixing sequences at
a speed of 6.5 m s⫺1. They were cooled on ice for 5 min before each mixing
sequence. After centrifugation for 10 min at 12,000⫻ g and 4°C, the supernatant
was collected. It was transferred to a 2-ml tube (Phase Lock Gel Heavy;
Eppen-dorf, Hamburg, Germany), and 230l of chloroform was added. The tubes were
gently mixed by inversion and centrifuged for 15 min at 12,000⫻ g and 4°C. The
aqueous phase was transferred to a fresh tube, and an equal volume of phenol-chloroform-isoamyl alcohol (pH 4.7) (Sigma) was added. The tubes were gently
mixed by inversion and centrifuged for 10 min at 12,000⫻ g and 4°C. The upper
phase was collected. An equal volume of 100% ethanol was added to the aqueous phase, after which purification with an RNeasy kit (Qiagen, Courtaboeuf, France) was performed according to the manufacturer’s instructions. RNA sam-ples were treated with DNase using a DNase Turbo DNA-free kit (Ambion, Austin, TX). RNA quality and quantity were analyzed using a NanoDrop ND-1000 spectrophotometer (NanoDrop Technologies, Wilmington, DE) and an Agilent 2100 bioanalyzer (Agilent, Palo Alto, CA).
Real-time RT-PCR analyses.The RNA extraction and purification procedures used are described above. In order to study the gene expression of the micro-organisms, samples were taken after 14 h of culture. cDNAs were subsequently synthesized using the SuperScript III First-Strand synthesis system (Invitrogen).
A mixture containing up to 5g of total RNA, random, and deoxynucleoside
triphosphate (10 mM) primers was prepared, incubated at 65°C for 5 min, and then placed on ice for at least 1 min. A cDNA synthesis mixture containing 10⫻
RT buffer, MgCl2(25 mM), dithiothreitol (0.1 M), RNaseOUT (40 Ul⫺1), and
SuperScript III reverse transcriptase (200 Ul⫺1) was added to each
RNA-primer mixture and then incubated for 50 min at 50°C. The reaction was stopped by incubation for 5 min at 85°C.
The primers for real-time RT-PCR were designed so that they were about 20
to 25 bases long and had G⫹C contents of over 50% and melting temperatures
of about 60°C. The lengths of the PCR products ranged from 90 to 150 bp. LightCycler software (Roche, Mannheim, Germany) was used to select primer sequences. All of the primers were synthesized by Eurogentec (Seraing, Belgium) (Tables 1, 2, and 3).
SYBR green I PCR amplification was performed using a LightCycler (Roche).
Amplification was carried out using a 10-l (final volume) mixture containing
250 ng of an RNA sample, 4 mM MgCl2, 0.5M primer, and 1 l of
LightCycler-FastStart DNA Master SYBR green I (Roche). Five dilutions of cDNA were made to determine the efficiencies of real-time RT-PCR. A negative control without cDNA was systematically included. The amplification procedure in-volved incubation at 95°C for 8 min for initial denaturation, followed by 40 cycles consisting of (i) denaturation at 95°C for 10 s, (ii) annealing at a temperature that
was 5°C below the melting temperature of the primers for 7 s, (iii) extension at 72°C for 6 s, and (iv) fluorescence acquisition (530 nm) at the end of extension. The temperature transition rate was 20°C/s for each step. After real-time RT-PCR, a melting curve analysis was performed by continuously measuring fluo-rescence during heating from 65 to 95°C at a rate of 0.1°C/s. The cycle threshold
(CT) values were determined with the LightCycler software (version 3.3), using
the second derivative method. Standard curves were generated by plotting the CT
values as a function of the log of the initial RNA concentration. PCR efficiency
(E) was then calculated using the following formula: E⫽ 10⫺1/slope. A suitable
internal control gene to normalize the results was used for each microorganism. The actin gene (6) was used for Y. lipolytica, the purine M gene was used for L. lactis, and the gyrase A (46) gene was used for S. xylosus. The Pffafl method (38) was used to calculate the change in transcript abundance normalized to the control gene and relative to a pure culture sample. A statistical analysis was
performed using Student’s t test. A P value of⬍0.05 was considered significant.
(i) Housekeeping gene.Appropriate normalization strategies are required to control the experimental error introduced during the multistage process required to extract and process RNA. An appropriate housekeeping gene was therefore chosen for each microorganism. An important aspect of the validation procedure is to ensure that the gene chosen for normalization of the RNA expression level is truly invariant under the different sample conditions (data not shown). The actin gene was chosen for Y. lipolytica (6), the purine M gene was chosen for L. lactis, and the gyrase A gene was chosen for S. xylosus (46).
(ii) Confirmation of primer specificity.Real-time RT-PCR experiments were performed in order to confirm the absence of cross-hybridization between a specific microorganism primer and the other associated microorganisms. All of the primers were tested with DNA samples from the two other microorganisms. In these conditions, no nonspecific hybridization was found. In addition, a
Light-Cycler melting curve analysis was performed by continuously measuring the fluorescence during heating from 65°C to 95°C at a rate of 0.1°C/s. No primer dimers were generated during the 40 real-time RT-PCR amplification cycles that were performed.
(iii) Method of quantification.The⌬⌬CTmethod uses a single sample,
re-ferred to as the calibrator sample, for comparison of every sample’s gene ex-pression level. The calibrator sample is analyzed in every assay with the samples of interest. In this study, the calibrator samples were the pure cultures of the
microorganisms, and the unknown samples were the mixed cultures. The CT
value corresponds to the time (expressed in the number of cycles) at which the reporter fluorescent emission increases beyond a threshold level (based on the background fluorescence of the system). The following formula is used: induction
(fold)⫽ 2⫺⌬⌬CT, where⌬⌬C
T⫽ (CTfor the gene of interest in the mixed
culture⫺ CTfor the housekeeping gene in the mixed culture)⫺ (CTfor the gene
of interest in the pure culture⫺ CTfor the housekeeping gene in the pure
culture). The expression in the pure culture thus represents 1⫻ expression of the gene of interest. The major problem in a study of a microbial coculture is that the concentration of each microorganism may vary depending on the association. Consequently, the proportion of the RNA of each microorganism may also fluctuate. The normalization method that we used in the present study has the advantage of circumventing this problem.
RESULTS
For simplicity, the following abbreviations were used for the
cultures: Y, Y. lipolytica 1E07 pure culture; S, S. xylosus C2a
pure culture; L, L. lactis LD61 pure culture; YL, Y. lipolytica
TABLE 1. Primers used for the transcriptomic study of Y. lipolytica 1E07 genes
Primer Accession no. Sequence (5⬘–3⬘) Putative functionb
GAP1-R
YALI0B16522g
CGACCACAGCAATGACTTTAATA
Amino acid transporter
GAP1-F
AACTACTGGAATGAAGCTAACG
ARO8-R
YALI0E20977g
GGCTCCGACCCAGTTGT
Aromatic amino acid aminotransferase
ARO8-F
TTCTCCTCCGCCATCGAGTG
BAT1-R
YALI0D01265g
GTTGGCTCCCAGCTTCTTGT
Branched-chain amino acid aminotransferase
BAT1-F
CTCTCGGCGTCGGAACC
BAT2-R
YALI0F19910g
TCCAACGGCCTTGGAGTTCT
Branched-chain amino acid aminotransferase
BAT2-F
CCTCAAGCTCTACTGCTCCGA
JEN1-R
YALI0D20108g
TTAATGTGAGCGTCACAGATATCAC
Organic acid transporter
JEN1-F
AGCTCCAGCACAATAAATAGAACAC
GHD2-R
YALI0E09603g
CTTGAGGAGCAAATCAATGACC
Glutamate dehydrogenase
GDH2-F
TCCATGTTCGACGAGAACTAC
GHD3-R
YALI0F17820g
CTTAGAGTCGGACATGGAGACAAC
Glutamate dehydrogenase
GDH3-F
TACGTTGAGAAGATGATTGAGTACG
GND1-R
YALI0B15598g
GATGTCCTGGAAAATCTTCTTAATG
Pentose pathway
GND1-F
GATATCATCATTGACGGTGGTAACT
PGI1-R
YALI0F07711g
GGTTCTCTGTGAAGTTGATCTTGTC
Glycolysis
PGI1-F
CTTTGATGACTCCAAGATTCTGTTT
PYC1-R
YALI0C24101g
CAGAGATAACCATCTCCATCTTCAT
Pyruvate carboxylase
PYC1-F
GAAAGATTTCTGTTGAGGACAAGAA
CHA1-R
YALI0B16214g
TTTCCTCCAGAAGAAGAAAAGAAGT
L-Serine/
L-threonine deaminase
CHA1-F
TGCTTCTCAAATACGAAACTACACA
HXT2-R
YALI0F19184g
ATAGAAAAAGTAGTTGGCACCACAG
High-affinity hexose transporter
HXT2-F
GAACTCAAGGCTATTGAGAACTCTG
DLD1-R
YALI0E03212g
AAACGTATTCCTCACCGATAG
Lactate oxidoreductase
DLD1-F
TGGCCCTTAAGAAGGAAGAT
KAD-R
YALI0D08690g
CTACTACTCGGTAAGTAGGCATGGA
2-Oxoisovalerate dehydrogenase
KAD-F
AAAACATGTCCATAAGACCCAGTT
PDA1-R
YALI0F20702g
TAGATATCCTCAAACAGAACCTTGG
Pyruvate dehydrogenase
PDA1-F
AACGATCCTATTTCTGGTCTCAAG
PDB1-R
YALI0E27005g
AGTCTTCTTGATGGAGTTGAAAATG
Pyruvate dehydrogenase
PDB1-F
TAAGGATATCACTCTTGTCGGTCAC
CYB2-R
YALI0E21307g
TGCATCCACTGAGTCTGTTT
LDH
CYB2-F
TACATCACCGCTACAGCTCTA
Act21r
YALI0D08272g
aGGCCAGCCATATCGAGTCGCA
Gene encoding actin
Act20
TCCAGGCCGTCCTCTCCC
aData from reference 6.
1E07-L. lactis LD61 coculture; YS, Y. lipolytica 1E07-S. xylosus
C2a coculture; LS, L. lactis LD61-S. xylosus C2a coculture; and
YLS, Y. lipolytica 1E07-L. lactis LD61-S. xylosus C2a coculture.
Growth properties of the microorganisms.
The growth
char-acteristics of the microorganisms as a function of the
associa-tion are shown in Fig. 1. There was good reproducibility (a
difference of less than 0.5 log
10unit) between the results of
duplicate experiments.
Up to 8 h of culture, the cell counts of Y. lipolytica 1E07 were
similar in Y, YL, YS, and YLS cultures (Fig. 1A). Between 8 h
and 22 h, the presence of L. lactis LD61 in the YL culture
slightly decreased the growth of Y. lipolytica 1E07. In the YS
and YLS cultures, Y. lipolytica 1E07 cells did not grow to the
same high density that they grew to in the Y and YL cultures,
and the concentration reached 10
6CFU ml
⫺1at 22 h. At 29 h,
the concentration of Y. lipolytica 1E07 was 100-fold lower in
the YS culture than in the Y culture.
Up to 8 h in the YLS culture, the presence of L. lactis LD61
or Y. lipolytica 1E07 had no impact on the growth of S. xylosus
C2a (Fig. 1B). From 8 to 15 h, S. xylosus C2a growth reached
the stationary phase in the S culture (10
9CFU ml
⫺1) and in the
YS culture (10
9CFU ml
⫺1). In addition, in the LS and YLS
cultures, the S. xylosus C2a cell counts steadily decreased, and
the concentration reached 10
8CFU ml
⫺1at 15 h. At 20 h, the
cell counts of S. xylosus C2a in the YLS culture were
10,000-fold lower than those in the S culture. The growth of L. lactis
LD61 was similar regardless of the culture (Fig. 1C).
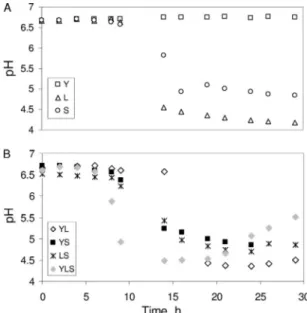
pH, glucose, lactate, and amino acid dynamics.
Changes in
pH are shown in Fig. 2. The results showed that at 29 h, the pH
dropped to 4.2 and 5 in the L and S cultures, respectively (Fig.
2A). Furthermore, the pH decreased in the YL, YS, LS, and
YLS cultures (Fig. 2B). The acidification was highly correlated
with the lactate production from glucose by S. xylosus C2a and
L. lactis LD61 (data not shown).
The glucose and lactate concentrations in the supernatants
of the microorganism cultures at 14 h are shown in Fig. 3. After
14 h of incubation, 4 g liter
⫺1of glucose had been consumed by
Y. lipolytica 1E07. In pure cultures, L. lactis LD61 and S.
xylosus C2a consumed 7 g liter
⫺1and 5 g liter
⫺1of glucose,
respectively, and produced 5 g liter
⫺1and 2 g liter
⫺1of lactate,
TABLE 2. Primers used for the transcriptomic study of S. xylosus C2a genes
Primer Sequence (5⬘–3⬘) Putative function
ILVE-R
CCG AAA GTT GAT GAA GAG ACA GTA T
Glucose-6-phosphate isomerase
ILVE-F
AAT AAG AAG GAC GTA CGC CTA GAA T
GyrA-R
TAC AAT GTT ACC GTT ACG CTC AGT A
Branched-chain amino acid aminotransferase
GyrA-F
ATG TTA CAA ATG CTG AAA GTG ATG A
LDH-R
TCT TCA ATT CTG TGT TGT CTT TCA G
Putative 1-phosphofructokinase
LDH-F
ATT AGC AGA AGA ATT TGG TGT TTC A
pgiA-R
ACG ACA AAT GTT TCA TAA CCT TCA T
NADH oxidase
pgiA-F
AAA TCA GGT ACT ACG ACT GAA CCA G
PDHA-R
TCA ACA ACT GTT TGT TTT TCA GTG T
Pyruvate oxidase
PDHA-F
GAA AAA GGA TCC ATT AGT ACG CTT T
PDHB-R
CTA GAG CTA AAC CAC CAA TAC CAG A
Mannose-specific phosphotransferase system
PDHB-F
AAA CCG AAT TAC AAA ATG ATG AAA A
component IID
Lac-permease-R
CCA TCT GTC CAT TCT TCT TTA GGT A
Lactate permease
Lac-permease-F
GCT AGC GCT AAT TGG TAT TGT GTA T
Glucose transporter-R
GTA CAA AGG CTG CAA TAA CGA TAA G
Glucose transporter
Glucose transporter-F
CAA AAG TTG GTG TAG CGA CTA GTT T
AA transporter-R
ATC GCT TTT ACT TTA GCG TTA GGT T
Amino acid transporter
AA transporter-F
TAG CAA AAT CTA AAG GTG CAG AAC T
GyrA-R
TAC AAT GTT ACC GTT ACG CTC AGTA
DNA gyrase subunit A
GyrA-F
ATG TTA CAA ATG CTG AAA GTG ATG A
TABLE 3. Primers used for the transcriptomic study of L. lactis LD61 genes
Primer Accession no. Sequence (5⬘–3⬘) Putative function
pgiA-R
L0012
TCT TTA CCT TGC AAG TAT CCA AGT C
Glucose-6-phosphate isomerase
pgiA-F
TTC AGC TAA CTT CTC AAC AGA CCT T
BcaT-R
L0086
GTT TGC TTT CAC CA TTG TTT AAC T
Branched-chain amino acid aminotransferase
BcaT-F
ATT AAA AGC CTA TCG AAC AAA GGA T
LacC-R
L0032
CAA AGA TTG CTT CTA GTT CTT CTC G
Putative 1-phosphofructokinase
LacC-F
GTG AAG ATT TCT ATG AGC GTT TGA T
noxE-R
L196579
ATT TCC TGC AAT TAT TTC ACT CTT G
NADH oxidase
noxE-F
AAT CGG CCT AGA AGT TTC ATT TAG T
poxL-R
L0199
GAT GCC AAA CTG ACA ATT AAG AAA T
Pyruvate oxidase
poxL-F
GAT GCC AAA CTG ACA ATT AAG AAA T
ptnD-R
L147466
CTG GTT TAC AGT ACG TCC TAT CGT T
Mannose-specific phosphotransferase system
ptnD-F
CTT TAG TGA TTG CAG AAC CTG ATT T
component IID
purM-R
L165202
aGCC ACT CCA GCC ACA ACT TG
Phosphoribosyl-aminoimidazole synthetase
purM-F
GAT TGC GTA GCC ATG TGC GTC
a
respectively. Glucose was totally exhausted after 14 h in the YL
and YLS cultures, and 4 g liter
⫺1and 5 g liter
⫺1of lactate were
produced, respectively.
Only 4 g liter
⫺1of glucose was consumed in the YS culture,
with production of 2.5 g liter
⫺1of lactate. High levels of amino
acids were consumed in the YS and YLS cultures, and there
was greater consumption in the YS culture (threonine, alanine,
glutamine, glycine, and lysine were the main amino acids
con-sumed) (data not shown).
Real-time RT-PCR analysis of the different microorganism
associations.
In order to better understand possible
interac-tions between microorganisms, real-time RT-PCR analyses
were carried out by focusing on glucose metabolism, lactate
metabolism, and amino acid metabolism, which are the main
energy sources in the SM. Total RNA was extracted after 14 h
of incubation. The time of extraction was chosen so that there
were enough cells (the minimum number required is about 10
6cells) and so that the culture was at the end of the exponential
phase. Real-time RT-PCR analyses were then performed with
primers specific for target genes involved in glucose, amino
acid, and lactate catabolism.
Levels of expression of the gene transcripts investigated in
the different cultures.
The levels of expression of several genes
involved in glucose, lactate, and amino acid metabolism were
investigated. Seventeen genes were chosen to study the
possi-ble effect of S. xylosus C2a and/or L. lactis LD61 on Y. lipolytica
1E07. Real-time RT-PCR was then performed with primers
specific for eight genes involved in amino acid catabolism, six
genes involved in lactate catabolism, and three genes involved
in glucose catabolism (Table 1).
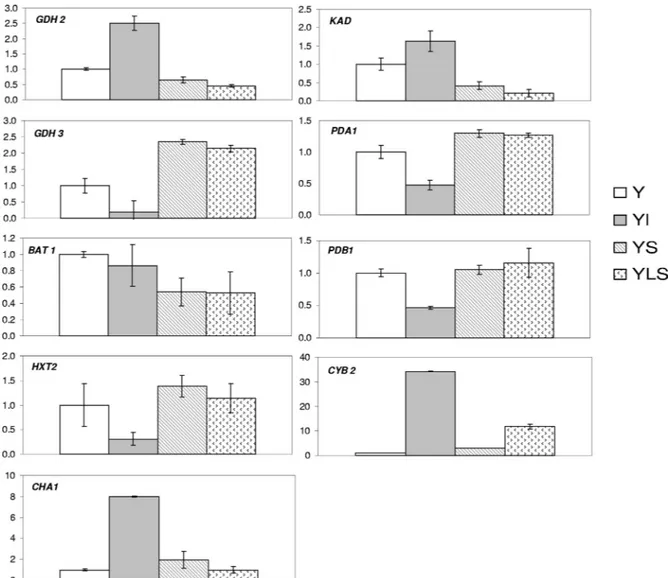
Nine genes of Y. lipolytica whose expression levels
signif-icantly differed in the pure and cocultures are shown in Fig.
4. The level of expression of the HXT2 gene involved in
glucose catabolism was lower in the pure culture was than in
the YL culture, probably due to the total consumption of
glucose by L. lactis LD61 at 14 h, which corresponded to the
time of RNA extraction. In addition, the levels of expression
of the lactate dehydrogenase (LDH) CYB2 gene were higher
in all the cultures in which some lactate was produced than
in the Y culture, in which lactate was not produced. The
levels of expression of the CYB2 gene were 35, 2.5, and 5
times higher in the YL, YS, and YLS cultures, respectively,
than in the pure culture. Moreover, the levels of expression
of several genes related to amino acid catabolism, such as
BAT1, KAD, and GDH2, were lower in the presence of S.
FIG. 1. Growth of Y. lipolytica 1E07 (A), S. xylosus C2a (B), and L.
lactis LD61 (C) in SM.
FIG. 2. pH variation for microorganisms in pure cultures (A) and
in mixed cultures (B).
FIG. 3. Glucose and lactate concentrations in the supernatants of
microorganism cultures after 14 h of incubation in SM. B, blank.
xylosus C2a. Additionally, the induction of the anabolic
GDH3 gene encoding the NADP
⫹-dependent glutamate
de-hydrogenase was opposite the induction of the catabolic
GDH2 gene encoding an NAD
⫹-dependent glutamate
de-hydrogenase. Also, the genes encoding two subunits of the
pyruvate dehydrogenase, PDA1 and PDB1, were induced
similarly.
In order to study the effect of S. xylosus C2a and/or Y.
lipolytica 1E07 on the gene expression of L. lactis LD61, six
genes of L. lactis LD61 were selected; one of these genes
is involved in amino acid catabolism, three of these genes are
involved in lactate catabolism, and two of these genes are
involved in the glucose pathway (Table 3). The levels of
ex-pression of four genes were significantly different in coculture
and in the L culture (Fig. 5). For instance, the levels of
expres-sion of the noxE and poxL genes involved in the oxidative
catabolism of glucose or lactate were higher in the YL culture
than in the L culture. Moreover, the level of expression of the
ldh gene was decreased in the YL culture, whereas it was
increased in the YLS culture. At 14 h, glucose was not
com-pletely exhausted, which could explain the higher level of
ex-pression of the pgiA gene involved in glucose catabolism in the
L culture than in the YL and YLS cultures.
The effect of Y. lipolytica 1E07 and/or L. lactis LD61 on S.
xylosus C2a was also investigated. To do this, six genes were
selected; one of these genes is involved in amino acid
ca-tabolism, three of these genes are involved in lactate
catab-olism, and two of these genes are involved in the glucose
pathway (Table 2). The results for four genes of S. xylosus
C2a whose levels of expression significantly differed in the
pure and mixed cultures are shown in Fig. 6. These results
show that the level of expression of the LDH gene (ldh)
decreased in the YS and YLS cultures compared to the S
culture. Furthermore, the level of expression of the gene
encoding pyruvate dehydrogenase, which is involved in the
catabolism of glucose, was higher in the YS culture, whereas
the expression of this gene decreased in the YLS culture.
The level of expression of the gene involved in amino acid
transport significantly decreased regardless of the microbial
association (Fig. 6).
FIG. 4. Levels of expression of the GDH2, GDH3, BAT1, HXT2, CHA1, KAD, PDA1, PDB1, and CYB2-2 genes, measured by real-time
RT-PCR. The levels of expression of genes in a Y culture were compared to those in cocultures after 14 h of incubation in SM.
DISCUSSION
In this study, the interactions of three microorganisms and
the effects on the levels of expression of genes involved in
glucose catabolism, lactate catabolism, and amino acid
catab-olism were investigated using an SM. To our knowledge, little
is known about gene expression in microorganisms in
cocul-tures. Most mixed-culture studies have been limited to a
bio-chemical approach using two (27, 28) or, rarely, more
micro-organisms (1, 31). Recently, transcriptomic approaches have
been developed to investigate possible interactions between
two or three microorganisms (9, 17, 25), indicating that such
alternative approaches could be used to investigate coculture
behavior.
Efficiency of the quantification method.
The method used to
generate quantitative values must be taken into account when
gene expression data are interpreted. Previous studies have
demonstrated the linearity of real-time RT-PCR and described
the use of standard curves for relative quantification of target
genes. The relative expression of a given gene can be obtained
by the
⌬⌬C
Tmethod (38). The housekeeping gene chosen for
each microorganism is used to normalize the level of
expres-sion of each gene. The expresexpres-sion of the housekeeping gene
has to be truly invariant under the different sample conditions
used (40). This normalization makes it possible to avoid the
problem of cell concentration in different association samples.
Effect of L. lactis LD61 and/or S. xylosus C2a interactions on
Y. lipolytica 1E07.
The presence of both bacteria considerably
reduced the growth of Y. lipolytica 1E07. The presence of S.
xylosus C2a resulted in a 100-fold decrease in the Y. lipolytica
1E07 cell count compared to the pure culture. Competition for
amino acids between Y. lipolytica 1E07 and S. xylosus C2a may
explain this phenomenon. In fact, the amino acids were
dra-matically consumed in the YS culture. As a result of the low
amino acid concentration in the medium, the expression of
genes involved in amino acid catabolism (GDH2, BAT1, and
KAD) was downregulated in the presence of S. xylosus C2a,
regardless of the type of association (YS and YLS cultures). In
addition, the expression of the GDH3 (anabolic) and GDH2
(catabolic) genes coding for an NADP
⫹-dependent glutamate
dehydrogenase and an NAD
⫹-dependent glutamate
dehydro-genase, respectively, was induced in the opposite way. DeLuna
et al. (12) indicated that the coordinated regulation of the
GDH3- and GDH2-encoded enzymes resulted in glutamate
biosynthesis and balanced utilization of
␣-ketoglutarate under
respiratory conditions in the yeast Saccharomyces cerevisiae.
The increase in the levels of expression of Y. lipolytica 1E07
genes involved in amino acid catabolism strongly suggests that
amino acids are preferentially consumed by this yeast. A recent
study of Y. lipolytica demonstrated the involvement of this
yeast in amino acid degradation (26). It showed that the amino
acids are used by Y. lipolytica 1E07 primarily as a main energy
source and that lactate is consumed following amino acid
de-pletion. Cholet et al. (10) investigated the patterns of
expres-sion of target genes related to
L-methionine catabolism and
FIG. 5. Levels of expression of the poxL, noxE, ldh, and pgiA genes,
measured by real-time RT-PCR. The levels of expression of genes in
an L culture were compared to those in cocultures after 14 h of
incubation in SM.
FIG. 6. Levels of expression of the ldh, pdhA, pgiA, and aat genes,
measured by real-time RT-PCR. The levels of expression of genes in
an S culture were compared to those in cocultures after 14 h of
incubation in SM.
lactate catabolism in this yeast. They found that Y. lipolytica
was involved mainly in
L-methionine catabolism.
In YL or YLS cultures, lactate produced by L. lactis LD61
from glucose led to a 30-fold increase in the level of expression
of the CYB2 LDH gene compared to the expression in a Y.
lipolytica 1E07 pure culture in which no lactate was produced.
Our results are in good agreement with those of Lodi and
Guiard (21), who found that in S. cerevisiae the CYB2 gene was
subject to several metabolic controls at the transcription level,
including inhibition due to glucose fermentation and induction
by lactate. At the same time, the level of expression of the
glucose transporter-encoding gene HXT2 was decreased
two-fold. In fact, after 14 h of culture, the glucose was totally
consumed by L. lactis LD61 and partially converted to lactate,
which accumulated in the medium. A 50-fold decrease in the
expression of the HXT2 gene in glucose-depleted media was
also reported by Higgins et al. (15). In contrast, Ozcan and
Johnston (35) showed that the transcription of the HXT2 genes
of the yeast S. cerevisiae is repressed when glucose levels are
high and is induced after glucose is depleted. There are several
potential reasons for these discrepancies, including the type of
culture, strain differences, microorganism associations, and
culture medium composition.
Effects of Y. lipolytica 1E07 and/or S. xylosus C2a interactions
on L. lactis LD61.
We found that some genes were differentially
expressed depending on the association, despite the fact that
the growth of L. lactis LD61 was not affected by the
microor-ganisms with which it was associated.
L. lactis LD61 exhibits homofermentative sugar metabolism
with lactate as a major end product under most fermentation
conditions. The presence of oxygen results in radical changes
in the carbon metabolism of L. lactis (23). It has been shown
previously that the principal metabolic shifts observed under
aerobic conditions coincided with the induction of NADH
oxidase (NOX) activity (4, 23). The overproduction of this
enzyme results in a decrease in the NADH/NAD ratios. In fact,
as a result of NOX activity, the electrons originating from
sugar metabolism are used for reduction of oxygen and not for
reduction of pyruvate to lactate. Lopez de Felipe et al. (22)
demonstrated that the metabolic level of the key cofactor
NADH can change L. lactis from a homolactic bacterium to a
bacterium producing high levels of acetoin or diacetyl. Under
aerobic conditions, the NADH is used as a substrate by the
LDH. As a consequence, when NOX is highly expressed, the
LDH activity is low and lactate production is further
de-creased, which is essentially what was found with our cultures.
The pyruvate produced from the consumption of glucose
and/or lactate could be transformed into acetyl-phosphate via
the pyruvate oxidase involved in its oxidative decarboxylation.
A second pathway could be the conversion of pyruvate into
lactate via the LDH. In the YL culture, the level of expression
of ldh decreased while the level of expression of pox increased
compared to the L culture. This result shows that L. lactis
LD61 produces mainly acetyl-phosphate from pyruvate in the
presence of Y. lipolytica 1E07.
Opposite regulation of the poxL, noxE, and ldh genes was
observed in the YLS culture. This result may suggest that in the
presence of S. xylosus, the NADH/NAD ratios are important
for the reduction of pyruvate to lactate.
The level of expression of the pgiA gene encoding a
glucose-6-phosphate isomerase was lower in the YL and YLS cultures
than in the L culture due to total consumption of glucose. In
fact, this enzyme is highly regulated, and its activity is
corre-lated with substrate abundance (5).
Effects of L. lactis LD61 and/or Y. lipolytica 1E07 interactions
on S. xylosus C2a.
Y. lipolytica 1E07 and/or L. lactis LD61
associated with S. xylosus C2a considerably affected the growth
of the latter bacterium. Two main reasons could be responsible
for the decrease in the growth of S. xylosus C2a in coculture.
The first reason is the acidification of the medium due to
lactate production by the LAB and S. xylosus C2a. The effect of
pH on the growth of S. xylosus has been studied previously. The
results showed that lowering the pH from 6.0 to 4.6 decreased
the growth of S. xylosus (42, 43). The second reason is that
competition for amino acids may occur in the presence of Y.
lipolytica 1E07, which is known to preferentially consume
amino acids at the expense of lactate (26). Lincoln et al. (20)
found that seven Staphylococcus aureus strains required
argi-nine, proline, cysteine, valine, leucine, and glycine for growth.
The same results were obtained by Onoue and Mori (33) using
a chemically defined medium. Keller et al. (18) observed that
S. aureus could utilize glutamate, proline, histidine, aspartate,
alanine, threonine, serine, or glycine as a major energy source.
The combination of acidification and amino acid competition
could explain the dramatic decrease in the size of the S. xylosus
C2a population in the YLS culture. Moreover, as a
conse-quence of the decrease in S. xylosus C2a growth, the expression
of all the genes in the mixed culture with Y. lipolytica 1E07
and/or L. lactis LD61 significantly decreased compared to the
expression of the genes in the pure culture. The same profile
was obtained with the mixed culture with Y. lipolytica 1E07,
with the exception of the level of expression of the pyruvate
dehydrogenase gene, which was slightly higher than that in the
S culture.
This study describes an efficient way to investigate microbial
interactions using a transcriptional approach. To obtain a
bet-ter understanding of the inbet-teractions that may occur, it would
be interesting to use microarray technology that would provide
an overview of the whole-cell response to environmental
changes at the transcriptional level.
ACKNOWLEDGMENTS
We thank J. Colle, V. Laroute, and R. Ta
ˆche for their technical
assistance. We also thank N. Desmasures (Laboratoire des
Micro-organismes d’Intere
ˆt Laitier et Alimentaire, Caen, France) and
Soredab (Bongrain, La Boissie
`re Ecole, France) for providing
micro-bial strains.
S.M. is grateful to the ABIES Doctoral School for awarding her a
Ph.D. scholarship. This work was supported by an ANR (French
Na-tional Research Agency) grant within the framework of the
“Geno-ferment” 2E.11 PNRA program.
REFERENCES
1. Addis, E., G. H. Fleet, J. M. Cox, D. Kolak, and T. Leung. 2001. The growth, properties and interactions of yeasts and bacteria associated with the mat-uration of Camembert and blue-veined cheeses. Int. J. Food Microbiol. 69:25–36.
2. A´lvarez-Martín, P., A. B. Flo´rez, A. Herna´ndez-Barranco, and B. Mayo. 2008. Interaction between dairy yeasts and lactic acid bacteria strains during milk fermentation. Food Control 19:62–70.
3. Barnett, J. A., R. W. Payne, and D. Yarrow. 2000. Yeasts: characteristics and identification. Cambridge University Press, Cambridge, United Kingdom. 4. Bassit, N., C.-Y. Boquien, D. Picque, and G. Corrieu. 1993. Effect of initial
lactis subsp. lactis biovar diacetylactis. Appl. Environ. Microbiol. 59:1893– 1897.
5. Bhosale, S. H., M. B. Rao, and V. V. Deshpande. 1996. Molecular and industrial aspects of glucose isomerase. Microbiol. Rev. 60:280–300. 6. Blanchin-Roland, S., G. D. Costa, and C. Gaillardin. 2005. ESCRT-I
com-ponents of the endocytic machinery are required for Rim101-dependent ambient pH regulation in the yeast Yarrowia lipolytica. Microbiology 151: 3627–3637.
7. Bonaïti, C., F. Irlinger, H. E. Spinnler, and E. Engel. 2005. An iterative sensory procedure to select odor-active associations in complex consortia of microorganisms: application to the construction of a cheese model. J. Dairy Sci. 88:1671–1684.
8. Bustin, S. A. 2000. Absolute quantification of mRNA using real-time reverse transcription polymerase chain reaction assays. J. Mol. Endocrinol. 25:169– 193.
9. Cholet, O., A. Henaut, S. Casaregola, and P. Bonnarme. 2007. Gene expres-sion and biochemical analysis of cheese-ripening yeasts: focus on catabolism
ofL-methionine, lactate, and lactose. Appl. Environ. Microbiol. 73:2561–
2570.
10. Cholet, O., A. Henaut, A. Hebert, and P. Bonnarme. 2008. Transcriptional
analysis ofL-methionine catabolism in the cheese-ripening yeast Yarrowia
lipolytica in relation to volatile sulfur compound biosynthesis. Appl. Environ. Microbiol. 74:3356–3367.
11. Corsetti, A., J. Rossi, and M. Gobbetti. 2001. Interactions between yeasts and bacteria in the smear surface-ripened cheeses. Int. J. Food Microbiol. 69:1–10.
12. DeLuna, A., A. Avendano, L. Riego, and A. Gonzalez. 2001. NADP-gluta-mate dehydrogenase isoenzymes of Saccharomyces cerevisiae. Purification, kinetic properties, and physiological roles. J. Biol. Chem. 276:43775–43783.
13. Go¨tz, F., J. Zabielski, L. Philipson, and M. Lindberg.1983. DNA homology
between the arsenate resistance plasmid pSX267 from Staphylococcus xylosus and the penicillinase plasmid pI258 from Staphylococcus aureus. Plasmid 9:126–137.
14. Grunau, J. A., and J. M. Swiader. 1992. Chromatography of 99 amino acids and other ninhydrin-reactive compounds in the Pickering lithium gradient system. J. Chromatogr. A 594:165–171.
15. Higgins, V. J., A. G. Beckhouse, A. D. Oliver, P. J. Rogers, and I. W. Dawes. 2003. Yeast genome-wide expression analysis identifies a strong ergosterol and oxidative stress response during the initial stages of an industrial lager fermentation. Appl. Environ. Microbiol. 69:4777–4787.
16. Irlinger, F., and A. Morvan. 1997. Taxonomic characterization of coagulase-negative staphylococci in ripening flora from traditional French cheese. Syst. Appl. Microbiol. 20:319–328.
17. Jakubovics, N. S., S. R. Gill, S. E. Lobst, M. M. Vickerman, and P. E. Kolenbrander.2008. Regulation of gene expression in a mixed-genus com-munity: stabilized arginine biosynthesis in Streptococcus gordonii by coaggre-gation with Actinomyces naeslundii. J. Bacteriol. 190:3646–3657.
18. Keller, G. M., R. S. Hanson, and M. S. Bergdoll. 1978. Molar growth yields and enterotoxin B production of Staphylococcus aureus S-6 with amino acids as energy sources. Infect. Immun. 20:151–157.
19. Leclercq-Perlat, M. N., F. Buono, D. Lambert, H. E. Spinnler, and G. Corrieu.2004. Controlled production of Camembert-type cheeses. Part I. Microbiological and physicochemical evolutions. J. Dairy Res. 71:346–354. 20. Lincoln, R. A., J. A. Leigh, and N. C. Jones. 1995. The amino acid
require-ments of Staphylococcus aureus isolated from cases of bovine mastitis. Vet. Microbiol. 45:275–279.
21. Lodi, T., and B. Guiard. 1991. Complex transcriptional regulation of the Sac-charomyces cerevisiae CYB2 gene encoding cytochrome b2: CYP1(HAP1) acti-vator binds to the CYB2 upstream activation site UAS1-B2. Mol. Cell. Biol. 11:3762–3772.
22. Lopez de Felipe, F., M. Kleerebezem, W. M. de Vos, and J. Hugenholtz. 1998. Cofactor engineering: a novel approach to metabolic engineering in Lacto-coccus lactis by controlled expression of NADH oxidase. J. Bacteriol. 180: 3804–3808.
23. Lopez de Felipe, F., M. J. C. Starrenburg, and J. Hugenholtz. 1997. The role of NADH-oxidation in acetoin and diacetyl production from glucose in Lactococcus lactis subsp. lactis MG1363. FEMS Microbiol. Lett. 156:15–19.
24. Lu¨cke, F.-K.2000. Utilization of microbes to process and preserve meat.
Meat Sci. 56:105–115.
25. Maligoy, M., M. Mercade, M. Cocaign-Bousquet, and P. Loubiere. 2008. Transcriptome analysis of Lactococcus lactis in coculture with Saccharomyces cerevisiae. Appl. Environ. Microbiol. 74:485–494.
26. Mansour, S., J. M. Beckerich, and P. Bonnarme. 2008. Lactate and amino acid catabolism in the cheese-ripening yeast Yarrowia lipolytica. Appl. Envi-ron. Microbiol. 74:6505–6512.
27. Masoud, W., and M. Jakobsen. 2005. The combined effects of pH, NaCl and temperature on growth of cheese ripening cultures of Debaryomyces hansenii and coryneform bacteria. Int. Dairy J. 15:69–77.
28. Masoud, W., and M. Jakobsen. 2003. Surface ripened cheeses: the effects of Debaryomyces hansenii, NaCl and pH on the intensity of pigmentation pro-duced by Brevibacterium linens and Corynebacterium flavescens. Int. Dairy J. 13:231–237.
29. Mounier, J., R. Gelsomino, S. Goerges, M. Vancanneyt, K. Vandemeulebro-ecke, B. Hoste, S. Scherer, J. Swings, G. F. Fitzgerald, and T. M. Cogan. 2005. Surface microflora of four smear-ripened cheeses. Appl. Environ. Microbiol. 71:6489–6500.
30. Mounier, J., S. Goerges, R. Gelsomino, M. Vancanneyt, K. Vandemeulebro-ecke, B. Hoste, N. M. Brennan, S. Scherer, J. Swings, G. F. Fitzgerald, and T. M. Cogan. 2006. Sources of the adventitious microflora of a smear-ripened cheese. J. Appl. Microbiol. 101:668–681.
31. Mounier, J., C. Monnet, T. Vallaeys, R. Arditi, A.-S. Sarthou, A. Helias, and F. Irlinger.2008. Microbial interactions within a cheese microbial commu-nity. Appl. Environ. Microbiol. 74:172–181.
32. Nychas, G. J., and J. S. Arkoudelos. 1990. Staphylococci: their role in fer-mented sausages. Soc. Appl. Bacteriol. Symp. Ser. 19:167S–188S. 33. Onoue, Y., and M. Mori. 1997. Amino acid requirements for the growth and
enterotoxin production by Staphylococcus aureus in chemically defined me-dia. Int. J. Food Microbiol. 36:77–82.
34. Otto, R., B. Ten Brink, H. Veldkamp, and W. N. Konings. 1983. The rela-tionship between growth rate and electrochemical proton gradient of Strep-tococcus cremoris. FEMS Microbiol. Lett. 16:69–74.
35. Ozcan, S., and M. Johnston. 1995. Three different regulatory mechanisms enable yeast hexose transporter (HXT) genes to be induced by different levels of glucose. Mol. Cell. Biol. 15:1564–1572.
36. Papamanoli, E., P. Kotzekidou, N. Tzanetakis, and E. Litopoulou-Tzanetaki. 2002. Characterization of Micrococcaceae isolated from dry fermented sau-sage. Food Microbiol. 19:441–449.
37. Patrignani, F., R. Lanciotti, J. M. Mathara, M. E. Guerzoni, and W. H. Holzapfel.2006. Potential of functional strains, isolated from traditional Maasai milk, as starters for the production of fermented milks. Int. J. Food Microbiol. 107:1–11.
38. Pfaffl, M. W. 2001. A new mathematical model for relative quantification in real-time RT-PCR. Nucleic Acids Res. 29:e45.
39. Pfaffl, M. W., and M. Hageleit. 2001. Validities of mRNA quantification using recombinant RNA and recombinant DNA external calibration curves in real-time RT-PCR. Biotechnol. Lett. 23:275–282.
40. Radonic, A., S. Thulke, I. M. Mackay, O. Landt, W. Siegert, and A. Nitsche. 2004. Guideline to reference gene selection for quantitative real-time PCR. Biochem. Biophys. Res. Commun. 313:856–862.
41. Raynaud, S., R. Perrin, M. Cocaign-Bousquet, and P. Loubiere. 2005. Met-abolic and transcriptomic adaptation of Lactococcus lactis subsp. lactis biovar diacetylactis in response to autoacidification and temperature downshift in skim milk. Appl. Environ. Microbiol. 71:8016–8023.
42. Søndergaard, A. K., and L. H. Stahnke. 2002. Growth and aroma production by Staphylococcus xylosus, S. carnosus, and S. equorum—a comparative study in model systems. Int. J. Food Microbiol. 75:99–109.
43. Sørensen, B. B., and M. Jakobsen. 1996. The combined effects of environ-mental conditions related to meat fermentation on growth and lipase pro-duction by the starter culture Staphylococcus xylosus. Food Microbiol. 13: 265–274.
44. Spinnler, H. E., C. Berger, C. Lapadatescu, and P. Bonnarme. 2001. Pro-duction of sulfur compounds by several yeasts of technological interest for cheese ripening. Int. Dairy J. 11:245–252.
45. Talon, R., I. Lebert, A. Lebert, S. Leroy, M. Garriga, T. Aymerich, E. H. Drosinos, E. Zanardi, A. Ianieri, M. J. Fraqueza, L. Patarata, and A. Laukova´.2007. Traditional dry fermented sausages produced in small-scale processing units in Mediterranean countries and Slovakia. 1. Microbial eco-systems of processing environments. Meat Sci. 77:570–579.
46. Theis, T., R. A. Skurray, and M. H. Brown. 2007. Identification of suitable internal controls to study expression of a Staphylococcus aureus multidrug resistance system by quantitative real-time PCR. J. Microbiol. Methods 70:355–362.
47. Wu, L., X. Liu, C. W. Schadt, and J. Zhou. 2006. Microarray-based analysis of subnanogram quantities of microbial community DNAs by using whole-community genome amplification. Appl. Environ. Microbiol. 72:4931–4941. 48. Yvon, M., and L. Rijnen. 2001. Cheese flavour formation by amino acid
catabolism. Int. Dairy J. 11:185–201.
49. Zhou, J. 2003. Microarrays for bacterial detection and microbial community analysis. Curr. Opin. Microbiol. 6:288–294.