HAL Id: hal-00790800
https://hal-brgm.archives-ouvertes.fr/hal-00790800
Submitted on 7 Dec 2020
HAL is a multi-disciplinary open access
archive for the deposit and dissemination of
sci-entific research documents, whether they are
pub-lished or not. The documents may come from
teaching and research institutions in France or
abroad, or from public or private research centers.
L’archive ouverte pluridisciplinaire HAL, est
destinée au dépôt et à la diffusion de documents
scientifiques de niveau recherche, publiés ou non,
émanant des établissements d’enseignement et de
recherche français ou étrangers, des laboratoires
publics ou privés.
On the effects of continents on mantle convection
Laurent Guillou-Frottier, Claude Jaupart
To cite this version:
Laurent Guillou-Frottier, Claude Jaupart.
On the effects of continents on mantle convection.
Journal of Geophysical Research, American Geophysical Union, 1995, 100, pp.24, 217-24, 238.
�10.1029/95JB02518�. �hal-00790800�
JOURNAL OF GEOPHYSICAL RESEARCH, VOL. 100, NO. B12, PAGES 24,217-24,238, DECEMBER 10, 1995
On
effec
of continents
on manle
convection
Laurent Guillou
• and Claude Jaupart
Institut de Physique du Globe de Paris, France
Abstract. At the Earth's surface,
continents
and oceans
impose
different thermal
boundary conditions
at the top of the mantle. Laboratory experiments
are used to
investigate
the consequences
of this for mantle convection.
The upper boundary
of
the experimental
tank was made of copper
plates
enforcing
a fixed temperature
and
had a conductive
lid of finite width in the middle. Beneath this lid, the thermal
boundary
condition
was of the "mixed"
type, with a Blot number
depending
on
the dimensions
and thermal conductivity
of the lid. Experimental
values of the
Blot number
were scaled
to Earth values.
Experiments
were run for a large range
of Rayleigh
numbers,
from 10
4 to 10
7 , and for several
lid widths. The effects
of
temperature-dependent
viscosity
and of the shape of the lid were investigated.
At
steady state, in all cases,
there is an upwelling
beneath the conductive
lid, which
feeds two symmetrical and elongated convective
cells. Three different dynamic
regimes
were
identified
as a function
of Rayleigh
number,
indepe•dently
of the
lid width. At Rayleigh
numbers
lower than 1.2 10
5 , the upwelling
is steady both
in geometry and temperature structure. At Rayleigh numbers
between 1.2 l0 s
and 2 10
6, this central
upwelling
is intermittent.
At larger
values
of the Rayleigh
number, there is no longer a simple upwelling
structure, but a set of small plumes
rising together and distorted by a cellular circulation
of large horizontal extent.
Thus the conductive
lid always
imposes
a large-scale
flow pattern. The length of
these convective
cells is a function of lid width. It is equal to the lid width at
large values and decreases
to the Rayleigh-B•nard
value as the lid width decreases
to zero. A fluid loop model explains the most important features of this form of
convection.
The cell length is such that the upwelling
temperature
is minimized
for
a given Rayleigh
number and lid width and is an increasing
function of lid width
and a decreasing
function of Rayleigh number. Transient experiments
demonstrate
that the large-scale
flow structure develops
rapidly with even small horizontal
temperature differences.
Implications
for the Earth are that large-scale
convection
cells exist in conditions
which, in the absence
of continents,
would probably lead
to a chaotic convection
pattern dominated
by plumes. At high Rayleigh
number,
continental
breakup is effected
by a large-scale
line upwelling
structure which
includes a number of individual plumes.
Introduction
The theory of plate tectonics has been very successful in accounting for the velocity field at the Earth's sur-
face and in explaining large-scale geological phenomena
such as subduction and continental collision. Together with simple cooling models, it has enabled us to calcu-
late with good accuracy heat flow, depth, and gravity
anomalies in the oceans. Thus studies of mantle con-
vection have naturally focused on observations in the
oceans [e.g., McKenzie el al., 1974; Ozburgh and Tur-
1 Now at Cleotop, Universit• du Quebec • Montreal, Canada.
Copyright 1995 by the American Geophysical Union.
Paper number 95JB02518.
0148-0227/95/95 JB-02518505.00
cotte, 1978; Jarvis and Peltier, 1982; Olson el al., 1990;
Davies and Richards, 1992]. In such studies, continents
have been treated as aged oceanic lithosphere which follow passively plate motions. This simple view, how-
ever, is not tenable. One reason is that continents are
associated with specific convection phenomena. For ex-
ample, their breakup is associated with strong mantle
upwellings and anomalously high mantle temperatures
[White and McKenzie, 1989]. Another reason is that the mantle temperature field exhibits large-wavelength
components which are clearly linked to the distribu-
tion of continents and oceans at the Earth's surface [Tanimoto, 1990; Woodward and Masters, 1991; $u and Dziewonski, 1991; Montagner, 1994]. Oceans .and con-
tinents are associated with seismic velocity "'differences
extending to depths of at least 300 km [Jordan, 1981; Grand, 1987; Anderson el al., 1992; Montagn. er, 1994].
24,218 GUILLOU AND JAUPART: CONTINENTS AND MANTLE CONVECTION
Large-wavelength geoid anomalies are related to the
past and present
distribution
of continents
[Anderson,
1982; Chase
and Sprowl,
1983;
œe
Pichon
and IIuchon,
1984]. Such large-scale structures are difficult to ex-
plain within the flamework
of Rayleigh-Bdnard
convec-
tion, that is, with a homogeneous fluid layer cooled uni- formly from above. A strong constraint is that the heat
flow
field at the Earth's
surface
is determined
to a large
extent by the distribution of continents and oceans. Re- cent studies have demonstrated that the mantle heat flow beneath old continents cannot exceed a value of15 mW m -2 and is probably
as small as 12 mW m -2
[Pinet et al., 1991; Guillou
et al., 1994]. This is much
lower than the average oceanic heat flow of 100 mWm -2 [$clater
e! al., 1980;
Stein
and
Stein,
1994].
Thus
continents are a fundamental component of the Earth's
heat budget. In terms of basic
physics,
they impose
a
heterogeneous
thermal condition
at the upper bound-
ary of the convecting mantle, which is known to affect
the characteristics
of flow [Kelly and Pal, 1978].
There have been few studies of the effects of conti-nents on mantle convection.
Gurnis [1988] and Zhon#
and Gurnis [1993] have considered a "raft" of fixed
thickness
which is allowed
to move at the upper sur-
face of a convecting
layer. They were able to reproduce
the Wilson
cycle
of continental
aggregation
and breakup
and showed that large-scale temperature anomalies are generated. œowman and Jarvis [1993] carried out a sim- ilar study in a rectangular box. They found that flow
reversal
(i.e., the change
from converging
flow aggre-
gating
two continents
to diverging
flow promoting
con-
tinental breakup) depends strongly on the width of the
continent. Both studies
were limited in the range of
Rayleigh numbers and continental width. In order to
facilitate the numerical
calculations,
several
simplica-
tions were employed. For example, Zhon# and Gurnis
[1993]
imposed
weak
margins
at the raft edges
in or-
der to generate platelike behavior. œowman and Jarvis
[1993] carried out their calculations in a domain of rel-
atively small size and found that edge effects
were im-
portant.
In order to establish some of the physics of man-
tle convection
with a continent
at the upper
boundary,
we have conducted a series of laboratory experiments.
A continent
was represented
by a conducting
lid sur-
rounded by fixed temperature plates. The experiments
span large ranges
of Rayleigh
numbers
and lid width,
and were carried out in fluids with both weakly and
highly temperature-dependent
viscosities.
The study
is focused on the convective motions which occur be-
neath the conductive
lid. Several different dynamic
regimes
are found,
which
may have important
geologi-
cal implications.
The plan of the paper is straightfor-
ward. We first present the laboratory techniques. We then describe a complete set of experimental results at
steady state and discuss
several
complicating
factors:
the shape
of the lid, temperature-dependent
viscosity,
and transient effects. A simple analytical model of cellu-
lar convection
shows
how the convecting
system
adjusts
to the peculiar boundary condition. Finally, we discuss how these results bear on geological phenomena.
Laboratory Experiments. Procedure
and ConditionsBasic Framework
We have not attempted to include a continental root protruding into the fluid layer for several reasons. On the real Earth, the transition between continent and ocean is gradual and spreads over distances of several
hundreds of kilometers. The edge of a continent is usu- ally made up of young geological provinces with differ-
ent thermal structures
[Bechtel
et al., 1990; Pinet et
al., 1991; Nyblade
and Pollack,
1993]. Specifying
the
topographies
of the continental
root and margin con-
strains the flow field. For example, Lowman and Jarvis
[1993]
took a rectangular
"continent"
and found that
this had a major effect
on their solutions.
It may be
dangerous
to specify
a priori the nature and geometry
of the transition
between
continent
and ocean
as they
may well be a result, rather than the cause, of convec-
tive interactions.
We focus
on the thermal aspects
of
the problem, that is, the thermal interaction between
conduction in continents and convection in the mantle.
A recent and related study on mantle dynamics beneath a stretched lithosphere demonstrate the importance of
the thermal boundary
condition
[King and Anderson,
1994].
We use a fiat and heterogeneous
boundary
plate
at the top of a fluid layer. "Oceans" are represented by a fixed temperature boundary condition and "con- tinents" by a lid of conducting material inserted in the middle of this plate, as shown in Figure 1. The ex-
act nature of the thermal boundary condition beneath
the lid is discussed below. At the tank bottom, a fixed
temperature is imposed.
The experiments have several intrinsic limitations, which imply that they are not direct analogs of the Earth's mantle. One limitation is that the upper bound-
ary is a rigid surface,
contrary
to the oceanic
regions
of the Earth, which affects the wavelength of convec-
tion. Aspect ratios of convection rolls with stress-free
boundaries
may be quite larger than those with rigid
boundaries. The effect is weak at constant
viscosity
and may be very important in variable viscosity flu- ids depending on the values of the Rayleigh number and the viscosity contrast [Weinstein and Christensen, 1991; Tackley, 1993]. Another limitation is that the
lid is immobile. All else being equal, one may expect
that a moving continent induces a more diffuse ther-
mal anomaly in the underlying fluid. A final limitation lies in the absence of internal heating, which affects the
relative importances of the upper and lower thermal
boundary layers and hence the regimes
of upwellings
and downwellings
[McKenzie
et al., 1974].
For the purposes of determining what changes are
brought on thermal convection by conduction in a con-
tinent of finite size, one may study a system which may
not be an exact representation of the Earth. We ar- gue that, in any case, this is useful because our un-
derstanding of mantle convection remains fragmentary. Consider, for example, the mode of heating for mantle
GUILLOU AND JAUPART' CONTINENTS AND MANTLE CONVECTION 24,219
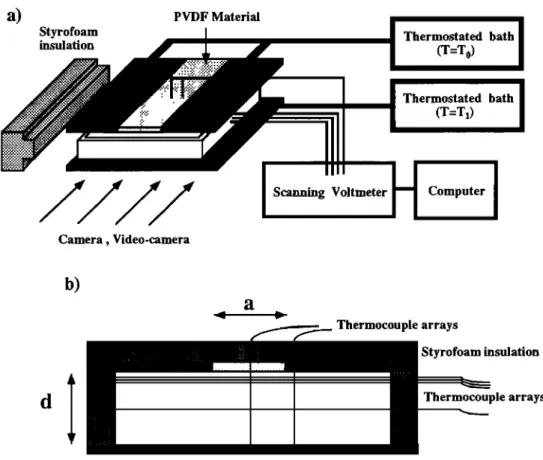
PVDF Material
Styrofoam Thermostated bath
insulation
(T=T0)
Thermostated bath
(T=T0
Camera, Video-camera
Scanning Voltmeter Computer
b)
a
Thermocouple arrays
Styrofoam insulation
d
Thermocouple
arrays
Figure 1. (a) Sketch of the experimental setup. A large aspect ratio tank with dimensions of
0.32 x 0.32 x 0.04 or 0.32 x 0.32 x 0.08 m is heated from below and cooled from above using
thermosrated baths. There is a conductive lid in the middle of the upper plate (PVDF-fiuorur polyvinydilene). The tank is thermally insulated from the laboratory using thick layers of styro-
foam. Temperatures are recorded at a number of locations and read periodically with a scanning
voltmeter connected to a computer. (b) Cross section showing the conditions imposed at the
boundaries. Dark grey shading stands for insulating styrofoam material. There is a conductive lid in the upper plate, which is shown with a light grey shading. The top of the lid is insulated
with styrofoam.
elements [O'Nions et al., 1979; Jochum et al., 1983], and
hence, if it is convecting as a separate layer, is mainly heated from below. In contrast, a whole mantle con-
vective system would be mainly heated from within by
radioactive sources. The debate on these two alterna-
tives has not been settled yet. A specific difficulty is
that the mantle is probably in a transient regime, with deep temperature anomalies due to the Pangea super-
continent [Anderson, 1982]. Also, our understanding of
the relation between continental drift and deep-seated convection is far from complete. The velocity of conti- nents at the Earth's surface varies with time and, at the
present time, is not the same for all continents. There is little information on the velocity with which Pangea was moving before it broke up. In short, it is difficult to pose exactly the general problem of mantle convection with moving continents. Thus we focus on one specific aspect and seek to establish basic physical principles which are expected to apply in a variety of conditions.
We return to the limitations of the experiments at the
end of the paper and evaluate their importance in the light of our observations.
Experimental Setup
We used wide tanks with two different heights in or- der to verify that the results were not affected signif-
icantly by the sidewalls (see below). Dimensions (in meters) were 0.32 x 0.32 in the horizontal plane and
heights were 0.04 and 0.08, corresponding to aspect ra-
tios of 8 and 4, respectively. Sidewall heat losses were
kept to a minimum by thick styrofoam plates (0.08 m thickness) (Figure la). Working fluids were silicone oils
for constant viscosity experiments and Tare and Lyle's
Golden Syrup for variable viscosity (Table 1). Constant
temperature boundary conditions are enforced by thick
(0.02 m) copper plates through which thermosrated wa-
ter is circulated. Water channels are machined in the
copper and follow a spiral which doubles back on itself,
ensuring that the inflow and outflow channels are close
to each other and that their average temperature is uni-
form. Any remaining heterogeneity in the temperature
field is smoothed out by conduction in the thick copper.
The boundary condition for the lid is discussed below
24,220 GUILLOU AND JAUPART: CONTINENTS AND MANTLE CONVECTION
Table la. Physical Properties of the Experimental Materials
Thermal Thermal Heat Coefficient of
Conductivity Diffusivity Capacity Thermal Expansion
Wm-IK -1 m25-1 Jkg-lK -1 K-1 Tank walls Lid Silicine Oils 47V50 Others Golden Syrup 0.23 1.49 10 -7 1.3 103 0.48 1.34 10 -7 0.2 103 0.16 1.14 10 -7 1.46 103 0.16 1.14 10 -7 1.46 103 0.36 1.21 10 -7 2.02 103 1.05 10 -3 9.45 10 -4 4.33 10 -4
Table lb. Density and Viscosity of the Working Fluids
Density kg m -3 Viscosity Pa s Silicone Oils 47V50 0.960 103 47V100 0.965 103 47V500 0.970 103 47V1000 0.970 103 47V10000 0.973 103 Golden Syrup 1.438 103 5.27 10 -2 9.94 10 -2 6.25 10 -1 1.04 1.02 101 + + c)) /to ---- 4.485 10 -s A=-7.5907 10 -7 B=3.8968 10 -4 C=4.0130 10 -2
Table 2 lists the variables of the problem. Using
the thickness of the fluid layer, d, as length scale, the temperature difference between top and bottom, AT,
as temperature scale• the dimensionless numbers which
characterize the experiments are as follows:
Rayleigh
number
Ra- gc•ATd3
(la)
Prandtl number Pr - - (lb) Dimensionless lid width = a/d (lc)
where c•, n, and y strand for the coefficient of thermal expansion, thermal diffusivity, and kinematic viscosity,
respectively. A fourth, dimensionless number is intro-
duced by the boundary condition at the base of the lid
(see below). Rayleigh numbers were varied between 104
and 2 107, and the smallest
value of the Prandtl num-
ber was 480. The largest value of the Rayleigh number was achieved with the oil with the smallest viscosity.
In our experimental conditions, according to the analy-
sis of Kraichnan [1962], thermal convection is never in
a regime of mechanical turbulence, i.e., the Reynolds number of l•he flow is always small. Using tracer parti- cles, we measured directly flow velocities and confirmed
this. The dimensionless lid width took values of 0.5, 1,
2, and 4. In the Earth, depending on whether convec- tion occurs in two separate systems in the upper and lower mantles, or in a single system through the whole
mantle, the typical value of the dimensionless continen-
tal size is either 10 or 2. For variable viscosity experi-
r[ients,
the viscosity
contrast
across
the fluid
layer,
de-
r•'•ted
by At/, provides
another
dimensionless
number,
which was varied up to a maximum value of 2.25 103. In most experiments, the lid stretched across the
whole width of the tank, corresponding to a tw.o-dimen-
si0nal
structure.
We also
used
a 0.08m
x 0.08m
square
lid at the center of a copper plate in order to investigatethe influence
of the shape
of the lid.
Thermal Boundary Condition Beneath Conti-
nents
In the lithosphere, heat is conducted to the upper boundary where temperature is fixed. This reference
temperature is taken to be zero. If the convective temperature field varies on a horizontal scale which is
much larger thah the lithosphere thickness, the heat flux through the lithosphere is equal to
where T is the local temperature at the base of the litho- sphere, b the lithosphere thickness, and kr the litho- spheric thermal conductivity. By continuity, this can
be written as a boundary condition for the underlying
mantle
0T Oz
where variables are dimensionless and B• is the Biot
number equal to
k• d
where k• is the mantle thermal conductivity. This condition approaches one of insulation for small B•
and tends to one of fixed temperature for large B•.
For a thick lid, this condition is modified by hori-
zontal diffusion [Hewitt et al., 1980]. For our present
purposes, we may consider that, at the base of the litho- sphere, temperature varies in the horizontal direction as follows, between a maximum value T• and 0:
T•
T - •[(1 + cos(ax)]
(3a)
Solving the heat diffusion equation leads to the follow- ing relation at the base of the lithosphere'
c
Oz with
GUILLOU AND JAUPART: CONTINENTS AND MANTLE CONVECTION 24,221
Table 2. Variables of the Problem
Symbol Typical Value Geometrical parameters
Lid width a 0.02, 0.04, 0.08, 0.16 m
Lid thickness b 0.02 m
Tank height d 0.04, 0.08 m
Tank width (internal) 0.32 m
Temperatures
Top boundary To
Bottom boundary T•
Lid (at the base center) Tc
Upwelling (at mid-height) Tp
Mean cell temperature Tm
4- 20øC
20 - 60 ø C
c-
(3a)
If the wavelength of temperature variations tends to in-
finity, B decreases toward Bc• and C goes to zero, that
is, one recovers the previous condition (2b). Constant
C depends on the maximum temperature imposed by convection. These equations show that the properties of the conducting lid are defined by the value of B•.
In practice, boundary condition (3b) reduces to a con-
dition of small heat flux. At the base of the lid, tem-
perature cannot exceed the value of i (the maximum fluid temperature), and hence the value of Bc• provides
an upper bound for the heat flux through the lid. This is small compared to the Rayleigh-B•nard value which
would be achieved without a lid.
On the Earth, the thickness of the continental litho- sphere is probably as large as 250 km. Assuming that mantle rocks within and below the lithosphere have the same thermal conductivity, we find that Bc• takes val- ues of about 3 and 11 for upper mantle and whole man- tle convection, respectively. The additional complexity
of interest here is that continents are of finite size. As
we shall see, this generates horizontal temperature vari-
ations on a scale which is proportional to the continental size. Thus, for a wide continent, one is near the long
wavelength limit and B takes small values close to Bc•.
For a narrower continent, the wavelength of horizon- tal temperature variations is smaller, which leads to an
increase of B.
Proper scaling of the experiments requires that the
B• value is the same than in the Earth. As shown in
Appendix A, the experimental Biot number is 3.0 for
the largest lid, corresponding to the long-wavelength
limit, and increases as the lid width is decreased.
Measurements and Observations
Most experiments were started by heating the lower boundary. The flow field adopted a steady state config- uration rapidly. In many cases, temperatures were ob-
served to fluctuate around mean values which remained
constant. To make sure that steady state was achieved, some experiments were run for as long as 3 weeks. At
regular time intervals during the experiments, a window
was opened in the insulating walls and photographs and
video movies were taken. The temperature field was vi- sualized with the shadowgraph technique, and the flow
field was monitored by streak photographs of tracer par-
ticles. Temperatures were measured at several locations with small thermocouples with an accuracy of 0.07øC. The heat flux at the upper surface was determined with
an accuracy of better than 10%. Details about tempera-
ture and heat flux determinations are given in Appendix B.
Steady State Convection With a Lid
Here, we describe constant viscosity experiments at
steady state. In each case a large-scale cellular circula-
tion was set up with a central upwelling beneath the lid.
Experiments were carried out in the two tanks. The as-
pect ratio of the tank had no significant effect on the cell dimensions and had a small influence on temperatures.
In the same conditions, temperatures were larger by at
most 10% in the tank with the smallest aspect ratio. The temperature data given below were all obtained in the tank with the largest aspect ratio.
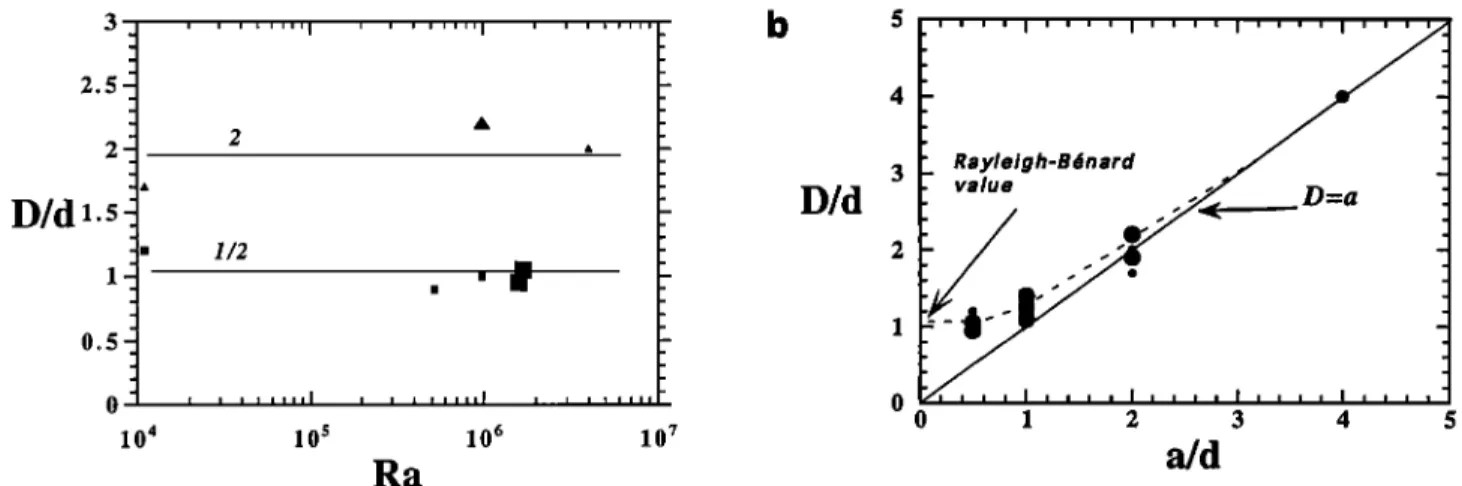
Length of Convection Cells
At the Rayleigh numbers studied here, close to the
lid, convection is organized in a central upwelling feed-
ing two symmetric cells. A conspicuous feature is that
the larger the lid, the longer the cell (Figure 2). The
length of the cells, denoted by D, can be measured us-
ing streak photographs and shadowgraphs. At Rayleigh
numbers
larger than about 2 106, convection
has a more
complicated pattern with a number of small plumes in- volved in a large-scale circulation. In these cases, the cellular structure has no sharp edge, but the uncertainty on the length value is small compared to the range of values observed. We find that the cell length exhibits no
systematic dependence on the Rayleigh number (Figure 3a). For large lids, the cell length is very close to the width of the lid (Figure 3b). With decreasing lid width, the cell length tends to the Rayleigh-Bdnard value (Fig- ure 3b).
24,222 GUILLOU AND JAUPART: CONTINENTS AND MANTLE CONVECTION
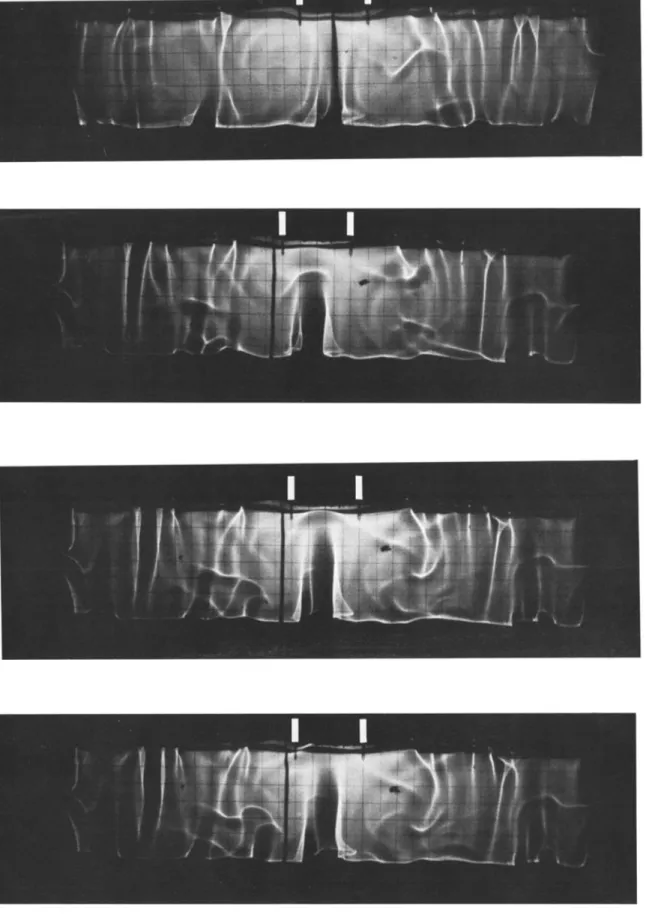
Figure 2a. Streak
photographs
of convection
cells
for a Rayleigh
number
of about 1.1 10
4. (top)
Rayleigh-Bdnard experiment with fixed temperatures at the upper and lower boundaries. The
average cell aspect ratio is 1.1. (bottom) Experiment with a lid of width a=2d at the upper
boundary. Beneath the lid, in the center of the field of view, there are two convection cells with
an aspect ratio of 2.0.
Figure 2b. Streak
photographs
of convection
cells
for a Rayleigh
number
of about 1.1 10
4. (top)
Lid width a/d=1. The two cells located below the lid have an aspect ratio of 1.3. (bottom) Lid
width a/d=2. Note that, next to the long cells, neighboring cells beneath the fixed temperature
GUILLOU AND JAUPART: CONTINENTS AND MANTLE CONVECTION 24,223 2.5 D/d 1.5 0o5 i i , 11111 i , , i i111 I i , , i i , i i 1/2 0 i i i i i illl i i i i i I ii1 ! i i i i i ii 10 4 10 5 10 • 10 7 Ra b . D/d 2 1 0 0 1 2 3 4 5 a/d
Figure 3. The aspect ratio of the central cells, D/d, originating from below the conductive lid. Size of symbols represent error bars. (a) Dependence on the Rayleigh number, for two different values of lid width (a/d=2 and 0.5). Note that, as the Rayleigh number changes by more than 2 orders of magnitude, the aspect ratio barely (:hanges. (b) Dependence on lid width. For each
lid width, values
shown
correspond
to Rayleigh
numbers
varying
from about 10
4 to 10
7. For a/d
greater than 1, the cell length is essentially equal to the width of the lid.
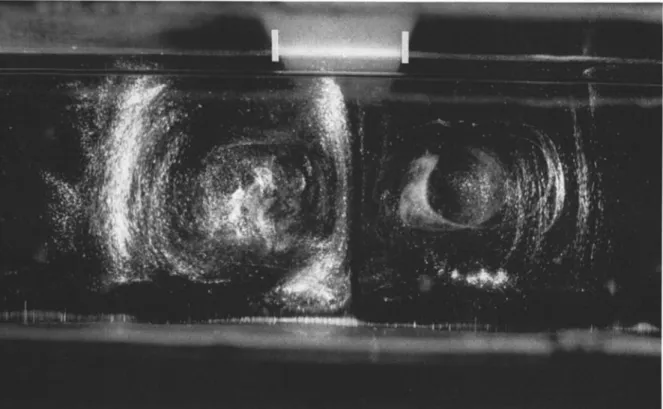
Away from the lid, below the copper plates, convec- tion follows the classical Rayleigh-B6nard pattern. At low Rayleigh number, we find rolls with an aspect ratio
of about 1 (Figure 2b). The influence of the lid on the
wavelength of convection does not extend farther than
the two central cells, and the adjacent convection cells have a normal apect ratio of about 1. At high Rayleigh
number, convection takes the form of plumes and there
is no detectable cellular structure away from the two
central cells.
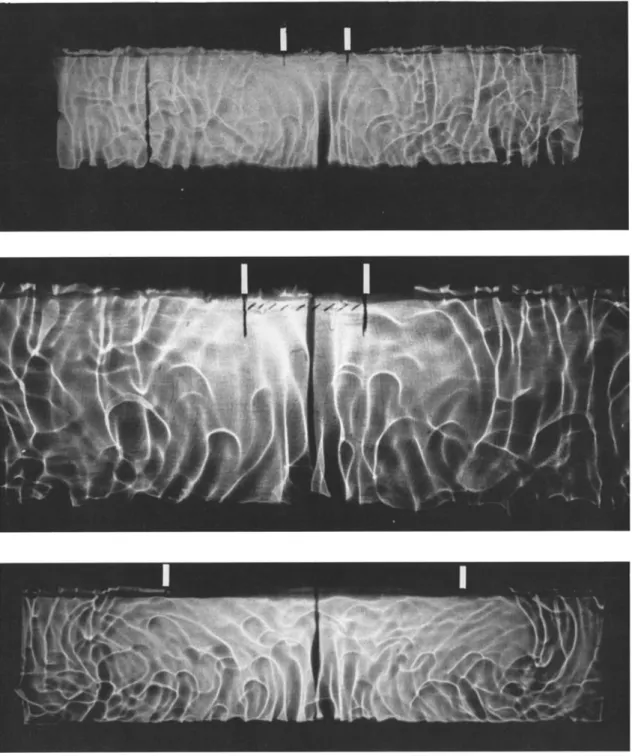
Dynamics of the Central Upwelling
We have identified three different regimes for the up-
welling beneath the lid. At small Rayleigh number, the upwelling is steady. This is demonstrated by the fact
that temperature remains constant everywhere in the tank, and by visual documents which show no visible
changes of velocity and flow pattern. As the Rayleigh
number was increased, we observed that the outlines of
the upwelling started to oscillate (Figure 4) and that its temperature started to fluctuate. For example, for a/d equal to 0.5, the amplitude of temperature fluc- tuations is zero for Ra equal to 1.1 10 4 and starts to
increase
for Ra larger
than l0 s (Figure
5). We refer to
this as an "intermittent upwelling". At high Rayleigh number, there is no longer a simple upwelling current
beneath the lid. The flow field is best described as a
set of small plumes partially coalescing at the bottom
and rising together along a large-scale cellular circula-
tion (Figure 6). These plumes are of small dimensions
and are visible both in a plane perpendicular to the
lid axis and along the axis. We call this the "plume cluster" regime. Close to the transition between the intermittent upwelling and plume cluster regimes, we observed an interesting cyclic phenomenon. The cen- tral upwelling carries upward a large quantity of fluid which ponds at the base of the lid. This volume of
fluid is hot, which impedes penetration by subsequent upwellings. This fluid volume spreads and thins pro-
gressively, and the process is eventually repeated.
The dynamic regime is insensitive to the width of the lid and is only a function of the Rayleigh num-
ber (Figure 7). The transitions between the steady
and intermittent plume regimes and between the in- termittent plume and plume cluster regimes occur at
Rayleigh
numbers
of (1.2-t-0.1)
l0 s and (1.8-t-0.1)
10
e,
respectively. These transitions have their counterparts
in the Rayleigh-B6nard configuration [e.g., Busse, 1978, pp. 1945]. In that configuration, the onset of time de-
pendence
occurs
at a Rayleigh
number
of about l0 s,
and thermal turbulence, such that small individual plu- mes detach from boundary layers, is observed when the
Rayleigh
number
is larger
than about 2 10
e. The novel
feature of the present experiments is that, beneath a
lid, convection remains organized into two parallel roll
structures even at high Rayleigh numbers. Temperature Structure of Convection
Figure 8 shows vertical temperature profiles through
the tank at various locations. At the upper bound- ary, the lid is at a higher temperature than the sur-
roundings. Below it, the temperature profile exhibits
the usual structure of two boundary layers at the top
and bottom separated by a uniform interior. However, the interior temperature is higher than the Rayleigh-
Bdnard (R-B) value of 0.5. The temperature difference
across both boundary layers is smaller than in the R-B situation which prevails away from the lid. This implies
that the heat flux at the base of the lid is smaller than
the R-B value. Moving away from the lid, the tempera-
ture profile gradually evolves toward R-B profiles with
similar boundary layers at the top and at the bottom. The upwelling beneath the lid is always the hottest
24,224 GUILLOU AND JAUPART: CONTINENTS AND MANTLE CONVECTION
:., .
..
Figure 4a. Shadowgraphs
of the "intermittent
upwelling"
regime
(Ra - 1.6 10e;
aid - 1/2). On
the top photograph,
beneath
the lid, there is no visible
upwelling
rising
from the lower
boundary
layer. However,
there is a residual
structure
left from an older upwelling
near the base
of the lid.
The three photographs
below show
an upwelling
rising toward the lid and becoming
established.
The central upwelling and the two symmetrical downwelling currents define a cell of aspect ratio
GUILLOU AND JAUPART: CONTINENTS AND MANTLE CONVECTION 24,225
Figure 4b. Streak
photograph
of a similar
experiment
(Ra - 9.6 T0*; a/d- 1/2) showing
a
well-developed cellular structure of aspect ratio T beneath the lid.
measured below the lid axis at mid height, that is, at
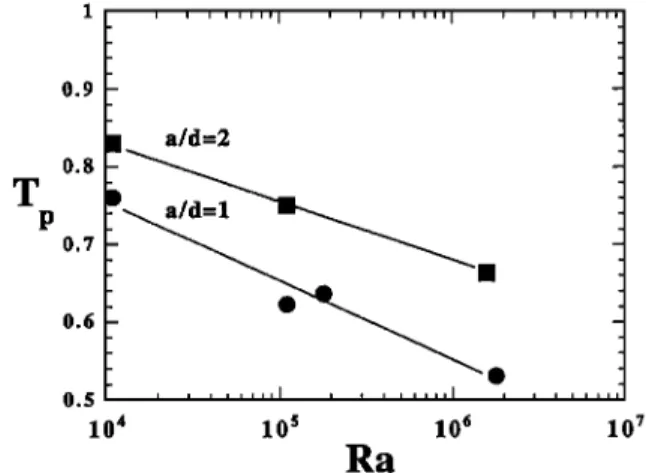
x = 0 and z - d/2 (Figure 9). For a given lid, the plume
temperature decreases with increasing Rayleigh number
and tends toward the value of 0.5, which corresponds to
well-mixed turbulent convection. For a given value of
Ra, the plume temperature increases with the width of
the lid. 6 - ] ' ['""l I' ' [ I - I ß -- I - I I -- - I - m Imm - ! -- I I -- I - I I _ I _ I I -- I 0 [ t I titi,[ I[ I [,,li[[ ] [ 10 4 •0 $ 10 6 10 ? Ra I I I I I Ill I a/d=l/2 i t i lilt/ _ - _ _ _ _ I I I I II1•' •o •
Figure 5. Dimensionless standard deviation of tem-
perature fluctuations beneath the lid as a function of
Rayleigh number. At Rayleigh numbers larger than
about 1.2 10
s, temperature
fluctuations
are significant.
They are largest for a Rayleigh number of about 5 10 s.
The vertical line separates two regimes as determined
from visual documents: regime I is a steady upwelling,
and regime 2 is an upwelling whose velocity varies with
time.
Thermal Conditions at the Base of the Lid
The temperature at the base of the lid has a bell- shaped horizontal profile with a maximum at the cen-
ter (see Figure AT in Appendix A). For simplicity, Tc
will be referred to as the lid temperature. For a given
Rayleigh number, this temperature behaves like the up-
welling temperature, Tp, increasing together with the lid width (Figure T0). For a given lid width, however,
it has a different behavior and increases weakly with
Ra, which is due to the increasing heat flux out of the
lower boundary layer. These observations emphasize that there is no simple relationship between tempera- tures at the base of the lid and in the central upwelling.
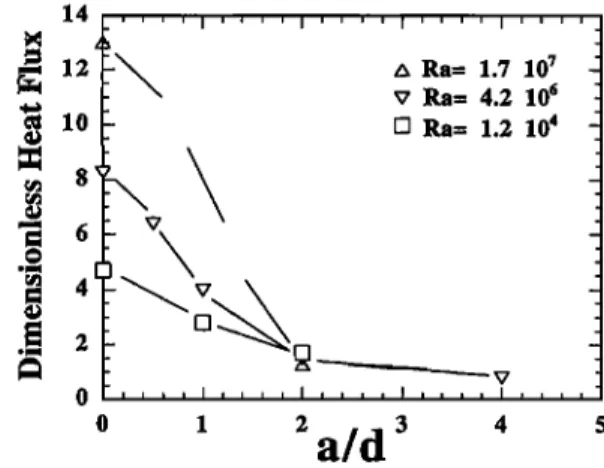
The heat flux at the base of the lid increases with in-
creasing Rayleigh number and decreases with increasing
lid width (Figure TT). The reason for the latter behav-
ior may be obtained by looking at Figure 9. As the lid is made larger, the fluid below is at a higher temper- ature, which reduces the temperature difference across the lower boundary layer. Thus the heat flux out of the lower boundary layer is smaller.
Edge of the Lid
At the upper boundary, the central upwelling feeds two diverging horizontal flows which lose little heat be- neath the lid and get cooled as they reach the cold cop- per plates. The vertical heat flux has a sharp increase at
the edge of the lid, and then decreases with increasing
distance. Figure 12 shows a detailed horizontal pro- file of heat flux at the upper boundary, for a large lid
24,226
GUILLOU AND JAUPART:
CONTINENTS
AND MANTLE CONVECTION
. .. . ß .. ...-..: . :... :.: .:½ %"•..;• ... ---".--:' ... .. :." ..'.';•4•';' i-< '. :-:.},. - •, ... .•½•;:•s• ;• ,.i• .... * ": ' •:.; ::•; •i ½ • .... . •:•;:; .:.-. ... .. ... ... ... :..' ::';.. .::.... .. :.•:•". ... y•...,...:::½ ,. ....,...:
...
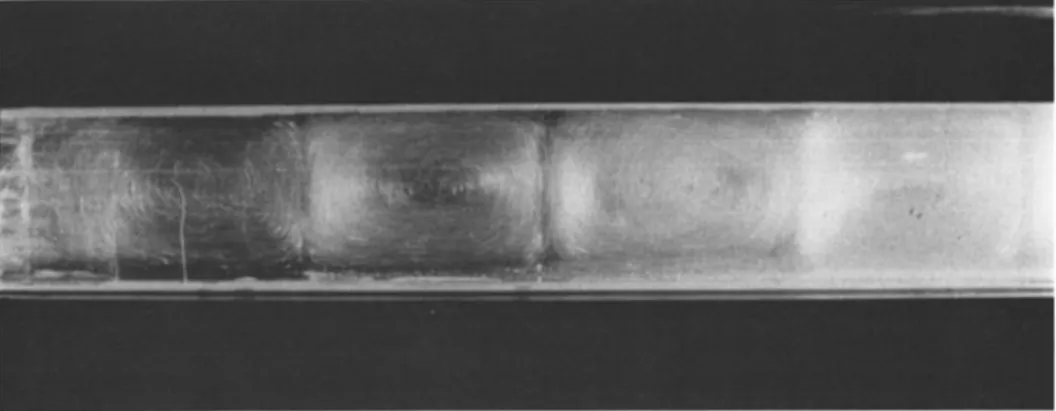
. ...
•'.•:;" •,•.... ...;:½;.
..::...
,.::
Figure 6. Shadowgraphs showing the "plume cluster" regime. The temperature field has two separate scales of motion, a small scale associated with the thickness of the thermal boundary
layers,
and a larger
scale
associated
with the lid. (Top) Ra = 1.8 10
• and aid = 1/2. The central
upwelling is made of several plumes which are taken in a general circulation of larger dimensions.
The flow field beneath the lid is defined by distribution and distortion of plumes, and contrasts
with the convection
pattern far from the lid. (Middle) Ra = 1.8 10
• and aid = 1/2. Close-up
showing the cellular pattern beneath the lid. Note that plumes are rather evenly spaced near the bottom boundary and that the large-scale horizontal motion is defined most clearly in the upper
parts of the fluid layer. (Bottom) Ra = 1.7 10
7 and a/d = 2. The central
circulation
pattern
GUILLOU AND JAUPART: CONTINENTS AND MANTLE CONVECTION 24,227
a/d
5 0 1} 4 II I I I IIIIIIi I II II II II II II II II II II II II II ,, III II II II II II II II II II II II II II • 0 0 CD ß ß ß ß l0 s 10 6 10 7Ra
• • •T 60 7OFigure 7. The three regimes of convection beneath a conductive lid, as a function of lid width and Rayleigh number. Squares stand for steady upwelling, open cir- cles for intermittent upwelling, and solid circles for plume cluster. These regimes are numbered from I to III. Evidence is drawn from temperature recordings, shadowgraphs, and video movies.
(a/d:2) and a high Rayleigh
number
(1.6 106). For
such a high value of the Rayleigh number, there is the
additional complication that small plumes detach from
the upper boundary layer at some distance from the
edge of the lid (Figure 4). This leads to a secondary
increase of heat flux.
Other Experiments
In the preceding experiments, the width of the lid de- termines the wavelength of fluid motions. In order to
show that this is a fundamental property of this form
of convection, we have carried out experiments with a temperature-dependent fluid and have looked at the
transient behavior of convection.
Temperature-Dependent Viscosity
Throughout the following, Rayleigh numbers are cal-
culated with fluid properties evaluated at the aver-
age temperature (To + T1)/2. In the Rayleigh-Bdnard
configuration, the upper boundary layer is more vis- cous than the underlying fluid, and hence, for a given Rayleigh number, is thicker than in a constant viscos- ity experiment. For rigid boundaries, this implies that
the aspect ratio of convection rolls is reduced. For vis-
cosity contrasts less than 10 a, the cell aspect ratio is between 0.8 and 0.9 [White, 1988; Giannandrea and
Christensen,
1993]. In an experiment
at Ra = 2.0 104
and At/ = 20, we found a value of 0.8. With a lid at the upper boundary and variable viscosity, we observed
the same flow pattern as before (Figure 13). We have
carried out two sets of four experiments for two val-
ues of Ra and a/d, spanning the exact same range of viscosity contrast, from 20 to 2.2 10 a. For Ra = 1.3
80 0 , , i , _ 0.1 0.2 0.3 0.4 0.5 0.6 0.7 0.8 0.9 Dimensionless Temperature
Figure 8. Vertical profiles of temperature for an exper-
iment with Ra = 9.6 l0 s, and aid = 1/2. Symbols
show
the data points. Open circles correspond to the center of the tank, that is, below the lid axis. Stars and crosses
represent data taken at dimensionless distances x/d of
0.625 and 1.625 from the axis, respectively. These two profiles are through convection cells away from the lid, which have a normal aspect ratio.
l0 s and a/d = 1, we found that D/d = 0.9 + 0.1 for
these
four experiments.
At Ra = 1.1 10
4 and aid = 2,
D/d was 2.1 + 0.1. Thus the central convection cells
have the same aspect ratio than in constant viscosity
experiments.
The upper boundary layer is thicker than in the con-
stant viscosity case, which leads to an increase of the
interior temperature. All else being equal, this leads to
a larger central upwelling
temperature
(Figure 14) and
to a smaller heat flux through the lid. Also, tempera- tures at the base of the lid are increased. The tempera-
ture difference between the lid and the upwelling has no
significant variation over the range of viscosity contrast
studied (Figure 14). T a/d=2
0.8
I
0.7 0.6 0.5 , , , , ,,,,I ... I , 10 4 l0 s 10 • Ra I I I I III . . . 10 7Figure 9. Temperature in the middle of the central upwelling (at x=0 and z=d/2) as a function of Rayleigh
24,228 GUILLOU AND JAUPART: CONTINENTS AND MANTLE CONVECTION
T
0.8 0.6 0.4 0.2 standard deviation a/d=2 + A A _- .a/d=l
•
I i i i a •111 i • i i i i iii I i i i 10 4 l0 s 10 6 10 7Ra
,-- 12 A Ra= 1.7 10 7g•
v Ra= 4.2 10
6
• 10 [] Ra= 1.2 10 4 m 8 g= 4 2 0 , , I ... 0 1 2 3 4a/d
Figure 10. Maximum temperature at the base of the
lid (at x=0) as a function of Rayleigh number for two
lid widths. Note that its behavior is different from that
of the upwelling temperature in Figure 9.
Figure 11. Heat flux at the base of the lid and at the
axis (x--O), as a function of lid width. There are three overlapping data points for a/d=2. Values for a/d=0
are the Nusselt numbers for Rayleigh-B6nard experi- ments.
Shape of the Continent
The experiments described so far had an elongated
lid stretching across the whole width of the tank. Thus,
when convection takes the form of parallel rolls, the lid imposes the direction of the roll axes. To test full three- dimensional effects, we have used a square lid of width a = 2d. Only one experiment was carried out at a
Rayleigh
number
of 1.6 106. Once again, a strong
up-
welling was observed beneath the lid, generating an ax- isymmetric horizontal flow at the top and downwellings at a distance equal to the lid width, a, from the center. For this case, the lid occupies a smaller fraction of the upper boundary and hence the upwelling temperature
is smaller than for a two-dimensional lid with the same
width. Lid temperatures are smaller too. For compari-
son, at the same values of Ra and a/d, temperatures at
the center of the lid were 0.48 for the square geometry instead of 0.58 for the two-dimensional geometry.
Transient Behavior
Most experiments were started from a motionless and isothermal fluid layer at temperature To. At time t = 0, the lower plate was switched to the preheated water bath, and its temperature increased rapidly to T• over a time short compared to timescale for the fluid layer. Small plumes were gen'erated at the lower boundary and the interior temperature started to increase. At
Rayleigh
numbers
greater than 105, downwellings
were
first generated at the edge of the lid, and slowly mi-
grated away toward their final position (Figure 15).
We did not observe downgoing plumes or a well-defined
downwelling current beneath the lid. At Rayleigh num-
bers lower than this, the situation is more complex with convection rolls evolving outside as well as beneath the
lid. For example, for the widest lid (aid = 4), con-
vection rolls developed initially with Rayleigh-B6nard
dimensions, which led to downwellings beneath the lid.
As convection develops, temperatures in the lid pro- gressively increase. This generates a horizontal temper-
ature gradient which drives the change of roll dimen-
sions. Thus changes of roll dimensions and temperature
occur simultaneously, both in the convecting layer and in the lid. At the upper boundary, even small thermal
perturbations generate a large-scale velocity field (Fig- ure 15). This implies that horizontal conduction in the
lid plays little role. Horizontal diffusion would be im-
portant in the transient, for example, if a central plume
of small dimensions was maintained for a long time and
was heating the lid base only locally.
We conclude that the evolution toward steady state
is determined by convection in the fluid layer. We have
determined the time t• for which temperature reaches
80% of its final value, both at the base of the lid and in the central upwelling. Both times are identical and
have been scaled with
10
• 8
• 2
- Ra = 1.6 10 6 _ a/d = 2 _..-•',-o-o-o ß e ø Ra_•leigh-B•nard va • , • •.0 ø -- . _ : • , .e:
edge
of
0 1 2 3 4 x/dFigure 12. Heat flux through the top boundary as a
function of distance from the lid axis (x=0). The shaded
region represents a half-lid and the vertical arrow marks
the edge of the central cell. Heat flux values are consis-
tently small in the lid and increase sharply toward the
GUILLOU AND JAUPART: CONTINENTS AND MANTLE CONVECTION 24,229
I
I
i:-• .;•,.X;' ----" ':• ' :.-'.i:5
,...., ... **•...:.-:..:: .. g: ,•'•:• ,:;: • ... ., ... ,.•, ...
Figure 13. Shadowgraph
of an experiment
with temperature-dependent
viscosity
(Ra - 1.2
104, aid- 2, At/-- 2.2 10a). One may see
a dark central
upwelling
and two light downwellings
defining symmetrical cells. The aspect ratio of these two elongated cells is 2.2.
d 2
7's
-- --Ra -1/3
(4)
For all constant viscosity experiments, the dimension-
less time t s (i.e., t s/rs) takes a value of (7 q- 2), where one standard deviation is quoted (Figure 16). The scat-
ter in the data is not due to measurement errors and
does not depend on the Rayleigh number. It reflects the influence of the width of the lid. A simple theory developed in Appendix C predicts that ts has a value of 10 at large lid width and smaller values for narrower lids.
A Fluid Loop Model for Convection
With a LidIn order to understand the key physical aspects of our experiments, we develop a fluid loop model. Such a
model has been used successfully to investigate various
aspects of Rayleigh-B6nard convection [Keller, 1966;
Welander, 1967; Turcott½ and Oxburgh, 1967; Wein-
stein ½t al., 1989]. The results we wish to explain are (1) the lengths of the two central rolls are close to the width of the lid, (2) the upwelling temperature increases with increasing lid width, and (3) the upwelling temper-
ature decreases with increasing Rayleigh number.
In the core region of a convection roll, fluid is isother-
mal and velocities are small. Buoyancy leads to well-
separated upwellings and downwellings. To capture the
essential physics of this situation, attention is focused
on four stream tubes at the edges of a rectangular loop
of aspect ratio Did (Figure 17). A half-lid is present on
the left side. The upwelling is located beneath the lid
and downwelling occurs at the right-hand edge. In the
loop interior, fluid is isothermal at the mean temper- ature T•. The vertical tubes are thermally insulated, and fixed temperature conditions are imposed on the
walls of the horizontal tubes: T = T1 at the bottom
and T = To over. distance (D- a/2) on the right-hand
part of the upper horizontal tube. For simplicity, the lid is represented by a zero heat flux condition.
Streamlines are parallel to the loop edges and one
uses curvilinear abscissa s. The fluid density is given
by:
p = p,• [(1 - ct(T - T,•)]
(5)
where p,• is density at the mean temperature T,•. In the following, vector quantities are written with bold letters. The viscous force acting on the fluid, F, is pro-
portional to velocity v:
- -p.v (e)
At high Prandtl numbers, the velocity profile is fully developed over the whole thickness of fluid, and hence
R scales with
(7)
where 5 is the stream tube thickness, which is also the thickness of the thermal boundary layer. This relies on a simple model of the velocity field and is only ap-
proximate [W½lander, 1967]. Roberts [1979] has given a
more accurate treatment, but which does not improve
the model results significantly [Olson, 1987]. The equa-
tion of motion is written as follows:
1 0.9 o.8 0.7' 0.6 0.• 0.4 1 I I I I I IIII lO Ra=l.3 l0 s T - a/d=l a p -
• •
Tm
c
A - _ _ _ _, , ,,,,,,I , i i iiiill i , IllliT
100 10 z 10
Figure 14. Thermal structure of convection for ex-
periments with temperature-dependent viscosity. T.• is
the averaged
fluid temperature,
Tp temperature
in the
middle of the central upwelling, and Tc the maximum temperature at the base of the lid. With increasing vis- cosity contrast, all temperatures increase. The magni-
tude of the thermal anomaly associated with the central
upwelling, given by Tp-Tm, is rather insensitive to the
24,230 GUILLOU AND JAUPART: CONTINENTS AND MANTLE CONVECTION
..
I
I
l*igure 115. Transient
experiment
at /•a - 1.7 10
7 and aid- 2. This experiment
eventually
evolves into the plume cluster regime illustrated in Figure 6. From top to bottom, time de- velopment of convection. Note that the initial pattern of convection is made of a few isolated plumes. At the lower boundary, two hot plumes appear beneath the lid at some distance of
the axis. These are deflected sideways because of a large-scale temperature field due to the lid.
At the upper boundary, two cold plumes are generated at the edges of the lid. With time, the hot plumes migrate toward the center, and the cold plumes migrate away from the center. The
GUILLOU AND JAUPART-CONTINENTS AND MANTLE CONVECTION 24,231 lOO
t
s lO 10 4 l0 s 10 6 10 ? l0 sRa
Figure 16. Dimensionless time ts such that temper-
atures reach a value equal to 80% of their final steady
state values. All experiments with constant viscosity
are shown.
0 - -vp + pg + r
(8)
Temperature is assumed to be constant in cross section
and hence is a function of s only. Heat flux is propor-
tional to the temperature difference between the tube interior and the boundary'
dT
= -
dt
where Tb is the boundary temperature and A a heat
transfer coefficient. Heat transfer occurs over boundary
layers of thickness 5, and hence A scales with
• cr 5W
(10)
The flow rate through the tubes is denoted by q.
The equations are made dimensionless with the fol-
lowing scales:
s -
d.s
•
(11a)
T-
AT.T •
(11b)
q -
A•d.q
•
(11c)
Dropping the primes, and noting by Tn and TF the temperatures of the upwelling and downwelling, we in- tegrate the energy equation and obtain
TF
-- THexp
(a/d--
qD/d) (12a)
TH
-- 1--(1-
TF)exp
(D/d) (12b)
-%-
A third equation may be derived by writing that the
total amount of heat which is transported across a ar-
bitrary horizontal plane is the same at all heights. De- noting the mean temperature by Tin, this leads to
J(lo
1
T,• -
opT(s)ds
- •(TF + TH)
(13)
(I) -- 0 s = d+a/2 T = 0
s=d ! s=d+D(I)--0 ''
T=T m
(I)--0
s = 0 J s = 2d+D s = 2d+2D T = 1Figure 17. Schematic diagram for the fluid loop
model. The convecting fluid is followed as it revolves around an isothermal core at the mean temperature
Tin. By symmetry, there is no lateral heat transfer in
the vertical parts of the loop. Variable s denotes the curvilinear abscissa whose value increases continuously
along the loop. The loop has a half-lid of width a/2 at
the upper left-hand corner. Thermal boundary condi-
tions are shown: zero heat flux beneath the lid and for
the upwelling and downwelling parts of the loop, fixed temperature at the top and bottom.
Finally,
the momentum
equation
(8) is projected
along
the loop. Integrating along the loop leads to the follow-ing equation:
(
q -
2 + •
Rw(Tn - T?)
(14)
where Rw is a dimensionless number
gc•AT
Rw
= ARd
(15)
0.8 0.6 2 3 4 5 6 7 8 9 10 D/dFigure 18. Solutions for the fluid loop model for
Rw=50 and aid - 4. Results are shown as a function of the dimensionless loop length D/d. TH and TF are the
upwelling and downwelling temperatures, respectively, and q is the flow rate in the loop. The upwelling temper-
ature has a minimum and the flow rate has a maximum