Publisher’s version / Version de l'éditeur:
Journal of Combinatorial Chemistry, 8, 2, pp. 192-198, 2006-03-13
READ THESE TERMS AND CONDITIONS CAREFULLY BEFORE USING THIS WEBSITE. https://nrc-publications.canada.ca/eng/copyright
Vous avez des questions? Nous pouvons vous aider. Pour communiquer directement avec un auteur, consultez la première page de la revue dans laquelle son article a été publié afin de trouver ses coordonnées. Si vous n’arrivez pas à les repérer, communiquez avec nous à PublicationsArchive-ArchivesPublications@nrc-cnrc.gc.ca.
Questions? Contact the NRC Publications Archive team at
PublicationsArchive-ArchivesPublications@nrc-cnrc.gc.ca. If you wish to email the authors directly, please see the first page of the publication for their contact information.
NRC Publications Archive
Archives des publications du CNRC
This publication could be one of several versions: author’s original, accepted manuscript or the publisher’s version. / La version de cette publication peut être l’une des suivantes : la version prépublication de l’auteur, la version acceptée du manuscrit ou la version de l’éditeur.
For the publisher’s version, please access the DOI link below./ Pour consulter la version de l’éditeur, utilisez le lien DOI ci-dessous.
https://doi.org/10.1021/cc050128i
Access and use of this website and the material on it are subject to the Terms and Conditions set forth at
Classification of Spectroscopically Encoded Resins by Raman Mapping
and Infrared Hyperspectral Imaging
Fenniri, Hicham; Terreau, Owen; Chun, Sangki; Oh, Sung Joon; Finney,
William F.; Morris, Michael D.
https://publications-cnrc.canada.ca/fra/droits
L’accès à ce site Web et l’utilisation de son contenu sont assujettis aux conditions présentées dans le site LISEZ CES CONDITIONS ATTENTIVEMENT AVANT D’UTILISER CE SITE WEB.
NRC Publications Record / Notice d'Archives des publications de CNRC:
https://nrc-publications.canada.ca/eng/view/object/?id=c1083f36-7504-480c-86b8-4dff48c1bbbc
https://publications-cnrc.canada.ca/fra/voir/objet/?id=c1083f36-7504-480c-86b8-4dff48c1bbbc
Classification of Spectroscopically Encoded Resins by Raman
Mapping and Infrared Hyperspectral Imaging
Hicham Fenniri,*
,†Owen Terreau,
†Sangki Chun,
‡Sung Joon Oh,
‡William F. Finney,
§and Michael D. Morris
§National Institute of Nanotechnology, National Research Council (NINT-NRC) and Department of Chemistry, UniVersity of Alberta, ECERF: 9107-116 Street, Edmonton, Alberta T6G 2V4, Canada, LG Chem, Ltd., LG Chem Research Park, 104-1, Moonji-dong, Yuseong-gu, Daejeon, 305-380, Korea,
and Department of Chemistry, UniVersity of Michigan, 930 North UniVersity AVenue, Ann Arbor, Michigan 48109-1055
ReceiVed September 23, 2005
Barcoded resins (BCRs) were recently introduced as a potential platform for pre-encoded multiplexed synthesis, screening, and biomedical diagnostics. A key step toward the development of this strategy is the ability to rapidly interrogate and classify the BCRs in a high-throughput, noninvasive manner. Here, we describe a one-step strategy based on Raman mapping and Fourier transform infrared imaging to classify and spatially resolve randomly distributed BCRs. To illustrate this methodology, mixtures of up to 25 different BCRs were imaged and classified with 100% confidence. This strategy can be readily extended to a larger pool of resins, provided each BCR features a unique vibrational fingerprint (spectroscopic barcode). We have also established that reliable single-bead Raman spectra can be recorded in 10 ms, thus confirming that Raman mapping, in particular, could be a very fast method to classify the BCRs.
The development of methodologies for the rapid and noninvasive identification of active members of resin-supported (bio)chemical libraries remains one of the most challenging tasks in combinatorial chemistry and multiplexed biomedical diagnostics.1To address this challenge, several encoding and deconvolution schemes were reported. Encod-ing methods benefit from the multitude of microcarriers available, their amenability to split-pool synthesis,2and their compatibility with a broad spectrum of encoding/code readout strategies.3-20 The microcarriers can be encoded during library synthesis by adding a detectable chemical tag at each synthesis cycle that encodes for that particular step (parallel encoding approach). Alternatively, the microcarriers can be encoded before the synthesis (pre-encoding ap-proach),21-27 in which case they must be decoded at each synthetic cycle to keep track of their chemical history (directed sorting strategy).28Parallel encoding requires the physical separation of the tags from the microcarrier, followed by their analysis to uncover the chemical identity of the encoded material. Common molecular tags include oligonucleotide,3 haloaryls,4 trityls,5 secondary amines,6 fluorescent dyes,7 or peptides.2d,8 Although the detection methods for the elucidation of the codes are generally difficult to automate,9 they include a broad spectrum of techniques, such as mass spectrometry,10 high-resolution magic angle spinning,11and gel-phase12,13 1H and13C NMR, 19F NMR,14energy-dispersive X-ray spectroscopy,15X-ray
photoelectron spectroscopy,16infrared and Raman spectros-copy,17-19 and fluorescence spectroscopy.20 Pre-encoding requires simply matching the microcarrier’s preset code with the corresponding library member. The encoding methods in this case include optical,7,21 colloidal,22 organic23 and inorganic24 dye, graphical,25 size26 and shape,27 and radio frequency28encoding.
We have recently introduced barcoded resins (BCRs)29as a new platform for pre-encoded combinatorial synthesis and screening, wherein the beads are not just carriers for solid-phase synthesis but are, in addition, the repository of their chemical history (Figure 1). Here, we show how Raman mapping and FTIR hyperspectral imaging can be used in conjunction with the BCRs to develop a rapid noninvasive classification method for resin-supported combinatorial screening and diagnostics.
Instrumentation developed to simultaneously acquire spa-tial and spectral information has in the past coupled traditional single-point spectroscopy with mapping tech-niques. A single-point spectrum is acquired at a known spatial location, the sample is moved to a contiguous location, and another spectrum is acquired. By incrementing the position of the sample over a region of interest and acquiring a single-point spectrum at each spatial location, a chemical map of the sample is obtained. However, this approach suffers from several technical drawbacks, such as (a) the spatial resolution is limited by the mechanical movement of the sample, (b) the use of physical apertures to limit the area being investigated cuts back on signal levels, and (c) the mapping process is time-consuming for large sample areas. These technical limitations were overcome using array
* Corresponding author. Phone: (780) 492-8988. Fax: (780) 492-8632. E-mail: hicham.fenniri@ualberta.ca.
†University of Alberta. ‡LG Chem, Ltd. §University of Michigan.
10.1021/cc050128i CCC: $33.50 © 2006 American Chemical Society Published on Web 02/08/2006
detectors, in which a vibrational spectrum is collected for each pixel of the array, thus creating a 3D data cube consisting of both spatially resolved spectra and wavelength-dependent images. As a result, the type, distribution, and relative abundance of chemical components within a par-ticular system can be obtained. The ability to access the interdependence of spectral and spatial information using spectroscopic imaging of spectroscopically pre-encoded resins (barcoded resins) is the essence of the method described here.
Infrared thermography,30mapping,31and imaging,32as well as Raman mapping33 and imaging,34 are well-established high-throughput analytical tools; however, most of the relevant reports30,31a,b,32dealt with the analysis of compounds attached to the resins. As a result, the signal-to-noise ratio is relatively low and requires long data acquisition times, and direct identification of the compounds attached to the resins is not possible. The strategy described here interrogates and classifies the resins on the basis of their polymeric composition, for we have previously established that the vibrational fingerprint of the polymer dominates the spectra of the BCRs, regardless of the chemical nature of their cargo.29,34a,b As a result, (a) the signal-to-noise ratio is expected to increase dramatically, and (b) the speed and reliability of the classification are anticipated to allow for high-throughput screening of combinatorial libraries. A key step toward the establishment of this methodology is, therefore, to demonstrate that the BCRs could be readily classified using Raman mapping and FTIR imaging instru-mentation.
Results and Discussion
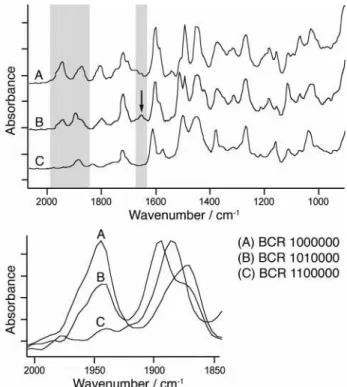
FTIR Imaging.Two approaches were used to classify the BCRs by FTIR imaging. Since by design all the BCRs feature unique spectroscopic barcodes, classification may consist in simply selecting vibrations unique to each BCR
(Figure 2, upper). Alternatively, the classification may be based on the intensity of nonunique vibrations (Figure 2, lower). It should be noted that a combination of vibrations or even the entire spectrum could be used for selective imaging and classification (see Raman Mapping section). In this section, we show that both unique and nonunique vibrations in the region of overtones and C-H out of plane deformations29,35may be used to classify a sample composed of three BCRs (sample no. 1, Table S1). The infrared spectrum of BCR 1010000 (poly(styrene-co-4-methylsty-rene)) features a unique vibration at 1651 cm-1 (Figure 2, upper) that was used to image these beads selectively (Figure 3B). BCR 0100000 (poly-2,5-dimethylstyrene) and BCR 1000000 (polystyrene) feature strong vibrations at 1884 and
Figure 1. General procedure for the preparation of the BCRs from spectroscopically encoded styrene monomers. We have arbitrarily assigned a basic binary code for each of the seven monomers. The presence (1) or absence (0) of a particular styrene monomer within a given polymer determines the binary code assigned to each resin. Thus, a seven-digit binary code was assigned for each resin obtained
from the seven parent styrene monomers. Figure 2. Single bead FTIR spectra of BCRs from sample no. 1 (upper), and 2000-1850 cm-1region (lower) showing overlapping
bands varying in intensity at 1885 and 1950 cm-1.
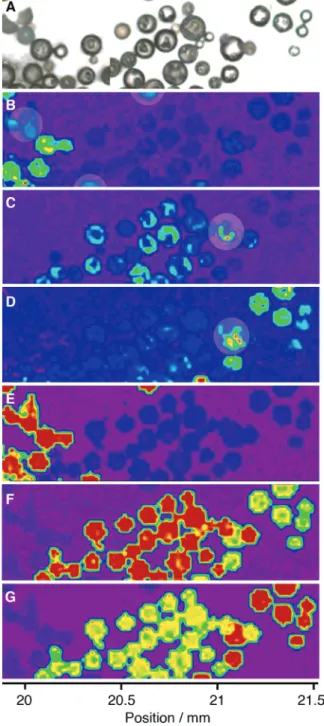
Figure 3. FTIR imaging of sample no. 1. Video image of BCRs 1000000, 1010000, and 0100000 (A) and FTIR images (700 × 700 µm2) generated from the bands at 1945 (B), 1884 (C), and 1651 cm-1 (D). The total acquisition time for each image was ∼20 s. Raman Mapping and FTIR Imaging of BCRs Journal of Combinatorial Chemistry, 2006, Vol. 8, No. 2 193
1945 cm-1, respectively. Although all three BCRs investi-gated in this experiment absorb at 1884 cm-1, BCR 0100000 shows the highest absorption and was, therefore, imaged selectively (red beads, Figure 3C). Since the other two BCRs (1000000 and 1010000) absorb also in this region, they appeared in lower intensity colors. All three BCRs feature a vibration at 1945 cm-1 with varying intensity (Figure 2, lower). This difference was used to distinguish the strongest absorbing beads (BCR 1000000) from the other two (red beads, Figure 3D). BCR 1010000 features an intermediate intensity that appears in yellow/green, whereas BCR 0100000, with the lowest intensity, is barely visible. Finally, compari-son of Figure 3B-D as well as the single-bead FTIR spectra of each BCR confirmed this assignment, and as a result, established FTIR imaging as a reliable classification method for the BCRs based on either unique vibrations or peak intensities of nonunique vibrations.
Raman Mapping.Although the FTIR images described in the previous section were obtained in transmission mode, this approach may not be suitable for larger size BCRs (500-1000 µm) or for BCRs imaged on non-IR-transparent substrates. Raman mapping in this case should alleviate these limitations, since the spectroscopic information is carried in the scattered light. To maximize the Raman mapping speed, we used only one high-resolution (2 cm-1) grating (1600-400 cm-1) covering the fingerprint region of the resins investigated (Figure 3). This region includes CdC stretching (1650-1430 cm-1), C-H in-plane deformation (1275-1000 cm-1), C-H out-of-plane deformation (900-690 cm-1), and sharp C-H stretching vibrations (near 1600, 1500, and 1430 cm-1).29,35 Prior to mapping, beads from samples no. 1-3 were organized on a microscope slide so that their identity could be inferred from their spatial location on the imaging microscope stage. Excellent single-bead Raman spectra (Figure 4) with no appreciable fluorescence were obtained, and the beads were readily distinguishable.
Mapping the BCRs can be done either by selecting vibrations unique to each polymer or by correlating the entire spectrum of each BCR against a database of BCR reference
spectra. The first approach is inherently much faster, but it is prone to errors because the vast majority of the vibrations in any BCR spectrum tend to overlap with similar vibrations in other BCRs’ spectra. The second approach is far more reliable because it is based on Raman shifts and their intensities. As an illustration of the first approach, Figure 5B-D shows the Raman maps for sample no. 1 (BCRs 0100000, 1010000, 1000000) generated at 767, 825, and 785 cm-1, respectively. The color scaling is proportional to the intensity of the vibrations in the relevant spectra and can be
Figure 4. Single-bead Raman spectra of 1000000 polystyrene, 0100000 poly(2,5-dimethyl styrene), and 1010000 poly(styrene-co-4-methyl styrene), recorded on an Almega dispersive Raman spectrometer fitted with a 532-nm excitation laser (nominal power, 25 mW; beam diameter, 1.9 mm) and an automated mapping stage. Each spectrum was collected as 2 × 1 s exposures. For a complete assignment of the spectra, see ref 29b.
Figure 5. Raman mapping of sample no. 1. (A) Video image (from left to right: 0100000, 1010000, 1000000), and Raman maps based on intensities at 767 (B), 825 (C), and 785 cm-1(D). Correlation maps of BCR 0100000 (E), BCR 1010000 (F), and BCR 1000000 (G). The correlation maps were obtained with a correlation threshold of 0%. When this threshold was raised to 90%, the red beads became more intense, and the yellow/green beads became undetect-able, as shown in Figure S3. See Supporting Information for mapping parameters.
adjusted so that only the strongly scattering beads are viewed. The 767 cm-1vibration is unique to BCR 0100000 and was used to unambiguously map out these beads (Figure 5B). BCR 1010000 show a strong vibration at 825 cm-1, which was used to map them out (Figure 5C). Although all the beads in sample no. 1 scatter to varying degrees at 785 cm-1, there is a small region in which BCR 1000000 show a relatively higher intensity (Figure 4) and were, therefore, mapped selectively at this wavenumber (Figure 4D). The results of the second approach are shown in Figure 5E-G for BCRs 0100000, 1010000, and 1000000, respectively. This approach was apparently more reliable, because it allowed the identification of all the BCR 0100000, including the ones that were not clearly identified by the first approach (Figure 5B, circled beads). Since BCRs 1000000 and 1010000 have very similar spectra, they were imaged simultaneously but were color-coded according to the level of correlation: 1010000 appeared red, and 1000000 appeared yellow in Figure 5F, whereas the opposite was observed in Figure 5G. The advantage of using correlation spectra (second approach) over peak intensity (first approach) is evident from Figure 5. Furthermore, the circled beads in Figure 5B, which are barely detected, and the circled beads in Figure 5C, D, which appear to correspond to both 1010000 and 1000000, are clearly artifacts of the first method. Smaller beads may be beneath the focal plane of the Raman microscope, and thus, the absolute intensity of each peak in the spectrum could be affected. To circumvent this drawback, the beads could be gently compressed between two micro-scope glass slides prior to mapping to ensure identical height and thickness throughout the sample. Alternatively, the autofocus function of the microscope could be used, although it would dramatically slow the imaging process. Finally, the focal plane of the microscope could be lowered so that all the particles are captured in the mapping process. In effect, as shown in Figure S1B, Raman depth profiling of the BCRs established that the Raman shifts were identical, although the scattering intensities decreased slightly with the depth of the focal plane (<20% at -82 µm).
To further establish the reliability of the spectral correlation method, four additional samples with increased complexity were investigated (see Supporting Information). The first two (samples nos. 2 and 3) were composed of spatially resolved BCRs (1000100, 1100000, 1010000 for sample no. 2, and 1000100, 1100000, 1000001 for sample no. 3). The third was a random mixture composed of four BCRs (1000000, 0100000, 0010000, 0000010). In the first two cases, the BCRs were mapped unambiguously, despite their very similar chemical composition and the presence of fluorescent comonomers (BCR 1000001). Additionally, all the beads in sample no. 4 were mapped, and their identities were confirmed by comparison with the corresponding single bead spectra. The final test was carried out on an array of 25 spectroscopically unique BCRs. As shown in Figure 6, all the BCRs were selectively mapped and classified.
In summary, hyperspectral infrared imaging and Raman mapping were shown to be reliable methods for the rapid identification and classification of the BCRs. Imaging/ mapping could be carried out using vibrations unique to each
BCR or entire sections of the spectra. Although Raman mapping is relatively slow, as compared to FTIR imaging (hours versus minutes), we envision that the former could be dramatically enhanced. For instance, a more efficient optical and CCD detector setup and higher laser power (100 mW) allowed us to reduce the spectral acquisition time from seconds to 10 ms, an enhancement of more than 100 fold (Supporting Information). A more powerful laser source (several watts) should enhance the signal-to-noise ratio and further reduce the acquisition time. Depending on the bead size, the spatial resolution of the mapping stage could be reduced (e.g., 20-50 µm) or the spectra could be collected selectively where the beads are located, thus further ac-celerating the mapping process. Reducing the spectral range to the fingerprint region only should accelerate data collection with minimal loss of spectroscopic information. Overall, >103-fold acceleration is readily feasible using existing optical and hardware set ups, which would bring the acquisition time from hours to seconds. Finally, incorporation of SERS-active particles within the BCR is also anticipated to dramatically enhance the Raman signal. The latter option is currently under investigation in our laboratories.
Acknowledgment. We thank the National Institutes of Health (NIH EB03824), the National Institute for Nanotech-nology, the University of Alberta, and the National Research Council’s Genomics and Health Initiative for supporting this program. We acknowledge the University of Michigan Bone Research Center (NIH grant P30 AR46024) for assistance with the fast Raman mapping experiments.
Supporting Information Available. Experimental sec-tion, imaging/mapping set up and parameters, additional
Figure 6. Selective Raman mapping of 25 BCRs. The binary codes refer to the tagged styrene content according to Figure 1 and ref 29b. The correlation thresholds were adjusted to ensure classification with 100% confidence and varied between 0 and 90%. When the correlation threshold was fixed at 90%, the beads appeared red. Raman Mapping and FTIR Imaging of BCRs Journal of Combinatorial Chemistry, 2006, Vol. 8, No. 2 195
Raman maps and spectra of the BCRs. This material is available free of charge via the Internet at http://pubs.acs.org.
References and Notes
(1) See, for instance: (a) Fenniri, H., Ed. Combinatorial Chemistry: A Practical Approach; Oxford University Press: Oxford, 2000. (b) Meldal, M., Pirrung, M., Eds. Curr. Opin. Chem. Biol. 2002, 6, special issue on combinatorial chemistry. (c) Joyce, G. F.; Still, W. C.; Chapman, K. T. Curr. Opin. Chem. Biol. 1997, 1, special issue on combi-natorial chemistry. (d) Drews, J. Science 2000, 287, 1960-1964. (e) Szostak, J. W., Ed. Chem. ReV. 1997, 97, 347-510, special issue on combinatorial chemistry.
(2) (a) Furka, AÄ .; Hamaker, L. K.; Peterson, M. L. In Combi-natorial Chemistry: A Practical Approach; Fenniri, H., Ed.; Oxford University Press: Oxford, 2000. (b) Lam, K. S.; Salmon, S. E.; Hersh, E. M.; Hruby, V. J.; Kazmierski, W. M.; Knapp, R. J. Nature 1991, 354, 82-84. (c) Houghten, R. A.; Pinilla, C.; Blondelle, S. E.; Appel, J. R.; Dooley, C. T.; Cuervo, J. H. Nature 1991, 354, 84-87. (d) Lam, K. S.; Lebl, M.; Krchnak, V. Chem. ReV. 1997, 97, 411-448. (3) (a) Needles, M. C.; Jones, D. G.; Tate, E. H.; Heinkel, G.
L.; Kochersperger, L. M.; Dower, J. W.; Barrett, R. W.; Gallop, M. A. Proc. Natl. Acad. Sci. U.S.A. 1993, 90, 10700-10704. (b) Nielsen, J.; Brenner, S.; Janda, K. D. J. Am. Chem. Soc. 1993, 115, 9812-9813. (e) Brenner, S.; Lerner, R. A. Proc. Natl. Acad. Sci. U.S.A. 1992, 89, 5381-5383.
(4) (a) Ohlmeyer, M. H. J.; Swanson, R. N.; Dillard, L. W.; Reader, J. C.; Asouline, G.; Kobayashi, R.; Wigler, M.; Still, W. C. Proc. Natl. Acad. Sci. U.S.A. 1993, 90, 10922-10926. (b) Dolle, R. E.; Guo, J.; O’Brien, L.; Jin, Y.; Piznik, M.; Bowman, K. J.; Li, W.; Egan, W. J.; Cavallaro, C. L.; Roughton, A. L.; Zhao, Q.; Reader, J. C.; Orlowski, M.; Jacob-Samuel, B.; DiIanni Carroll, C. J. Comb. Chem. 2000, 2, 716-731. (c) Hwang, S.; Tamilarasu, N.; Ryan, K.; Huq, I.; Richter, S.; Still, W. C.; Rana, T. M. Proc. Natl. Acad. Sci. U.S.A. 1999, 96, 12997-13002. (d) Still, W. C. Acc. Chem. Res. 1996, 29, 155-163. (e) Nestler, H. P.; Bartlett, P. A.; Still, W. C. J. Org. Chem. 1994, 59, 4723-4724. (f) Baldwin, J. J.; Burbaum, J. J.; Henderson, I.; Ohlmeyer, M. H. J. J. Am. Chem. Soc. 1995, 117, 5588-5589. (g) Burbaum, J. J.; Ohlmeyer, M. H. J.; Reader, J. C.; Henderson, I.; Dillard, L. W.; Li, G.; Randle, T. L.; Sigal, N. H.; Chelsky, D.; Baldwin, J. J. Proc. Natl. Acad. Sci. U.S.A. 1995, 92, 6027-6031. (h) Blackwell, H. E.; Perez, L.; Schrieber, S. L. Angew Chem. Int. Ed. 2001, 40, 3421-3425.
(5) Shchepinov, M. S.; Chalk, R.; Southern, E. M. Tetrahedron
2000, 56, 2713-2724.
(6) (a) Ni, Z.-J.; Maclean, D.; Holmes, C. P.; Murphy, M. M.; Ruhland, B.; Jacobs, J. W.; Gordon, E. M.; Gallop, M. A. J. Med. Chem. 1996, 39, 1601-1608. (b) Fitch, W. L.; Baer, T. A.; Chen, W.; Holden, F.; Holmes, C. P.; Maclean, D.; Shah, N.; Sullivan, E.; Tang, M.; Waybourn, P. J. Comb. Chem. 1999, 1, 188-194. (c) Maclean, D.; Schullek, J. R.; Murphy, M. M.; Ni, Z.-J.; Gordon, E. M.; Gallop, M. A. Proc. Natl. Acad. Sci.USA 1997, 94, 2805-2810. (d) St. Hilaire, P. M.; Lowary, T. L.; Meldal, M.; Bock, K. J. Am. Chem. Soc. 1998, 120, 13312-13320.
(7) Egner, B. J.; Rana, S.; Smith, H.; Bouloc, N.; Frey, J. G.; Brocklesby, W. S.; Bradley, M. Chem. Commun. 1997, 735-736.
(8) (a) Kerr, J. M.; Banville, S. C.; Zuckermann, R. N. J. Am. Chem. Soc. 1993, 115, 2529-2531. (b) Cheung, Y. W.; Abell, C.; Balasubrmanian, S. J. Am. Chem. Soc. 1997, 119, 9568-9569. (c) Salmon, S. E.; Lam, K. S.; Lebl, M.; Kandola, A.; Khattri, P. S.; Wade, S.; Patek, M.; Kocis, P.; Krchna´k, V.; Thorpe, D.; Felder, S. Proc. Natl. Acad. Sci. U.S.A. 1993, 90, 11708-11712. (d) Liu, R.; Marik, J.; Lam,
K. S. J. Am. Chem. Soc. 2002, 124, 7678-7680. (e) Vagner, J.; Barany, G.; Lam, K. S.; Krchna´k, V.; Sepetov, N. F.; Ostrem, J. A.; Strop, P.; Lebl, M. Proc. Natl. Acad. Sci. U.S.A. 1996, 93, 8194-8199.
(9) Czarnik, A. W. Curr. Opin. Chem. Biol. 1997, 1, 60-66. (10) (a) Brummel, C. L.; Lee, I. N.; Zhou, Y.; Benkovic, S. J.; Winograd, N. Science 1994, 264, 399-402. (b) Youngquist, R. S.; Fuentes, G. R.; Lacey, M. P.; Keough, T. J. Am. Chem. Soc. 1995, 117, 3900-3906. (c) Brummel, C. L.; Vickerman, J. C.; Carr, S. A.; Hemling, M. A.; Roberts, J. D.; Johnson, W.; Weinstock, J.; Gaitanopoulos, D.; Benkovic, S. J.; Winograd, N. Anal. Chem. 1996, 68, 237-242. (d) Egner, B. J.; Cardno, M.; Bradley, M. Chem. Commun. 1995, 21, 2163-2164. (e) Egner, B. J.; Langley, G. J.; Bradley, M. J. Org. Chem. 1995, 60, 2652-2653. (f) Geysen, H. M.; Wagner, C. D.; Bodnar, W. M.; Markworth, C. J.; Parke, G. J.; Schoenen, F. J.; Wagner, D. S.; Kinder, D. S. Chem. Biol.
1996, 3, 679-688. (g) Lane, S. J.; Pipe, A. Rapid Commun. Mass Spectrom. 2000, 14, 782-793. (h) Walk, T. B.; Trautwein, A. W.; Richter, H.; Jung, G. Angew. Chem. Int. Ed. 1999, 38, 1763-1765. (i) Chu, Y.-H.; Kirby, D. P.; Karger, B. L. J. Am. Chem. Soc. 1995, 117, 5419-5420. (j) Pomerantz, S. C.; McCloskey, J. A.; Tarasow, T. M.; Eaton, B. E. J. Am. Chem. Soc. 1997, 119, 3861-3867. (k) Enjalbal, C.; Maux, D.; Combarieux, R.; Martinez, J.; Aubagnac, J.-L. J. Comb. Chem. 2003, 5, 102-109.
(11) Xu, J.; Szakal, C. W.; Martin, S. E.; Peterson, B. L.; Wucher, A.; Winograd, N. J. Am. Chem. Soc. 2004, 126, 3902-3909. Song, A.; Zhang, J.; Lebrilla, C. B.; Lam, K. S. J. Am. Chem. Soc. 2003, 125, 6180-6188).
(12) (a) Maas, W. E.; Laukien, F. H.; Ory, D. G. J. Am. Chem. Soc. 1996, 118, 13085-13086. (b) Riedl, R.; Tappe, R.; Berkessel, A. J. Am. Chem. Soc. 1998, 120, 8994-9000. (c) Warrass, R.; Wieruszeski, J.-M.; Lippens, G. J. Am. Chem. Soc. 1999, 121, 3787-3788. (d) Chin, J.; Fell, B.; Pochapsky, S.; Shapiro, M. J.; Wareing, J. R. J. Org. Chem.
1998, 63, 1309-1311. (e) Klein, J.; Meinecke, R.; Mayer, M.; Meyer, B. J. Am. Chem. Soc. 1999, 121, 5336-5337. (f) Sarkar, S. K.; Garigipati, S.; Adams, J. L.; Keifer, P. A. J. Am. Chem.Soc. 1996, 118, 2305-2306. (g) Meissner, A.; Bloch, P.; Humpfer, E.; Spraul. M.; Sørensen, O. W. J. Am. Chem. Soc. 1997, 119, 1787-1788. (h) Pursch, M.; Schlotterbeck, G.; Tseng, L.-H.; Albert, K.; Rapp, W. Angew. Chem., Int. Ed. Engl. 1996, 35, 2867-2869. (i) Duus, J. O.; St. Hillaire, P. M.; Meldal, M.; Bock, K. Pure Appl. Chem.
1999, 71, 755-765. (j) Sto¨ver, H. D. H.; Fre´chet, J. M. J. Macromolecules 1991, 24, 883-888. (k) Jelinek, R.; Valente, A. P.; Valentine, K. G.; Opella, S. J. J. Magn. Reson. 1997, 125, 185-187. (l) Gibb, S. J.; Johnson, S. J. J. Magn. Reson.
1991, 93, 395-402. (m) Dingley, A. J.; Mackay, J. P.; Chapman, B. E.; Morris, M. B.; Kuchel, P. W.; Hambly, B. D.; King, G. F. J. Biomol. NMR 1995, 6, 321-328. (n) Altieri, A. S.; Hinton, D. P.; Byrd, R. A. J. Am. Chem. Soc.
1995, 117, 7566-7567. (o) Stranix, B. R.; Gao, J. P.; Barghi, R.; Salha, J.; Darling, G. D. J. Org. Chem. 1997, 62, 8987-8993. (p) Ruhland, T.; Andersen, K.; Pedersen, H. J. Org. Chem. 1998, 63, 9204-9211.
(13) (a) Bayer, E.; Dengler, M.; Hemmasi, B. Int. J. Pept. Protein Res. 1985, 25, 178-186. (b) Bayer, E. Angew. Chem., Int. Ed. Engl. 1991, 30, 113-129.
(14) (a) Bayer, E.; Albert, K.; Willisch, H.; Rapp, W.; Hemmasi, B. Macromolecules 1990, 23, 1937-1940. (b) Look, G. C.; Holmes, C. P.; Chinn, J. P.; Gallop, M. A. J. Org. Chem.
1994, 59, 7588-7590. (c) Brown, J. M.; Ramsden, J. A. Chem. Commun. 1996, 2117-2118. (d) Keifer, P. A.; Baltusis, L.; Rice, D. M.; Tymiak, A. A.; Shoolery, J. N. J. Magn. Reson. A 1996, 119, 65-75. (e) Barany, G.; Kneib-Cordonier, N.; Mullen, D. G. Int. J. Peptide Protein Res.
1987, 30, 705-739. (f) Epton, R.; Goddard, P.; Irvin, K. J. Polymer 1980, 21, 1367-1371. (g) Sterlicht, H.; Kenyon, G. L.; Packer, E. L.; Sinclair, J. J. Am. Chem. Soc. 1971,
93, 199-208. (h) Blossey, E. C.; Cannon, R. G.; Ford, W. T.; Periyasamy, M.; Mohanraj, S. J. Org. Chem. 1990, 55, 4664-4668. (i) Shapiro, M. J.; Wareing, J. R. Curr. Opin. Chem. Biol. 1998, 2, 372-375. (j) Kanemitsu, T.; Kanie, O.; Wong, C.-H. Angew. Chem., Int. Ed. 1998, 38, 3415-3418.
(15) (a) Hochlowski, J. A.; Whittern, D. N.; Sowin, T. J. J. Comb. Chem. 1999, 1, 291-293. (b) Pirrung, M. C.; Park, K. Bioorg. Med. Chem. Lett. 2000, 10, 2115-2118. (c) Stones, D.; Miller, D. J.; Beaton, M. W.; Rutherford, T. J.; Gani, D. Tetrahedron Lett. 1998, 39, 4875-4878. (d) Svensson, A.; Bergquist, K.-E.; Fex, T.; Kihlberg, J. Tetrahedron Lett.
1998, 39, 7193-7196.
(16) Neilly, J. P.; Hochlowski, J. E. Appl. Spectrosc. 1999, 53, 74-81.
(17) Yoo, S. E.; Gong, Y.-D.; Seo, J.-S.; Sung, M. M.; Lee, S. S.; Kim, Y. J. Comb. Chem. 1999, 1, 177-180.
(18) (a) Yan, B.; Yan, H. J. Comb. Chem. 2001, 3, 78-84. (b) Yan, B.; Chu, Y.-H.; Shapiro, M.; Richmond, R.; Chin, J.; Liu, L.; Yu, Z. In Combinatorial Chemistry: A Practical Approach, Fenniri, H., Ed.; Oxford University Press: Oxford, 2000; pp 263-286. (c) Yan, B. Curr. Opin. Chem. Biol.
2002, 6, 328-332. (d) Yan, B.; Kumaravel, G.; Anjaria, H.; Wu, A.; Petter, R. C.; Jewel, F. C., Jr.; Wareing, J. R. J. Org. Chem. 1995, 60, 5736-5738. (e) Gosselin, F.; De Renzo, M.; Ellis, T. H.; Lubell, W. D. J. Org. Chem. 1996, 61, 7980-7981. (f) Russell, K.; Cole, D. C.; McLaren, F. M.; Pivonka, D. E. J. Am. Chem. Soc. 1996, 118, 7941-7945. (g) Luo, Y.; Ouyang, S.; Armstrong, R. W.; Murphy, M. M. J. Org. Chem. 1998, 63, 8719-8722. (h) Chen, C.; Ahlberg Randell, L. A.; Miller, R. B.; Jones, A. D.; Kurth, M. J. J. Am. Chem. Soc. 1994, 116, 2661-2662. (i) Frechet, J. M.; Schuerch, C. J. Am. Chem. Soc. 1971, 93, 492-496. (19) (a) Gift, A. D.; Ma, J.; Haber, K. S.; McClain, B. L.; Ben-Amotz, D. J. Raman Spectrosc. 1999, 30, 757-765. (b) Hashimoto, M.; Araki, T.; Kawata, S. Opt. Lett. 2000, 25, 1768-1770. (c) Ma, J.; Ben-Amotz, D. Appl. Spectrosc.
1997, 51, 1845-1848. (d) Fenniri, H.; Hedderich, H. G.; Haber, K. S.; Achkar, J.; Taylor, B.; Ben-Amotz, D. Angew. Chem., Int. Ed. 2000, 39, 4483-4485. (e) Fenniri, H.; McFadden, R. M. Multispectral Imaging for the High-Throughput Evaluation of Solid Phase-Supported Chemical Libraries, In Optimization of Solid-Phase Combinatorial Synthesis; Yan, B., Czarnik, A. W., Eds.; Marcel Dekker: New York, 2001; pp 287-304. For FTIR, add: Bandel, H.; Haap, W.; Jung, G. FT-Infrared Spectroscopy and IR-Microscopy On-Bead Analysis of Solid-Phase Synthesis. In Combinatorial Chemistry Synthesis, Analysis, Screening; Jung, G., Ed.; Wiley-VCH Verlag GmbH & Co.: Toronto, 2001, pp 479-498.
(20) (a) Rahman, S. S.; Busby, D. J.; Lee, D. C. J. Org. Chem.
1998, 63, 6196-6199. (b) Hochlowski, J.; Whittern, D.; Pan, J.; Swenson, R. Drugs Future 1999, 24, 539-554. (c) Pivonka, D. E. J. Comb. Chem. 2000, 2, 33-38. (d) Deben, I. E. A.; van Wijk, T. H. M.; van Doornum, E. M.; Hermkens, P. H. H.; Kellenbach, E. R. Mikrochim. Acta
1997, 14, 245-246. (e) Chan, T. Y.; Chen, R.; Sofia, M. J.; Smith, B. C.; Glennon, D. Tetrahedron Lett. 1997, 38, 2821-2824.
(21) (a) Scott, R. H.; Balasubramanian, S. Bioorg. Med. Chem. Lett. 1997, 7, 1567-1572. (b) Yan, B.; Martin, P. C.; Lee, J. J. Comb. Chem. 1999, 1, 78-81.
(22) Sebestyen, F.; Szendrei, G.; Mark, M.; Doda, M.; Illiyes, E.; Szokan, G.; Kindla, K.; Rapp, W.; Szego, P.; Campian, E.; Furka, A. J. Pept. Sci. 1998, 4, 294-299.
(23) (a) Trau, M.; Battersby, B. J. AdV. Mater. 2001, 13, 975-979. (b) Battersby, B. J.; Bryant, D.; Meutermans, W.; Matthews, D.; Smythe, M. L.; Trau, M. J. Am. Chem. Soc.
2000, 122, 2138-2139. (c) Battersby, B. J.; Lawrie, G. A.; Johnston, A. P. R.; Trau, M. Chem. Commun. 2002, 1435-1441. (d) Grøndahl, L.; Battersby, B. J.; Bryant, D.; Trau,
M. Langmuir 2000, 16, 9709-9715. (e) Stsiapura, V.; Sukhanova, A.; Artemyev, M.; Pluot, M.; Cohen, J. H. M.; Baranov, A. V.; Oleinikov, V.; Nabiev, I. Anal. Biochem.
2004, 334, 257-265. (f) Mathews, D. C.; Grondahl, L.; Battersby, B. J.; Trau, M. Aust. J. Chem. 2001, 54, 649-656. (g) O’Brien, P.; Cummins, S. S.; Darcy, D.; Dearden, A.; Masala, O.; Pickett, N. L.; Ryley, S.; Sutherland, L. Chem. Commun. 2003, 20, 2532-2533.
(24) (a) Fulton, R. J.; McDade, R. L.; Smith, P. L.; Kienker, L. J.; Kettman, K. R., Jr. Clin. Chem. 1997, 43, 1749-1756. (b) Kettman, J. R.; Davies, T.; Chandler, T.; Oliver, K. G.; Fulton, R. J Cytometry 1998, 33, 234-243. (c) Prabhakar, U.; Eirikis, E.; Davis, H. M. J. Immunol. Methods 2002, 260, 207-218. (d) Taylor, J. D.; Briley, D.; Nguyen, Q.; Long, K.; Iannone, M. A.; Li, M. S.; Ye, F.; Afshari, A.; Lai, E.; Wagner, M.; Chen, J.; Weiner, M. P. Biotechniques 2001, 30, 661-669. (e) Yang, L.; Tran, D. K.; Wang, X. Genome Res. 2001, 11, 1888-1898. (f) Dunbar, S. A.; Jacobson, J. W. Clin. Chem. 2000, 46, 1498-1500. (g) Vignali, D. A. A. J. Immunol. Methods 1999, 227, 41-52. (h) Carson, R. T.; Vignali, D. A. A. J. Immunol. Methods 2000, 243, 243-255. (i) Gordon, R. F.; McDade, R. L. Clin. Chem. 1997, 43, 1799-1801. (j) Smith, P. L.; Walker-Peach, C. R.; Fulton, R. J.; DuBois, D. B. Clin. Chem. 1998, 44, 2054-2056. (k) Oliver, K. G.; Kettman, J. R.; Fulton, R. J. Clin. Chem. 1998, 44, 2057-2060. (l) Bellisario, R.; Colinas, R. J.; Pass, K. A. Clin. Chem. 2000, 46, 1422-1424. (m) Pantano, P.; Walt, D. R. Chem. Mater. 1996, 8, 2832-2835. (n) Walt, D. R. Science 2000, 287, 451-452. (o) Michael, K. L.; Taylor, L. C.; Schultz, S. L.; Walt, D. R. Anal. Chem.
1998, 70, 1242-1248. (p) Steemers, F. J.; Ferguson, J. A.; Walt, D. R. Nat. Biotechnol. 2000, 18, 91-94. (q) Ferguson, J. A.; Steemers, F. J.; Walt, D. R. Anal. Chem. 2000, 72, 5618-5624. (r) Szurdoki, F.; Michael, K. L.; Walt, D. R. Anal. Biochem. 2001, 291, 219-228. (s) Keij, J. F.; Steinkamp, J. A. Cytometry 1998, 33, 318-323. (t) Ku¨rner, J. M.; Klimant, I.; Krause, C.; Pringsheim, E.; Wolfbeis, O. S. Anal. Biochem. 2001, 297, 32-41.
(25) (a) Bruchez, M.; Maronne, M.; Gin, P.; Weiss, S.; Alivisatos, A. P. Science 1998, 281, 2013-2016. (b) Han, M.; Gao, X. H.; Su, J. Z.; Nie, S. Nat. Biotechnol. 2001, 19, 631-635. (26) (a) Houghten, R. A. Proc. Natl. Acad. Sci. U.S.A. 1985, 82, 5131-5135. (b) Xiao, X.; Zhao, C.; Potash, H.; Nova, M. Angew. Chem., Int. Ed. Engl. 1997, 36, 780-782. (c) Martin, B. R.; Dermody, D. J.; Reiss, B. D.; Fang, M.; Lyon, L. A.; Natan, M. J.; Mallouk, T. E. AdV. Mater. 1999, 11, 1021-1025. (d) Nicewarner-Pen˜a, S. R.; Freeman, R. G.; Reiss, B. D.; He, L.; Pen˜a, D. J.; Walton, I. D.; Cromer, R.; Keating, K. D.; Natan, M. J. Science 2001, 294, 137-141. (e) Wedekind, P.; Kubitscheck, U.; Heinrich, O.; Peters, R. Biophys. J. 1996, 71, 1621-1632.
(27) (a) McHugh, T. M.; Miner, R. C.; Logan, L. H.; Stites, D. P. J. Clin. Microbiol. 1988, 26, 1957-1961. (b) Scillian, J. J.; McHugh, T. M.; Busch, M. P.; Tam, M.; Fulwyler, M. J.; Chien, D. Y.; Vyas, G. N. Blood 1989, 73, 2041-2048. (28) Vaino, A. R.; Janda, K. D. Proc. Natl. Acad. Sci. U.S.A.
2000, 97, 7692-7696.
(29) (a) Nicolaou, K. C.; Pfefferkorn, J. A.; Mitchell, H. J.; Roeker, A. J.; Barluenga, S.; Affleck, R. L.; Lillig, J. E. J. Am. Chem. Soc. 2000, 122, 9954-9967. (b) Moran, E. J.; Sarshar, S.; Cargill, J. F.; Shahbaz, M. J. M.; Lio, A.; Mjalli, A. M.; Armstrong, R. W. J. Am. Chem. Soc. 1995, 117, 10787-10788. (g) Herpin, T. F.; Van Kirk, K. G.; Salvino, J. M.; Yu, S. T.; Labaudiniere, R. F. J. Comb. Chem. 2000, 2, 513-521. (i) Service, R. F. Science 1995, 270, 577. (30) (a) Fenniri, H.; Ding, L.; Ribbe, A. E.; Zyrianov, Y. J. Am.
Chem. Soc. 2001, 123, 8151-8152. (b) Fenniri, H.; Chun, S.; Ding, L.; Zyrianov, Y.; Hallenga, K. J. Am. Chem. Soc.
2003, 125, 10546-10560.
(31) (a) Taylor, S. J.; Morken, J. P. Science 1998, 280, 267-270. (b) Holzwarth, A.; Schmidt, H.-W.; Maier, W. F. Angew. Chem., Int. Ed. 1998, 37, 2644-2647. (c) Reetz, M. T.; Becker, M. H.; Ku¨hling, K. M.; Holzwarth, A. Angew. Chem., Int. Ed. . 1998, 37, 2647-2650. (d) Moates, F. C.; Somani, M.; Annamalai, J.; Richardson, J. T.; Lusss, D.; Wilson, R. C. Ind. Eng. Chem. Res. 1996, 35, 4801-4803. (e) Reetz, M. T.; Becker, M. H.; Liebl, M.; Fu¨rstner, A. Angew. Chem., Int. Ed. 2000, 39, 1236-1239. (f) Schmitz, C.; Posch, P.; Thelakkat, M.; Schmidt, H. W. Phys. Chem. Chem. Phys. 1999, 1, 1777-1781.
(32) (a) Haap, W. J.; Walk, T. B.; Jung, G. Angew. Chem., Int. Ed. Engl. 1998, 37, 3311-3314. (b) Bandel, H.; Haap, W.; Jung, G. In Combinatorial Chemistry: Synthesis, Analysis, Screening; Jung, G., Ed.; Wiley-VCH Verlag GmbH & Co.: Toronto, 2001, pp 479-498. (c) Lewis, E. N.; Treado, P. J.; Reeder, R. G.; Story, G. M.; Dowrey, A. E.; Marcott, C.; Levin, I. W. Anal. Chem. 1995, 67, 3377-3381. (d) Lewis, E. N.; Kidder, L. H.; Arens, J. F.; Peck, M. C.; Levin, I. W. Appl. Spectrosc. 1997, 51, 563-567. (e) Lewis, E. N.; Levin, I. W. Appl. Spectrosc. 1995, 49, 672-678. (f) Treado, P. J.; Levine, I. W.; Lewis, E. N. Appl. Spectrosc. 1996, 50, 263-269. (g) Oh, S. J.; Koenig, J. L. Anal. Chem. 1998, 70, 1768-1772. (h) Mizakoff, B. K.; Taga, K.; Keller, R. Appl. Spectrosc. 1993, 47, 1476-1483. (i) McFarland, C. A.; Koenig, J. L.; West J. L. Appl. Spectrosc. 1993, 47, 321-329. (j) Challa, S. R.; Wang, S. Q.; Koenig, J. L. Appl. Spectrosc. 1995, 49, 267-272. (k) Sommer, A. J.; Kanton, J. E. Appl. Spectrosc. 1991, 45, 1633-1640. (l) Miller Chou, B. A.; Koenig, J. L. Macromolecules 2003, 36, 4851-4861. (m) Tran, C. D.; Piloti, M. Anal. Chem. 2002, 74, 1604-1610.
(33) (a) Snively, C. M.; Oskarsdottir, G.; Lauterbach, J. J. Comb. Chem. 2000, 2, 243-245. (b) Snively, C. M.; Oskarsdottir, G.; Lauterbach, J. Angew. Chem., Int. Ed. 2001, 40, 3028-3030. (c) Hendershot, R. J.; Fanson, P. T.; Snively, C. M.;
Lauterbach, J. Angew. Chem., Int. Ed. 2003, 42, 1152-1155. (d) Kubanek, P.; Busch, O.; Thomson, S.; Schmidt, H. W.; Schu¨th, F. J. Comb. Chem. 2004, 6, 420-425.
(34) (a) Krafft, C. Anal. Bioanal. Chem. 2004, 378, 60-62. (b) McGeorge, G. Am. Pharm. ReV. 2003, 6, 94-99. (c) Schmitt, M.; Heid, M.; Schlucker, S.; Kiefer, W. Biopolymers 2002, 61, 226-232. (d) Hope, G. A.; Woods, R.; Munce, C. G. Miner. Eng. 2001, 14, 1565-1577. (e) Whitley, A.; Barnett, S. Proc. SPIE-Int. Soc. Opt. Eng. 1998, 3261, 250-259. (f) Kalasinsky, V. F. Appl. Spectrosc. ReV. 1996, 31, 193-249. (g) Schrader, B.; Baranovic, G.; Keller, S.; Sawatzki, J. Fresenius’ J. Anal. Chem. 1994, 349, 4-10. (h) Delhaye, M.; Bridoux, M.; Wallart, F. J. Mol. Struct. 1982, 79, 51-66.
(35) (a) Fenniri, H.; Hedderich, H. G.; Haber, K. S.; Achkar, J.; Taylor, B.; Ben-Amotz, D. Angew. Chem., Int. Ed. 2000, 39, 4483-4485. (b) Fenniri, H.; McFadden, R. M. In Optimization of Solid-Phase Combinatorial Synthesis; Yan, B., Czarnik, A. W., Eds.; Marcel Dekker: New York, 2001, pp 287-204. (c) Gift, A. D.; Ma, J.; Haber, K. S.; McClain, B. L.; Ben-Amotz, D. J. Raman Spectrosc. 1999, 30, 757-765. (d) McClain, B. L.; Hedderich, H. G.; Gift, A. D.; Zhang, D.; Jallad, K. N.; Haber, K. S.; Ma, J.; Ben-Amotz, D. Spectroscopy 2000, 15, 28-37. (e) Christensen, K. A.; Morris, M. D. Appl. Spectrosc. 1998, 52, 1145-1147. In addition, please see: (a) Du, F.; Scogna, R. C.; Zhou, W.; Brand, S.; Fischer, J. E.; Winey, K. I. Macromolecules 2004, 37, 9048-9055. (b) Carter, J. C.; Scrivens, W. A.; Myrick M. L.; Angel S. M. Appl. Spectrosc. 2003, 57, 761-766. (c) Gupper, A.; Wilhelm, P.; Schmied, M.; Kazarian, S. G.; Chan, K. L. A.; Reussner, J. Appl. Spectrosc. 2002, 56, 1515-1523.
(36) Lambert, J. B.; Shurvell, H. F.; Lightner, D.; Cooks, R. G. Organic Structural Spectroscopy; Prentice Hall: New York, 1998.