Publisher’s version / Version de l'éditeur:
Vous avez des questions? Nous pouvons vous aider. Pour communiquer directement avec un auteur, consultez la
première page de la revue dans laquelle son article a été publié afin de trouver ses coordonnées. Si vous n’arrivez
Questions? Contact the NRC Publications Archive team at
[email protected]. If you wish to email the authors directly, please see the first page of the publication for their contact information.
https://publications-cnrc.canada.ca/fra/droits
L’accès à ce site Web et l’utilisation de son contenu sont assujettis aux conditions présentées dans le site LISEZ CES CONDITIONS ATTENTIVEMENT AVANT D’UTILISER CE SITE WEB.
Technical Report (National Research Council of Canada. Institute for Ocean
Technology); no. TR-2007-04, 2007
READ THESE TERMS AND CONDITIONS CAREFULLY BEFORE USING THIS WEBSITE.
https://nrc-publications.canada.ca/eng/copyright
NRC Publications Archive Record / Notice des Archives des publications du CNRC : https://nrc-publications.canada.ca/eng/view/object/?id=2b24ad42-3975-4ff1-9e62-12fe8fba87c8 https://publications-cnrc.canada.ca/fra/voir/objet/?id=2b24ad42-3975-4ff1-9e62-12fe8fba87c8
NRC Publications Archive
Archives des publications du CNRC
For the publisher’s version, please access the DOI link below./ Pour consulter la version de l’éditeur, utilisez le lien DOI ci-dessous.
https://doi.org/10.4224/8894908
Access and use of this website and the material on it are subject to the Terms and Conditions set forth at
Cavitation performance testing of podded propellers with different hub
taper angle
DOCUMENTATION PAGE
REPORT NUMBER TR-2007-04
NRC REPORT NUMBER DATE
February 2007 REPORT SECURITY CLASSIFICATION
Unclassified
DISTRIBUTION Unlimited TITLE
CAVITATION PERFORMANCE TESTING OF PODDED PROPELLERS WITH DIFFERENT HUB-TAPER ANGLES
AUTHOR(S)
Mohammed Fakhrul Islam and Moqin He CORPORATE AUTHOR(S)/PERFORMING AGENCY(S) Memorial University of Newfoundland
Institute for Ocean Technology, National Research Council, St. John’s, NL PUBLICATION
SPONSORING AGENCY(S)
Memorial University of Newfoundland
Institute for Ocean Technology, National Research Council, St. John’s, NL
IOT PROJECT NUMBER NRC FILE NUMBER
KEY WORDS
Podded, propellers, propulsion, cavitation
PAGES vii, 57, App. A-B FIGS. 36 TABLES 10 SUMMARY
This study presents the experimental study of some podded propellers with different hub geometry. The experiments were conducted in the cavitation tunnel at Institute for Ocean Technology (IOT), NRC Canada. Four model propellers having the same blade sections but different hub geometry were designed and manufactured and tested at different cavitating conditions. The objective was to investigate the variations of propulsive performance and cavitation characteristics of the propellers because of different hub geometry. Tests were done in various combinations of flow velocity, propeller rotational speed and tunnel pressure. All of the propellers were tested in a wide range of advance coefficients and cavitation numbers to measure propeller thrust and torque. Reynolds Number effects on performance at design cavitation number, effect of hub taper angle on cavitation inception and comparison of performance under various cavitation conditions were investigated. The study gives a suitable basis for comparison of pusher and puller propellers’ performance (propeller only case) under cavitating conditions. It is concluded that the puller configuration propellers had better performance than the pusher configuration propellers under majority of test conditions. Results also show that hub taper angle does not have noticeable effect on visual cavitation inception and desinence.
ADDRESS National Research Council Institute for Ocean Technology Arctic Avenue, P. O. Box 12093 St. John's, NL A1B 3T5
National Research Council Conseil national de recherches Canada Canada Institute for Ocean Institut des technologies
Technology océaniques
CAVITATION PERFORMANCE TESTING OF PODDED PROPELLERS
WITH DIFFERENT HUB-TAPER ANGLES
TR-2007-04
Mohammed Fakhrul Islam and Moqin He
Summary
This study presents the experimental study of some podded propellers with different hub geometry. The experiments were conducted in the cavitation tunnel at Institute for Ocean Technology (IOT), NRC Canada. Four model propellers having the same blade sections but different hub geometry were designed and manufactured and tested at different cavitating conditions. The objective was to investigate the variations of propulsive performance and cavitation characteristics of the propellers because of different hub geometry. Tests were done in various combinations of flow velocity, propeller rotational speed and tunnel pressure. All of the propellers were tested in a wide range of advance coefficients and cavitation numbers to measure propeller thrust and torque. Reynolds Number effects on performance at design cavitation number, effect of hub taper angle on cavitation inception and comparison of performance under various cavitation conditions were investigated. The study gives a suitable basis for comparison of pusher and puller propellers’ performance (propeller only case) under cavitating conditions. It is concluded that the puller configuration propellers had better performance than the pusher configuration propellers under majority of test conditions. Results also show that hub taper angle does not have noticeable effect on visual cavitation inception and desinence.
TABLE OF CONTENTS
Summary ... iii
List of Figures ... v
List of Tables ... vii
Chapter 1. Introduction ... 1
Chapter 2. Propeller Design and Model Propellers ... 6
2-1. Propeller Blade Section Geometry... 7
2-2. Physical Characteristics of the Propellers ... 9
Chapter 3. Experimental Set up and Test Conditions ... 10
3-1. Test Programme... 11
3-2. Test Matrix: ... 12
Chapter 4. Test Procedure And Data Analysis ... 15
4-1. Podded Propellers Performance under Cavitation... 17
4-2. Reynolds Number Effects: ... 24
4-3. Hub Taper Angle Effects on Performance under Cavitation... 28
4-4. Comparison of Push and Pull Configurations under Cavitation... 31
4-5. Cavitation and Pattern Observations ... 38
4-6. Effect of Taper Angle on Cavitation Inception: ... 40
Chapter 5. Concluding Remarks ... 42
References... 45
Appendix A... 47
LIST OF FIGURES
Figure 1-1. Propulsion arrangement: Pusher and Puller Podded Propulsors and a
conventional Propeller-Rudder System ... 2 Figure 1-2 (a). Prediction of the pressure distribution at blade root section of the Push+15° propeller ...3 Figure 2-1. Podded Propulsion System: puller and pusher systems; definition of hub taper angle...6 Figure 2-2. Four model propellers (physical model). Figure (a), (b), (c), (d) are the propellers with hub taper angles of +15° (push), +20° (pull), -15° (pull), -20° (pull), respectively. ...7 Figure 3-1. NRC/IOT Cavitation Tunnel Facility...10 Figure 3-2. Pictures of nose and rear cone adapters for the propellers...11 Figure 3-3. Solid model for the propellers and nose cone adapters for Push+15 (1st row) and Push+20 (2nd row) ...12 Figure 4-1. Thrust and torque coefficients and efficiency at atmospheric condition: Propeller-Push+15°...17 Figure 4-2. Thrust and torque coefficients and efficiency at atmospheric condition: Propeller-Push+20°...18 Figure 4-3. Thrust and torque coefficients and efficiency at atmospheric condition: Propeller- Pull-15° ...18 Figure 4-4. Thrust and torque coefficients and efficiency at atmospheric condition: Propeller- Pull-20° ...19 Figure 4-5. KT of the propeller, Push+15° at different σn. TW=19.5° (±0.5°); α/αs=0.2~0.35.20
Figure 4-6. KQ of the propeller, Push+15° at different σn. TW=19.5° (±0.5°); α/αs=0.2~0.35 20
Figure 4-7. KT of the propeller, Push+20° at different σn. TW=19.5° (±0.5°); α/αs=0.2~0.35.21
Figure 4-8. KQ of the propeller, Push+20° at different σn. TW=19.5° (±0.5°); α/αs=0.2~0.35 21
Figure 4-9. KT of the propeller, Pull-15° at different σn. TW=19.5° (±0.5°); α/αs=0.2~0.35 ...22
Figure 4-10. KQ of the propeller, Pull-15° at different σn. TW=19.5° (±0.5°); α/αs=0.2~0.35.22
Figure 4-11. KT of the propeller, Pull-20° at different σn. TW=19.5° (±0.5°); α/αs=0.2~0.35 .23
LIST OF FIGURES
Figure 4-13. Performance of the propeller, Push+15° at σdesign=3.0, at three different Reynolds
Numbers (three different rps, 15, 20, 25). TW=19.5° (±1); α/αs=0.2~0.35...26
Figure 4-14. Performance of the propeller, Push+20° at σdesign=3.0, at three different Reynolds
Numbers (three different rps, 15, 20, 25). TW=19.5° (±1); α/αs=0.2~0.35...26
Figure 4-15. Performance of the propeller, Pull-15° at σdesign=3.0, at three different Reynolds
Numbers (three different rps, 15, 20, 25). TW=19.5° (±1); α/αs=0.2~0.35...27
Figure 4-16. Performance of the propeller, Pull-20° at σdesign=3.0, at three different Reynolds
Numbers (three different rps, 15, 20, 25). TW=19.5° (±1); α/αs=0.2~0.35...27
Figure 4-17 (x). Comparison of KT and KQ of the Push+15° and the push+20° propellers at
σ=variable...29-31 Figure 4-18 (x). Comparison of KT and KQ of the Pull-15° and the pull-20° propellers at
σ=variable...29-31 Figure 4-19 (x). Comparison of KT and KQ of the Push+15° and the pull-15° propellers at
σ=variable...32-35 Figure 4-20 (h). Comparison of KT and KQ of the Pull-20° and the push+20° propellers at
σ=variable...32-35 Figure 4-21. Comparison of thrust coefficient (Push+15° and Pull-15° propellers) variation with cavitation number for fixed advance coefficients... 36 Figure 4-22. Comparison of torque coefficients (Push+15° and Pull-15°) at different
cavitation numbers for fixed advance coefficients ... 36 Figure 4-23. Comparison of thrust coefficient (Push+20° and Pull-20° propellers) variation with cavitation number for fixed advance coefficients... 37 Figure 4-24. Comparison of torque coefficients (Push+20° and Pull-20°) at different
cavitation numbers for fixed advance coefficients ... 37 Figure 4-25 (x): Comparison of cavitation inception and desinence curves at different Js for the Push +15°/20° and the Pull-15°/20°) operating at 20/15 rps ...41 Figure A-1. Photographs showing back cavitation for 15° Pusher Propeller at different
cavitating conditions ...47 Figure A-2. Photographs showing back cavitation for -15° Puller Propeller at different
cavitating conditions ...49 Figure A-3. Photographs showing back cavitation for 20° Pusher Propeller at different
Figure A-4. Photographs showing back cavitation for -20° Puller Propeller at different
cavitating conditions ...53
LIST OF TABLES
Table 2-1: Basic geometry of the model propeller ... 7 Table 2-3. Sectional geometry offsets for the model propeller in the radial direction (values normalized by propeller diameter)... 8 Table 2-4. Model propeller sectional maximum thickness and camber distribution. Here, x/c is the normalized distance from leading edge; t/c is sectional thickness and f/c is sectional camber. All values are normalized by local chordlength,... 8 Table 2-5. Physical characteristics of the model propellers ... 9 Table 3-1. Summary of test conditions ... 13 Table 3-2. Calculation of tunnel absolute pressure for different cavitation numbers tested ...14 Table 4-1. Test parameters in the current experimental stud... 16 Table 4-2. Non-dimensional performance coefficients used to present the experimental results. ... 16 Table 4-3. Calculation of Reynolds Number for three different propeller rps. ... 24 Table B-1. Experimental data of the four propellers at different cavitating conditions ... 55
Chapter 1. Introduction
The podded propulsor units are integrated propulsion and steering systems that eliminate the need for the rudder, long shafts and gears of traditional propulsion systems. The propeller is driven by an electric motor that resides in a torpedo like body called pod or gondola or nacelle. The strut that connects the pod to the hull acts in place of the rudder and the propeller turns and creates a thrust at an angle, which is an added steering force. Figure 1-1 depicts the two configurations of currently used podded propulsors together with a conventional propulsion system. Basically, two configurations are mostly used in commercial field: puller configuration and pusher configuration. In the puller system (see Figure 1-1a), a propeller is fitted forward of the pod and operated in the wake of ship (almost uniform inflow condition) whereas, in the pusher system (see Figure 1-1b), the propeller is fitted aft of the pod and operated in the wake of ship and the strut.
Figure 1-1. Propulsion arrangement: Pusher and Puller Podded Propulsors and a conventional Propeller-Rudder System.
Currently, the majority of the commercial vessels are equipped with puller podded propulsion systems. It is known from the shipbuilders that the pusher propellers yield a lower thrust and hence less propulsive efficiency as compared to the puller ones. A study was performed to investigate why this is so (Islam et al. 2004). In the study we found that the pressure distribution around the blade root sections are very poor due to the abnormal blade sectional shape created by the intersection of the blade body and the hub (positive hub taper angle means reduced diameter downstream). Pusher and puller podded propellers have opposite hub taper angle, hence different blade root sections. In that study by Islam (2004), it was found that hub taper angle has considerable effects on the open water performance of podded propellers. The reason for the poor performance of a pusher propeller was attributed to the sectional pressure distributions at the blade root sections (see Figure 1-2). As shown in Figure 1-2(a), the pressure difference between the suction side and the pressure side, after mid-chord, produced negative thrust for the pusher propeller. Figure 1-2(b) shows the pressure coefficient distribution over the suction side and the pressure side and the distribution is more normal leading to better thrust for the puller propeller. This variation of performance of the two propellers may or may not be similar for operation under cavitation. Further investigations are required to examine the variation, if any, of the performance of the pusher and puller propellers at different cavitating conditions.
Figure 1-2 (a). Prediction of the pressure distribution at blade root section of the Push+15°
propeller.
Figure 1-2 (b). Prediction of the pressure distribution at blade root section of the Pull-15°
propeller.
The occurrence of cavitation on marine propellers causes undesirable effects such as radiated noise, structural vibration, blade surface erosion and deterioration of performance. The propellers used in a podded propulsion system are vulnerable to various kind of cavitation due to the change of surrounding flow field as compared to a conventional propeller-rudder propulsion system. The flow condition of a pusher and a puller propeller are different, which induces different cavitation characteristics.
There have been studies into the performance, cavitation and accompanying noise characteristics of propellers with various propeller geometries. Gawn and Burril (1957) presented valuable and extensive results in terms of performance of thirty propellers made to the same design, but having combination of different blade area ratios and face pitch ratios at several cavitation numbers over a wide range of slip. Denny (1968) presented the results of cavitation inception and performance tests for a series of model propellers designed using lifting surface procedure(s). Matsuba et al. (1994) presented extensive experimental results on the hydrodynamic characteristics of nine supercavitating propellers performed at the SRI large cavitation tunnel using new and improved measurement procedures.
Walker (1995) studied the cavitation properties of propeller blade root fillet geometries through model tests. Walker (1996) performed a comprehensive study on the effects of blockage and cavitation on the hydrodynamic loads associated with non-contact propeller ice interaction. The tests were conducted in uniform flow and in blocked flow using simulated ice blockages installed upstream of the propeller. Pustoshny and Kaprantsev (2001) reported some results of observations of full-scale propeller blade cavitation patterns for different
model propeller of a research vessel and those of noise measurements with its full-scale propeller. Pereira et al. (2002) gave the results of new experimental developments into the observation and quantification of the cavitation pattern for a skewed four-blade model propeller in a uniform inflow. In a recent investigation Pereira et al. (2004) measured the pressure and noise around a cavitating propeller in non-uniform flow field using high-speed visualization techniques.
Friesch (2001 and 2004) used ship models in cavitation tunnel to study various aspects of podded propulsor. He measured the cavitation behavior combined with pressure fluctuation and noise for different pod arrangements. He measured propeller thrust, torque and revolution at the shaft and unit thrust and side forces of the propulsors using a force balance placed in the ship model. The pod units were fitted to an adjustable frame to test the model at different azimuthing and tilt angles. Large rotational speeds (up to 35 rps) and model propeller diameters (210~260 mm) were used to reach high Reynolds Number comparable with those for conventional propeller shaft arrangements. Based on the analyses the author stated that there is an advantage for podded propulsors in puller configurations in terms of vibration and noise behavior. It is also recommended, for high-speed vessels, pod propellers with higher number of blades of lower diameter to achiever improved cavitation behavior with small loss of efficiency.
Szantyr (2001a) presented results of a series experiments, which were conducted in a cavitation tunnel and observation was made of a symmetric pod unit in the pushing, pulling and combined (tandem propeller; each fitted at one end of the pod) modes for different azimuthing angles. The emphasis was placed on the interaction between the pod body and the cavitation tip vortex system of the propeller(s). It was concluded that the presence of the strut noticeably distorted the free vortex system, especially in the puller and combined systems. The effect of the pod on the geometry of the free vortex system of the fore propeller was reported rather small.
Heinke (2004) reported on a set of systematic model tests, some of which were carried out in a large circulating and cavitation tunnel, with a 4- and 5-blade propeller in pull and push mode fitted to a generic pod housing. In order to study the cavitation behavior the author measured the forces and moments on the propeller and the pod body at different steering angles at conditions for zero rps, low number of revolutions (simulating crash stop) and at the design speed and revolutions with dynamically turning pod. The latter case, which may represent an unrealistic operating condition at large steering angles, presents a strong flow separation and cavitation leading to a reduction of propeller torque and thrust.
To the authors’ knowledge, the present work would be the first attempt to study the effects of hub taper angle on performance of a propeller designed for podded propulsion systems under cavitating conditions. It is very important to perform a comparative study of a puller and a pusher podded propeller at several cavitation conditions. This will help in judging the relative performance deterioration of these two propellers under cavitation and the superiority of one over the other. The current experimental study was carried out to fill this knowledge gap in understanding the hydrodynamics of podded propulsors under cavitation. The cavitation tunnel tests, which were carried out at the cavitation tunnel at the Institute for Ocean technology (IOT), National Research Council (NRC) Canada, involved measurements of the performance of four propellers with different hub taper angles under several cavitating conditions. Observation of the cavitation characteristics and visual cavitation inception tests were also performed. The cavitation inception tests were conducted with a view to examine the effects of hub taper angle on cavitation inception. Additional tests were done at the design cavitation number with three different propeller rotational speeds to investigate the Reynolds Number effects at design conditions. The experiments occupied much of the operating time of the tunnel over a period of four weeks exclusive of calibration and set-up time. More than 800 individual propeller test runs were done and about 18 hours of video footage of cavitation pattern was recorded. A complete account of the investigation is given in the following sections. The results are presented in a format suitable for the use of propeller designers. The details of the model propellers are given in chapter 2. Chapter 3 details the experimental set-up and test conditions. In chapter 4, all the experimental results and relevant discussions for the performance of the propellers are provided in several formats. Finally, in chapter 5 some concluding remarks and suggestions for future research are provided. All the pictures representing the propellers operating at different cavitating conditions are presented in Appendix A. The experimental data is provided in Appendix B.
The report was written to provide the information provided will form a good basis of validation for numerical work. Also, the data will be useful for design optimization and development for podded propellers over a wide range of conditions, including those, which involve cavitation.
Chapter 2. Propeller Design and Model Propellers
The four model propellers have the same blade sections with different hub taper angles. Figure 2-1 shows the definition of hub taper angle and the difference between the two major types of podded propulsion systems as described in the study by Islam et al. (2004). The basic geometrical particulars of the propellers are given in Table 2-1 (Liu 2006). The propeller is named as PP00+00C0 and its key points are summarized in Table 2-1. The name is explained as P for podded, P for propeller, 00 for zero skew, +00 for zero positive rake, C/V for constant or a variable pitch and 0/1/2…. for cavitation number to be used. The four propellers have hub taper angles of 15° (right handed pusher configuration, Push+15°), 20° (right handed pusher configuration, Push+20°), -15° (left handed puller configuration, Pull-15°), -20° (right handed puller configuration, Pull-20°). Figure 2-2 shows a photograph of the model propellers.
Figure 2-1. Podded Propulsion System: puller and pusher systems; definition of hub taper angle.
Table 2-1: Basic geometry of the model propeller.
Diameter (m) 0.27
No. of Blade 4
Design advance coefficient, J 0.8
Hub-Diameter (H/D) ratio 0.26 (based on regular straight hub)
Angular speed (rps) 25
Section thickness form NACA 66 (DTMB Modified)
Section meanline NACA = 0.8
Blade planform shape Blade planform shape was based on David Taylor Model Basin model P4119 [12]
Expanded area ratio, EAR 0.60
Pitch distribution Constant, P/D=1.0
Skew distribution Zero
Rake distribution Zero
Figure 2-2. Four model propellers (physical model). Figure (a), (b), (c), (d) are the propellers with hub taper angles of +15° (push), +20° (pull), -15° (pull), -20° (pull),
respectively.
2-1. Propeller Blade Section Geometry
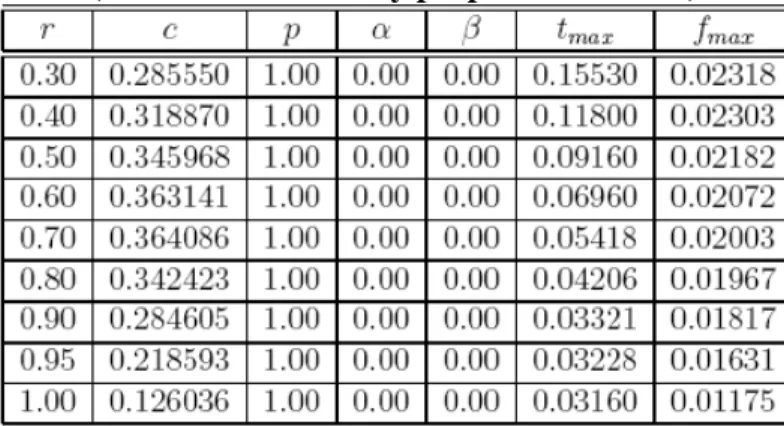
The propeller blade section is a version of the NACA 66 (DTMB modified) foil, using a A=0.8 meanline. The sectional geometry offsets are included in the Tables 2-3 and 2-4. In the tables, r is local radius, c is local chord length, p local pitch, α is local skew angle, β is local rake angle, tmax local maximum thickness and fmax is local maximum camber.
Table 2-3. Sectional geometry offsets for the model propeller in the radial direction (values normalized by propeller diameter).
Table 2-4. Model propeller sectional maximum thickness and camber distribution. Here, x/c is the normalized distance from leading edge; t/c is sectional thickness and f/c
is sectional camber. All values are normalized by local chordlength, c.
The manufacturing of the model propellers was completed at Memorial University St. John’s Campus, using CNC vertical machining center. The propeller geometry was input into the panel method code PROPELLA, which in addition to providing numerical simulation of the models, output *.dxf files for the propeller geometry. The files were then modified and used by the CNC machining center to manufacture the propeller. The manufacturing tolerance for the CNC machining is ±0.0001m (Kavanagh 2004).
2-2 Physical Characteristics of the Propellers
The physical characteristics of the model propellers are given in Table 2-5. Table 2-5. Physical characteristics of the model propellers.
Propeller Name Push+20°
Scale, λ
Number of Blades, Z Full Size Diameter, D
Average Model Diameter, Dm
Blade Area Ratio, AE/A0 Pitch ration at 0.7R, P/D Material
Model Mass Hub Taper Angle
18.5 to 1 4 5.0 m 0.27 m 0.60 1.0 Bronze 2579.39 gm. +20°
Propeller Name Push+15°
Scale, λ
Number of Blades, Z Full Size Diameter, D Average Model Diameter, Dm
Blade Area Ratio, AE/A0 Pitch ration at 0.7R, P/D Material
Model Mass Hub Taper Angle
18.5 to 1 4 5.0 m 0.27 m 0.60 1.0 Bronze 2201.91 gm. +15°
Propeller Name Pull-20°
Scale, λ
Number of Blades, Z Full Size Diameter, D Average Model Diameter, Dm
Blade Area Ratio, AE/A0 Pitch ration at 0.7R, P/D Material
Model Mass Hub Taper Angle
18.5 to 1 4 5.0 m 0.27 m 0.60 1.0 Bronze 2575.50 gm. -20°
Propeller Name Pull-15°
Scale, λ
Number of Blades, Z Full Size Diameter, D
Average Model Diameter, Dm
Blade Area Ratio, AE/A0 Pitch ration at 0.7R, P/D Material
Model Mass Hub Taper Angle
18.5 to 1 4 5.0 m 0.27 m 0.60 1.0 Bronze 2240.70 gm. -15°
Chapter 3. Experimental Set up and Test Conditions
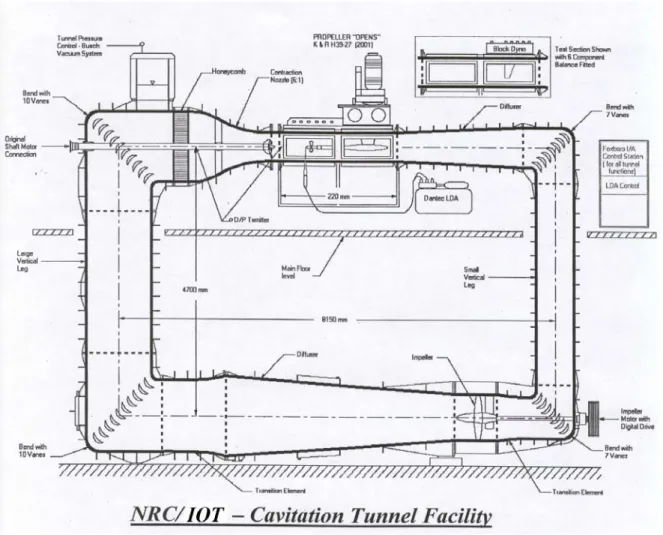
The experiments were carried out at the Institute for Ocean technology (IOT) cavitation tunnel facility. Doucet (1992) detailed the tunnel configuration. The tunnel is a closed water circuit with a 2.2 m ×0.5 m ×0.5 m cross-section with rounded corners (radius of 60 mm). Optical access to the section is possible through large plexi-glass windows. The water speeds ranges from 0.0 m/s to 10.0 m/s. The propeller rotational speed ranges form 0 rps to 30 rps. The test section pressure (absolute) ranges from 10 kPa to 200 kPa. Figure 3-1 shows the schematic view of the cavitation tunnel (taken from IOT website).
Figure 3-1. NRC/IOT Cavitation Tunnel Facility.
The tunnel is equipped with Foxboro software, which allows for a precise control of propeller rotation, flow, pressure, and filtration conditions. All torque and thrust measurements were made using a sealed strain gauge dynamometer (Kempf & Remmers) mounted between the
propeller and first shaft bearing with a ±900 N thrust range and ±45 Nm torque range. All pressure and flow measurements were made using pressure transducers, and the rotational speed of the propeller was measured using a digital tachometer. An oxygen sensor was used to give the gas content measurements to ensure proper cavitation scaling (Brent 2004). Figure 3-1 shows a schematic view of the cavitation tunnel. The detailed procedure for operating the cavitation tunnel, including its water and vacuum system, manometry, model installation and emergency procedure are to be found in Doucet (1992) and the reader is referred to that work for step-by-step instructions.
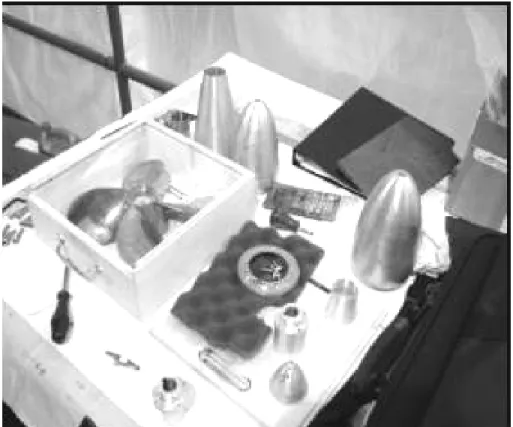
3-1. Test Programme
All of the four propellers were fitted to the shaft line of the dynamometer in the cavitation tunnel. Some aft fairing, forward cone and adapters were required to ensure smooth flow into the propeller. Figure 3-1 shows all the accessories required for the tests.
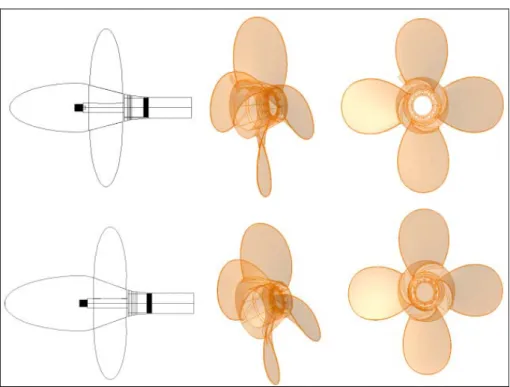
Figure 3-3. Solid model for the propellers and nose cone adapters for Push+15 (1st row) and Push+20 (2nd row).
3-2. Test Matrix:
The text matrix was comprised of basically four different types of tests:
For each of the four propellers, at constant propeller rotational speed of 25 rps, the tunnel pressure was varied from atmospheric pressure to the lowest attainable without tunnel vibrations. At each tunnel pressure the flow velocity was varied to measure propeller thrust and torque at different advance coefficients, J.
For each propeller at design cavitation number, the propeller forces were measured at three different propeller rps of 15, 20 and 25 with the similar range of advance coefficients. These tests were done to observe any Reynolds Number effect.
For each conditions mentioned above, a visual cavitation inception and desinence were recorded using digital videotapes and pictures.
The basic test matrix outline is given in Table 3-1. Four model propellers were tested at nine cavitation numbers including the cavitation number at the atmospheric pressure. For each set up, the propeller rotational speed and the static pressure in the measuring sections were maintained constant while thrust, torque and the water speed were measured over a range of advance coefficients, J.
Table 3-1. Summary of test conditions. Test Item. Rotational Speed, rps Constant Tunnel Pressure, Pt (psi) Flow Velocity VA (m/s) 1 25 1.23 3.8-7.5 2 25 1.90 3.8-7.5 3 25 2.56 3.8-7.5 4 25 3.22 3.8-7.5 5 25 4.54 3.8-7.5 6 25 5.86 3.8-7.5 7 25 9.16 3.8-7.5 8 25 14.12 3.8-7.5 9 25 14.69 3.8-7.5 10 20 9.16 3.2-7.25 11 15 9.16 2.6-6.75
In establishing the test conditions in table 3-1, the following formula (Liu, Bose and Colbourne 2002) was used for reference (or nominal) cavitation number, σn for a propeller at
the shaft centre:
2 2 2 1 D n P gh Pamb V n ρ ρ σ = + − (3.1) where, Pamb is the ambient pressure on the fluid surface in Pa or N/m2, ρ is the density of the
fluid in kg/m3, g is gravitational acceleration, taken as 9.8 m/s2 and h is the immersion depth of the propeller centre (the intersection of the shaft centre line and the directrix of the propeller, which is also normally the origin of the propeller geometry) in m. This definition is also valid for propellers with an inclined shaft in oblique flow. PV is the saturated vapor
pressure in Pa, which is a function of temperature and type of fluid. Variable n is the angular speed of the propeller in rad/s and D is the diameter of the propeller in metres. In practical ship navigation, the value of the ambient pressure Pamb is equal to the atmospheric pressure,
which is usually represented by Patm.
The ambient pressure on the surface of the fluid is a function of the cavitation number in both physical and numerical modeling processes. For example, to obtain a given cavitation number during a test in a cavitation tunnel, the local ambient pressure of the facility must be varied. For a given temperature, fluid, propeller angular speed and diameter, the cavitation number controls the ambient pressure of fluid surface, Pamb, through equation 3.2 (Liu, Bose and
Colbourne 2002):
Pamb = ρn2D2σn −ρgh+PV 2
1 (3.2) In the equations 3-1 and 3-2, the nominal cavitation numbers are based on propeller
formulations give the advantage of presenting the performance in terms of thrust coefficient, KT or torque coefficient, KQ against cavitation number, which is not a function of advance
coefficient, J.
Table 3-2 presents the nominal cavitation numbers that were tested along with the corresponding absolute tunnel pressure to achieve the cavitation number under the specified operating conditions. In the calculation, the vapor pressure at an average water temperature of 19° was used, although the water temperature varied ±1° during the experiments.
Table 3-2. Calculation of tunnel absolute pressure for different cavitation numbers tested. σn ρ (Kg/m3) n (rev/s) D (m) PV (N/m2) g (m/s2) h (m) Ptun_abs (N/m2) Ptun_rel (N/m2) Patm (N/m2) Ptun_abs (psi) 0.6 1000 25 0.27 2300 9.81 0.76 8513.15 -92786.85 101300 1.23 0.8 1000 25 0.27 2300 9.81 0.76 13069.40 -88230.60 101300 1.90 1 1000 25 0.27 2300 9.81 0.76 17625.65 -83674.35 101300 2.56 1.2 1000 25 0.27 2300 9.81 0.76 22181.90 -79118.10 101300 3.22 1.6 1000 25 0.27 2300 9.81 0.76 31294.40 -70005.60 101300 4.54 2 1000 25 0.27 2300 9.81 0.76 40406.90 -60893.10 101300 5.86 3 1000 25 0.27 2300 9.81 0.76 63188.15 -38112.85 101301 9.16 4.5 1000 25 0.27 2300 9.81 0.76 97360.03 -3941.98 101302 14.12 7.38 (σatm) 1000 25 0.27 2300 9.81 0.76 101300.00 0.00 101300 14.69
A rotational speed of 25 rps was used in order to get low cavitation numbers below 1.0 using the current facility (see equation 3-1). The propellers were also tested at two additional shaft speed of 15 rps and 20 rps at the design cavitation number of σdesign =3.0 (≈2.9894) in order
to study the Reynolds Number effects on the propeller performance. Video footage for all experimental conditions was taken. Later, photographs were extracted from the video clips at different operating conditions at all cavitation numbers. The air content number, α/αs (Matsuba et al., 1994) during the experiments varied from 0.2 to 0.4. The tunnel was de-aerated several times to keep the air content level under satisfactory conditions.
The propellers were mounted on the upstream shaft with an axially uniform inflow. While doing the tests, the tunnel static pressure and propeller rotation speed were fixed based on the required cavitation number. After the tunnel flow was stabilized, the flow speed was changed gradually to get the required advance coefficients, keeping the rotational speed fixed. Propeller thrust and torque were measured at each operating condition. Observation of the cavitation patterns was made and different cavitation characteristics were noted with sketches for all the experimental conditions.
Chapter 4. Test Procedure and Data Analysis
All of the four propellers were tested at different tunnel pressures. The propeller rotational speed, n was held constant and the speed of advance of the propeller, VA was varied from the
lowest attainable to a limit where excessive tunnel vibration could be avoided. During the experiments, thrust, torque, speed of advance, rotational speed and tunnel pressure were measured. In addition, the water temperature and air content (% oxygen dissolved in the water) were recorded before, during and after each experiment to maintain standard cavitation test conditions (ITTC recommended procedure: 7.5-02-03-03.1). The combination of propeller size (270 mm) and rotational speed (25 rps) were selected to ensure high Reynolds Number (over 1 million) to avoid any adverse effect of laminar flow over the propellers (dynamic stall of the propeller blades, details given in section 4-2). The calibration of the dynamometer was done following standard ITTC recommended procedure: 7.6-02-08 and 09. The measurements included:
• Propeller shaft thrust and torque • Shaft rotational speed
• Facility flow reference velocity • Static pressure
• Temperature
• Air Content, Water quality measure
The measured torque was corrected for bearing torque in order to determine the propeller torque. This shaft or friction loss was determined by running friction tests before and after the tests in each day till the end of the whole test program. In a friction test, two cylindrical dummy hubs were fitted to the shaft in place of the propellers. The dummy hubs have the almost the same mass (2% difference) as the actual propellers, but does not develop a thrust on the shaft. Friction torque load is measured as the shaft speed is varied throughout its operating range (at zero water speed). A tunnel boundary correction was also made to account for the effect of the tunnel walls on the water flow (Lindgren 1963). Besides the velocity corrections, corrections on the cavitation number were applied in the data analysis (Lindgren 1963). The test parameters are summarized in Table 4-1.
Table 4-1. Test parameters in the current experimental study. Parameter Recommended
Values
Test Values
Pressure adjustment to 0.7 ~ 0.9 R 0.7R
Blockage Less than 20 % of test section size
0.23 (blockage correction is necessary)
Number of revolutions of
model propeller As high as possible in accordance with tunnel speed 25, 20 and 15 Minimum Reynolds-numb Minimum value of 0.5 million
based on the blade chord length at 0.7 R
Min attained was over I million.
Number of pressure transducers
5 ~ 20 N/A
Air content / nuclei Distribution
As high as possible according to the facility experience. Values of total air content or Oxygen content should be mentioned
Around 20%
Noise Low values of the facilities Reasonably low
Reproducibility At least two different rotation rates of the model propeller should be tested
Three different rotation rates
Model propeller diameter > 200 mm 270 mm
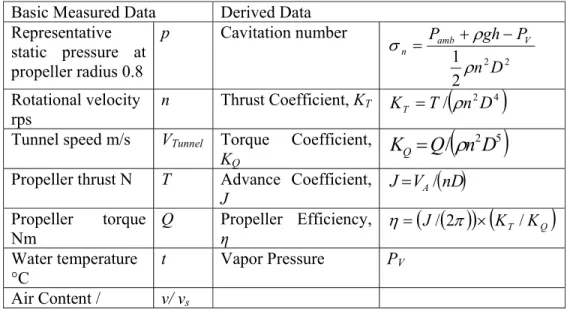
The results of the tests are presented in the form of plots of non-dimensional performance coefficients as shown in Table 4-2. Thrust and torque coefficients, KT and KQ respectively,
and propulsive efficiency, η were presented against advance coefficients, J.
Table 4-2. Non-dimensional performance coefficients used to present the experimental results.
Basic Measured Data Derived Data Representative static pressure at propeller radius 0.8 p Cavitation number 2 2 2 1 D n P gh Pamb V n ρ ρ σ = + − Rotational velocity rps n Thrust Coefficient, KT KT =T/
(
ρ
n2D4)
Tunnel speed m/s VTunnel Torque Coefficient,
KQ
(
)
5 2/
n
D
Q
K
Q=
ρ
Propeller thrust N T Advance Coefficient,
J J=VA/
( )
nD Propeller torque Nm Q Propeller Efficiency, η η=(
J/( )
2π)
×(
KT /KQ)
Water temperature °C t Vapor Pressure PV Air Content / ν/ νsOxygen Content
4-1. Podded Propellers Performance under Cavitation
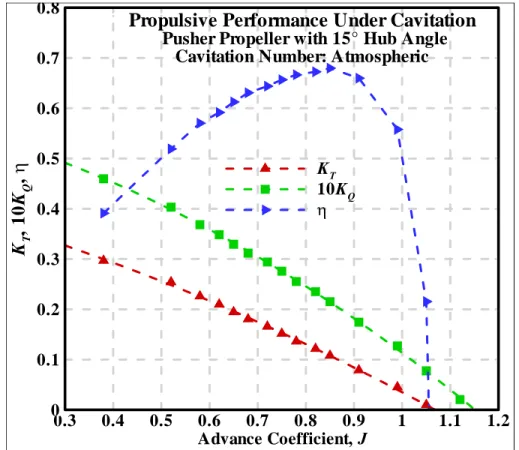
The basic results of the experiments are given as curves of thrust coefficient, KT, torque
coefficient, KQ, and efficiency, η, to a base of advance coefficient, J, for each cavitation
number, σn. The atmospheric pressure test results for the four propellers are shown in Figures
4-1 to 4-4. It is observed that the puller configuration propeller with 15° hub angle had higher propulsive efficiency than the pusher propeller with 15° hub angle; whereas the pusher propeller with 20° hub angle had higher propulsive efficiency than puller configuration propeller with 20° hub angle at all advance coefficients. A more elaborate comparative study is presented in the following sections of the report. A detail study on the uncertainty of the measuring equipment is provided in Taylor (2006).
Advance Coefficient, J
K
T,1
0
K
Q,
η
0.3 0.4 0.5 0.6 0.7 0.8 0.9 1 1.1 1.2 0 0.1 0.2 0.3 0.4 0.5 0.6 0.7 0.8 KT 10KQ ηPropulsive Performance Under Cavitation
Cavitation Number: Atmospheric
Pusher Propeller with 15° Hub Angle
Figure 4-1. Thrust and torque coefficients and efficiency at atmospheric condition: Propeller-Push+15°.
Advance Coefficient, J
K
T,1
0
K
Q,
η
0.3 0.4 0.5 0.6 0.7 0.8 0.9 1 1.1 1.2 0 0.1 0.2 0.3 0.4 0.5 0.6 0.7 0.8 KT 10KQ ηPropulsive Performance Under Cavitation
Cavitation Number: Atmospheric
Pusher Propeller with 20° Hub Angle
Figure 4-2. Thrust and torque coefficients and efficiency at atmospheric condition: Propeller-Push+20°.
Advance Coefficient, J
K
T,1
0
K
Q,
η
0.3 0.4 0.5 0.6 0.7 0.8 0.9 1 1.1 1.2 0 0.1 0.2 0.3 0.4 0.5 0.6 0.7 0.8 KT 10KQ ηPropulsive Performance Under Cavitation
Cavitation Number: Atmospheric
Puller Propeller with 15° Hub Angle
Figure 4-3. Thrust and torque coefficients and efficiency at atmospheric condition: Propeller- Pull-15°.
Advance Coefficient, J
K
T,1
0
K
Q,
η
0.3 0.4 0.5 0.6 0.7 0.8 0.9 1 1.1 1.2 0 0.1 0.2 0.3 0.4 0.5 0.6 0.7 KT 10KQ ηPropulsive Performance Under Cavitation
Cavitation Number: Atmospheric
Puller Propeller with 20° Hub Angle
Figure 4-4. Thrust and torque coefficients and efficiency at atmospheric condition: Propeller- Pull-20°.
Figure 4-5 to 4-12 show the thrust and toque coefficients of the four propellers under several cavitating conditions. Here, for different cavitation numbers the lowest achievable advance coefficients varied because of the high rotational speed of the propellers. The propellers running at high rotational speed induced flow into the propeller so that even though the flow speed was nominally zero, the actual inflow was non-zero. The data of the all the tests is provided in tabular form in Table B-1 in Appendix B.
It can be seen from Figures 4-5 to 4-12 that the cavitation effects on KT as well as on KQ were
limited to the range of cavitation number αn<1.6 for all four-propeller configurations. As the
cavitation number decreases, the produced thrust and torque decreases. As the cavitation number decreases the amount of cavitation (mainly sheet cavitation) on the blade surface area on the suction side of the propeller blades increases, which deteriorates both KT and KQ (see
-* * * * * * * * * * * * * * * o o o o o o o o o o o o o o o o
Advance Coefficient, J
T
h
ru
st
C
o
effi
ci
en
t,
K
T 0.3 0.4 0.5 0.6 0.7 0.8 0.9 1 1.1 0 0.05 0.1 0.15 0.2 0.25 0.3 0.35 0.4 atm σ=0p65 σ=0p86 σ=1p07 σ=1p26 σ=1p65 σ=2p07 σ=3p08 σ=4p56 -* oVariation of Thrust Coefficients Under Cavitation
Variation of Cavitation Condition
Pusher Propeller with 15° Hub Angle
Figure 4-5. KT of the propeller, Push+15° at different σn. TW=19.5° (±0.5°); α/αs=0.2~0.35.
-* * * * * * * * * * * * * * * o o o o o o o o o o o o o o o o
Advance Coefficient, J
T
o
rq
u
e
C
o
effi
ci
en
t,
1
0
K
Q 0.3 0.4 0.5 0.6 0.7 0.8 0.9 1 1.1 0 0.1 0.2 0.3 0.4 0.5 0.6 atm σ=0p65 σ=0p86 σ=1p07 σ=1p26 σ=1p65 σ=2p07 σ=3p08 σ=4p56 -* oVariation of Torque Coefficients Under Cavitation
Variation of Cavitation Condition
Pusher Propeller with 15° Hub Angle
-* * * * * * * * * * * * o o o o o o o o o o o o o o
Advance Coefficient, J
T
h
ru
st
C
o
effi
ci
en
t,
K
T 0.3 0.4 0.5 0.6 0.7 0.8 0.9 1 1.1 0 0.05 0.1 0.15 0.2 0.25 0.3 0.35 0.4 atm σ=0p65 σ=0p86 σ=1p07 σ=1p26 σ=1p65 σ=2p07 σ=3p08 σ=4p56 -* oVariation of Thrust Coefficients Under Cavitation
Variation of Cavitation Condition
Pusher Propeller with 20° Hub Angle
Figure 4-7. KT of the propeller, Push+20° at different σn. TW=19.5° (±0.5°); α/αs=0.2~0.35.
-* * * * * * * * * * * * o o o o o o o o o o o o o o
Advance Coefficient, J
T
o
rq
u
e
C
o
effi
ci
en
t,
1
0
K
Q 0.3 0.4 0.5 0.6 0.7 0.8 0.9 1 1.1 0 0.1 0.2 0.3 0.4 0.5 0.6 atm σ=0p65 σ=0p86 σ=1p07 σ=1p26 σ=1p65 σ=2p07 σ=3p08 σ=4p56 -* oVariation of Torque Coefficients Under Cavitation
Variation of Cavitation Condition
Pusher Propeller with 20° Hub Angle
-* * * * * * * * * * * * * o o o o o o o o o o o o o o
Advance Coefficient, J
T
h
ru
st
C
o
effi
ci
en
t,
K
T 0.3 0.4 0.5 0.6 0.7 0.8 0.9 1 1.1 0 0.05 0.1 0.15 0.2 0.25 0.3 0.35 0.4 atm σ=0p65 σ=0p86 σ=1p07 σ=1p26 σ=1p65 σ=2p07 σ=3p08 σ=4p56 -* oVariation of Thrust Coefficients Under Cavitation
Variation of Cavitation Condition
Puller Propeller with 15° Hub Angle
Figure 4-9. KT of the propeller, Pull-15° at different σn. TW=19.5° (±0.5°); α/αs=0.2~0.35.
-* * * * * * * * * * * * * o o o o o o o o o o o o o o
Advance Coefficient, J
T
o
rq
u
e
C
o
effi
ci
en
t,
1
0
K
Q 0.3 0.4 0.5 0.6 0.7 0.8 0.9 1 1.1 0 0.1 0.2 0.3 0.4 0.5 0.6 atm σ=0p65 σ=0p86 σ=1p07 σ=1p26 σ=1p65 σ=2p07 σ=3p08 σ=4p56 -* oVariation of Torque Coefficients Under Cavitation
Variation of Cavitation Condition
Puller Propeller with 15° Hub Angle
-* * * * * * * * * * * * * o o o o o o o o o o o o o o o
Advance Coefficient, J
T
h
ru
st
C
o
effi
ci
en
t,
K
T 0.3 0.4 0.5 0.6 0.7 0.8 0.9 1 1.1 0 0.05 0.1 0.15 0.2 0.25 0.3 0.35 0.4 atm σ=0p65 σ=0p86 σ=1p07 σ=1p26 σ=1p65 σ=2p07 σ=3p08 σ=4p56 -* oVariation of Thrust Coefficients Under Cavitation
Variation of Cavitation Condition
Puller Propeller with 20° Hub Angle
Figure 4-11. KT of the propeller, Pull-20° at different σn. TW=19.5° (±0.5°); α/αs=0.2~0.35.
-* * * * * * * * * * * * * o o o o o o o o o o o o o o o o o
Advance Coefficient, J
T
o
rq
u
e
C
o
effi
ci
en
t,
1
0
K
Q 0.3 0.4 0.5 0.6 0.7 0.8 0.9 1 1.1 0 0.1 0.2 0.3 0.4 0.5 0.6 atm σ=0p65 σ=0p86 σ=1p07 σ=1p26 σ=1p65 σ=2p07 σ=3p08 σ=4p56 -* oVariation of Torque Coefficients Under Cavitation
Variation of Cavitation Condition
Puller Propeller with 20° Hub Angle
4-2. Reynolds Number Effects:
For the prediction of the performance of a full-scale propeller based on model performance, it is very important that the tests reduce Reynolds Number effects to minimum. The tests conduced at high Reynolds Number (over 1 million) ensure that any adverse effect of laminar flow (dynamic stall of the blades) over the propellers is avoided. The Reynolds Number,
R 7 . 0
Re for the model propellers is calculated, based on ITTC recommendation in the following:
(
)
ν π 2 2 7 . 0 7 . 0 7 . 0 Re R A R V nD c + = (4.1) where, c0.7Ris the local chordlength at 0.7R. R is the radius of the propeller, VA is thepropeller advance speed, ν is the kinematic viscosity of fluid, which is a function of temperature. The tests were carried out at the following three rotational speeds having Reynolds Numbers greater than the ITTC recommended critical value of 1 million (Jessup et al. 2002).
Table 4-3. Calculation of Reynolds Number for three different propeller rps.
D D c0.7R/ (m) VA m/s n rps ν (m2/s) Re0.7R 0.27 0.4622 2.50 15 1.04E-06 1.11E+06 0.27 0.4622 3.00 15 1.04E-06 1.13E+06 0.27 0.4622 3.50 15 1.04E-06 1.15E+06 0.27 0.4622 4.00 15 1.04E-06 1.17E+06 0.27 0.4622 4.50 15 1.04E-06 1.20E+06 0.27 0.4622 5.00 15 1.04E-06 1.23E+06 0.27 0.4622 5.50 15 1.04E-06 1.26E+06 0.27 0.4622 6.00 15 1.04E-06 1.29E+06 0.27 0.4622 6.50 15 1.04E-06 1.32E+06 0.27 0.4622 7.00 15 1.04E-06 1.36E+06 0.27 0.4622 7.50 15 1.04E-06 1.40E+06 0.27 0.4622 8.00 15 1.04E-06 1.44E+06 0.27 0.4622 2.50 20 1.04E-06 1.46E+06 0.27 0.4622 3.00 20 1.04E-06 1.47E+06 0.27 0.4622 3.50 20 1.04E-06 1.49E+06 0.27 0.4622 4.00 20 1.04E-06 1.50E+06 0.27 0.4622 4.50 20 1.04E-06 1.52E+06 0.27 0.4622 5.00 20 1.04E-06 1.55E+06 0.27 0.4622 5.50 20 1.04E-06 1.57E+06 0.27 0.4622 6.00 20 1.04E-06 1.60E+06 0.27 0.4622 6.50 20 1.04E-06 1.62E+06 0.27 0.4622 7.00 20 1.04E-06 1.65E+06 0.27 0.4622 7.50 20 1.04E-06 1.69E+06
0.27 0.4622 8.00 20 1.04E-06 1.72E+06 0.27 0.4622 2.50 25 1.04E-06 1.81E+06 0.27 0.4622 3.00 25 1.04E-06 1.82E+06 0.27 0.4622 3.50 25 1.04E-06 1.83E+06 0.27 0.4622 4.00 25 1.04E-06 1.84E+06 0.27 0.4622 4.50 25 1.04E-06 1.86E+06 0.27 0.4622 5.00 25 1.04E-06 1.88E+06 0.27 0.4622 5.50 25 1.04E-06 1.90E+06 0.27 0.4622 6.00 25 1.04E-06 1.92E+06 0.27 0.4622 6.50 25 1.04E-06 1.94E+06 0.27 0.4622 7.00 25 1.04E-06 1.97E+06 0.27 0.4622 7.50 25 1.04E-06 2.00E+06 0.27 0.4622 8.00 25 1.04E-06 2.02E+06
The basic performance tests under cavitating conditions for the four propellers were done at shaft speeds of 25 rps, which corresponds to a Reynolds Number of 2.018×10⁶. This high propeller rotational speed was selected in order to get low cavitation number (see equation 3-1). Several additional tests were conduced at the design cavitation number (σdesign=3.0) to
study the Reynolds Number effects, if any. The experimental Reynolds Number was changed by changing the propeller rotational speeds. Tests were done at shaft speeds of 15 rps and 20 rps and the measured performance was compared to the 25 rps tests at the design cavitation number. The results are presented in Figures 4-13 to 4-16.
In the Figures 4-13 to 4-16, it is observed that for all the four propellers the measured performance at the design cavitation number (σdesign=3.0) at 20 rps were almost the same as
that of the 25 rps (the efficiencies were within 3%), while very narrow difference in performance are seen between that of 20 rps and 15 rps (the efficiencies were within 10%). This indicated that Reynolds Number effects were very limited and could be neglected when the propeller operation speed exceed 20 rps. The model propellers were big enough (270 mm diameter) to avoid any Reynolds Number effect (similar flow condition over the surface of the blades between the model scale and the full scale) when they were operating at 20 rps or higher.
Advance Coefficient, J
K
T,1
0
K
Qan
d
η
0.3 0.4 0.5 0.6 0.7 0.8 0.9 1 1.1 1.2 0 0.1 0.2 0.3 0.4 0.5 0.6 0.7 0.8 KT_15 rps 10KQ_15 rps η_15 rps KT_20 rps 10KQ_20 rps η_20 rps KT_25 rps 10KQ_25 rps η_25 rpsReynolds Number Effects on Propulsive Performance
at 15, 20 and 25 rps
Pusher Propellers with 15° Hub Angle
Figure 4-13. Performance of the propeller, Push+15° at σdesign=3.0, at three different Reynolds
Numbers (three different rps, 15, 20, 25). TW=19.5° (±1); α/αs=0.2~0.35.
Advance Coefficient, J
K
T,1
0
K
Qan
d
η
0.3 0.4 0.5 0.6 0.7 0.8 0.9 1 1.1 1.2 0 0.1 0.2 0.3 0.4 0.5 0.6 0.7 0.8 KT_15 rps 10KQ_15 rps η_15 rps KT_20 rps 10KQ_20 rps η_20 rps KT_25 rps 10KQ_25 rps η_25 rpsReynolds Number Effects on Propulsive Performance
at 15, 20 and 25 rps
Pusher Propellers with 20° Hub Angle
Figure 4-14. Performance of the propeller, Push+20° at σdesign=3.0, at three different Reynolds
Advance Coefficient, J
K
T,1
0
K
Qan
d
η
0.3 0.4 0.5 0.6 0.7 0.8 0.9 1 1.1 1.2 0 0.1 0.2 0.3 0.4 0.5 0.6 0.7 0.8 KT_15 rps 10KQ_15 rps η_15 rps KT_20 rps 10KQ_20 rps η_20 rps KT_25 rps 10KQ_25 rps η_25 rpsReynolds Number Effects on Propulsive Performance
at 15, 20 and 25 rps
Puller Propellers with 15° Hub Angle
Figure 4-15. Performance of the propeller, Pull-15° at σdesign=3.0, at three different Reynolds
Numbers (three different rps, 15, 20, 25). TW=19.5° (±1); α/αs=0.2~0.35.
Advance Coefficient, J
K
T,1
0
K
Qan
d
η
0.3 0.4 0.5 0.6 0.7 0.8 0.9 1 1.1 1.2 0 0.1 0.2 0.3 0.4 0.5 0.6 0.7 0.8 KT_15 rps 10KQ_15 rps η_15 rps KT_20 rps 10KQ_20 rps η_20 rps KT_25 rps 10KQ_25 rps η_25 rpsReynolds Number Effects on Propulsive Performance
at 15, 20 and 25 rps
Puller Propellers with 20° Hub Angle
Figure 4-16. Performance of the propeller, Pull-20° at σdesign=3.0, at three different Reynolds
4-3. Hub Taper Angle Effects on Performance
The effect of hub taper angle on propulsive performance under cavitation can be studied by analyzing the results in terms of KT, KQ and J for different cavitation number, αn. Comparison
of performance of two propellers with 15° and 20° hub taper angles in either pusher or puller configuration reveals the effect of hub taper angle on performance. Figures 4-17(a) to 4-17(h) provide comparisons between the propellers Push+15° and Push+20° and Figures 4-18(a) to 4-18(h) provide comparisons between the propellers Pull-15° and Pull-20°.
Comparison between the push+15 and Push+20 propellers (Figures 4-17(a) to 4-17(h)) show that, increasing the hub taper angle increased the torque, and this effect increased with advance coefficient. For thrust, increasing the taper angle also increased the thrust but not with the same magnitude as torque coefficient and the increase is more obvious at higher advance coefficient. The net effect on the propeller efficiency was that the efficiency decreased for larger hub angles and the effect was more pronounced for higher advance coefficient. The similar effects were observed for all the cavitation conditions except at low cavitation number (αn>=1.0) where the comparison was not very obvious. This inconsistency in data might result from the unusual tunnel behavior (too much noise and vibration from the tunnel) in the operating condition.
Comparison between the pull-15 and Pull-20 propellers (Figures 4-18(a) to 4-18(h)) show that, increasing the hub taper angle increased the torque, and this effect increased with increasing advance coefficient. For thrust, increasing the taper angle also increased the thrust but not with the same magnitude as torque coefficient and the increase is more obvious at lower advance coefficient. The net effect on the propeller efficiency was that the efficiency decreased for larger hub angles and the difference in efficiency got larger with increasing advance coefficient. The similar effects were observed for all the cavitation conditions except at low cavitation number (αn>=1.0) where the comparison was not very obvious. This inconsistency in data might result from the unusual tunnel behavior (too much noise and vibration from the tunnel) in the operating condition.
Advance Coefficient, J KT ,1 0 KQ an d η 0.550 0.575 0.6 0.625 0.65 0.675 0.7 0.1 0.2 0.3 0.4 0.5 0.6 KT_Push15 10KQ_Push15 η_Push15 KT_Push20 10KQ_Push20 η_Push20
Variation of Propulsive Performance With Hub Angle
Cavitation Number,σ=0.65
Pusher Propellers with 15° and 20° Hub Angles
Figure 4-17 (a). Comparison of KT and KQ of the Push+15°
and the push+20° propellers at σ=0.65.
Advance Coefficient, J KT ,1 0 KQ an d η 0.5 0.525 0.55 0.575 0.6 0.625 0.65 0.675 0.7 0 0.1 0.2 0.3 0.4 0.5 0.6 KT_Pull20 10KQ_Pull20 η_Pull20 KT_Pull15 10KQ_Pull15 η_Pull15
Variation of Propulsive Performance With Hub Angle
Cavitation Number,σ=0.65
Puller Propellers with 15° and 20° Hub Angles
Figure 4-18 (a). Comparison of KT and KQ of the Pull-15°
and the pull-20° propellers at σ=0.65.
Advance Coefficient, J KT ,1 0 KQ an d η 0.5 0.6 0.7 0.8 0.9 0 0.1 0.2 0.3 0.4 0.5 0.6 0.7 KT_Push15 10KQ_Push15 η_Push15 KT_Push20 10KQ_Push20 η_Push20
Variation of Propulsive Performance With Hub Angle
Cavitation Number,σ=0.86
Pusher Propellers with 15° and 20° Hub Angles
Figure 4-17 (b). Comparison of KT and KQ of the Push+15°
and the push+20° propellers at σ=0.86.
Advance Coefficient, J KT ,1 0 KQ an d η 0.4 0.5 0.6 0.7 0.8 0.9 0 0.1 0.2 0.3 0.4 0.5 0.6 0.7 KT_Pull20 10KQ_Pull20 η_Pull20 KT_Pull15 10KQ_Pull15 η_Pull15
Variation of Propulsive Performance With Hub Angle
Cavitation Number,σ=0.86
Puller Propellers with 15° and 20° Hub Angles
Figure 4-18 (b). Comparison of KT and KQ of the Pull-15°
and the pull-20° propellers at σ=0.86.
Advance Coefficient, J KT ,1 0 KQ an d η 0.6 0.7 0.8 0.9 0 0.1 0.2 0.3 0.4 0.5 0.6 0.7 KT_Push15 10KQ_Push15 η_Push15 KT_Push20 10KQ_Push20 η_Push20
Variation of Propulsive Performance With Hub Angle
Cavitation Number,σ=1.07
Pusher Propellers with 15° and 20° Hub Angles
Figure 4-17 (c). Comparison of KT and KQ of the Push+15°
and the push+20° propellers at σ=1.07.
Advance Coefficient, J KT ,1 0 KQ an d η 0.4 0.5 0.6 0.7 0.8 0.9 1 0 0.1 0.2 0.3 0.4 0.5 0.6 0.7 0.8 KT_Pull20 10KQ_Pull20 η_Pull20 KT_Pull15 10KQ_Pull15 η_Pull15
Variation of Propulsive Performance With Hub Angle
Cavitation Number,σ=1.07
Pusher Propellers with 15° and 20° Hub Angles
Figure 4-18 (c). Comparison of KT and KQ of the Pull-15°