Automotive Features: Mass Impact and
Deployment Characterization
by
Stephen M. Zoepf
B.S. Electrical Engineering, Massachusetts Institute of Technology,
2001
Submitted to the Engineering Systems Division
in partial fulfillment of the requirements for the degree of
Master of Science in Technology and Policy
at the
MASSACHUSETTS INSTITUTE OF TECHNOLOGY
June 2011
c
Massachusetts Institute of Technology 2011. All rights reserved.
Author . . . .
Engineering Systems Division
May 13, 2011
Certified by . . . .
Professor John B. Heywood
Professor of Mechanical Engineering
Sun Jae Professor, Emeritus
Thesis Supervisor
Accepted by . . . .
Professor Dava J. Newman
Professor of Aeronautics and Astronautics and Engineering Systems
Director, Technology and Policy Program
Automotive Features: Mass Impact and Deployment
Characterization
by
Stephen M. Zoepf
Submitted to the Engineering Systems Division on May 13, 2011, in partial fulfillment of the
requirements for the degree of
Master of Science in Technology and Policy
Abstract
Passenger car use is a major driver of greenhouse gas (GHG) emissions and fossil fuel consumption in the United States. Vehicles continue to incorporate increasing levels of technology, these advances do not translate directly into improved fuel economy. Vehicle weight, interior volume and performance have all grown substantially in the past 30 years, as has feature content.
This thesis shows that safety features, emissions controls, and optional equipment account for a total mass that mirrors growth in vehicle mass during this time pe-riod. Chief among these are optional features designed to improve the comfort and convenience of passenger cars.
This thesis also examines historical deployment rates of vehicle features. Safety features and emissions controls achieve faster deployment rates than other optional features. While these features are those most governed by regulation, it is not clear that regulations push technology deployment rates higher. Automotive product de-velopment is complex and features require significant time to overcome deployment constraints. This lag time, from first production use to most rapid deployment across the vehicle fleet, is found to be exponentially decreasing for all feature types and has dropped to approximately a decade.
These analyses provide two countering assessments. New vehicles will continue to grow heavier due to the continued incorporation of new features, but technology that may improve overall efficiency can be brought to market ever faster.
Thesis Supervisor: Professor John B. Heywood Title: Professor of Mechanical Engineering Sun Jae Professor, Emeritus
Acknowledgments
This thesis would not have been possible without the help and support of many people from the MIT community and beyond.
First and foremost I would like to offer my sincere thanks to Prof. John Heywood for his guidance and support these past two years as my advisor. I am humbled by his immense knowledge, talent and kindness.
I would like to thank my fellow students from the Sloan Automotive Laboratory: Don MacKenzie, Fernando de Sisternes, Lynette Cheah, Valerie Karplus, David Keith, Irene Berry, Eriko Nishimura and Mike Khusid. My work has built upon much of their own and has been improved greatly by their feedback. Many thanks also to Prof. Randy Kirchain, Rich Roth and Elisa Alonso from the Materials Systems Laboratory for their contributions.
I would also like to thank the staff of the U.S. Department of Transportation and the Volpe Center for their information and feedback.
The faculty and staff of the Engineering Systems Division and the Technology and Policy Program have been a great help at every step. It has been a pleasure to learn from their vast experience these past two years.
Finally, I would like to thank my wife, Irma, for her unwavering support and encouragement. She is a pillar of strength and I am forever indebted for the sacrifices she has made in accompanying me to graduate school.
This work has been sponsored by Ford Motor Company and the MIT Portugal Program.
Contents
1 Introduction 15
1.1 Vehicle Evolution . . . 17
1.2 Motivation . . . 18
1.3 Research Objectives . . . 19
1.4 Methodology and Comments . . . 21
1.4.1 Data Sources . . . 21 1.4.2 Limitations . . . 22 2 Vehicle Features 25 2.1 Definitions . . . 25 2.2 Context . . . 26 2.3 Safety Features . . . 27 2.4 Emissions Controls . . . 29 2.5 Optional Features . . . 32 2.6 Secondary Mass . . . 34 2.7 Conclusions . . . 36
3 Measuring Technological Sophistication 39 3.1 BMEP . . . 40
3.2 PSFI . . . 40
3.3 Adjusted PSFI . . . 42
4 Deployment Rates of Vehicle Technology 47
4.1 Common Models of Diffusion/Deployment . . . 49
4.2 Applying Regression . . . 49
4.3 Prior Work . . . 50
4.4 Important Characteristics and Secondary Regression . . . 51
4.4.1 Maximum Take Rate . . . 51
4.4.2 Maximum Growth Rate . . . 54
4.4.3 Developmental Lag Time . . . 57
4.5 Alternative Methodology: Z-Curves and Logistic Approximation . . . 59
4.6 Differences Among Manufacturers . . . 62
4.6.1 Manufactuer-Specific Action and Fleet Impact . . . 62
4.6.2 Strategies Within Manufacturers . . . 65
4.7 Supply Side Constraints on Deployment . . . 66
4.8 Impact of Regulation . . . 67
4.8.1 Frontal Air Bags . . . 70
4.8.2 Anti-lock Brakes . . . 71
4.8.3 Multiple valves and Variable Valve Timing . . . 72
4.9 Conclusions . . . 73
5 Findings, Applications and Conclusions 75 5.1 Vehicle Mass Findings . . . 75
5.2 Feature Deployment Findings . . . 76
5.3 Applications for Policy and Vehicle Fleet Models . . . 77
5.4 Other Considerations . . . 80
5.4.1 Alternative Fuels and Parallel Innovation . . . 80
5.4.2 Disruptive Innovation . . . 81
5.5 Extensions . . . 82
A Tables 85
C Safety Features: Take Rates and Regression 91 D Powertrain Features: Take Rates and Regression 93 E Comfort and Convenience Features: Take Rates and Regression 95
F Other: Features with Limited Data 99
List of Figures
1-1 Average performance, size and fuel economy of new U.S. cars, 1977-2008, indexed to 1977 averages. Graphic from MacKenzie, 2009 using data from U.S. EPA, 2008 . . . 18 1-2 Growth in mass of vehicles from four major classes from [Glennan, 2007] 20 2-1 The average mass of passenger cars in the United States has climbed
since the mid-1980s. Source: [EPA, 2010] . . . 26 2-2 Average mass added by safety regulations from 1968-2001 as reported
by U.S. DOT in report HS 809 834. . . 28 2-3 Estimated mass of emissions control equipment by year. . . 31 2-4 Mass and take rate of ten features with highest fleetwide impact. Lines
of isometric fleet impact at levels of 20, 10, 5 and 3 kg/car are also shown. . . 34 2-5 Estimated mass impact of optional features by year. Dashed lines show
projected future impact using fits of existing take rate data, while solid line is a linear fit of historic data. . . 35 2-6 Mass of passenger cars 1975-2010 and weight attributed to Safety,
Emissions and Comfort/Convenience features (Secondary mass included). 36 3-1 Trends in BMEP for U.S. engines from 2000 - 2008 [Heywood and Welling, 2009] 41 3-2 Performance Size Fuel Economy Index, 1975 - 2005 from [An and DeCicco, 2007].
This metric of vehicle sophistication has grown with remarkable linear-ity since 1975. . . 42 3-3 Traditional PSFI vs. Adjusted PSFI growth from 1977 - 2010. . . 44
4-1 Functional form of the diffusion of innovations as envisioned by [Rogers, 2003] 48 4-2 Functional form of the Bass diffusion model as envisioned by [Sterman, 2000] 49
4-3 Important characteristics of a logistic function. . . 52
4-4 Technology supersession in fuel injection and engine management as envisioned by [Amey, 1995] . . . 53
4-5 Histrogram of maximum feature growth rates. . . 55
4-6 Histogram of maximum feature growth rate by category. . . 56
4-7 Historical phase-in time of all features. . . 58
4-8 Historical decrease in phase-in time of features by category. . . 59
4-9 Product variety and model changes by region, adapter from [Clark and Fujimoto, 1991]. 60 4-10 Stages of deployment of new vehicle technology. Image from [Bandivadekar, 2008], adapter from [Schafer et al., 2006] . . . 61
4-11 Differences among automotive manufacturers in phase-in of fuel injection. 63 4-12 Differences among automotive manufacturers in phase-in of multivalve engines. . . 64
4-13 Differences among automotive manufacturers in phase-in of variable valve timing. . . 65
4-14 Differences in maximum growth rates between regulated and non-regulated features. . . 68
4-15 Maximum growth rate vs. number of passenger cars equipped at time regulation is announced. . . 70
List of Acronyms and Common Terms
ABS Anti-lock Brakes
BAU Business As Usual, a term used to describe a modeling scenario where present conditions are presumed to carry forward unchanged.
BEV Battery Electric Vehicle
BMEP Brake Mean Effective Pressure
CAFE Corporate Average Fuel Economy, the sales-weighted average fuel economy of the vehicles produced by a manufacturer in a given year.
CARB California Air Resources Board
Criteria Pollutant Six common air pollutants regulated by the U.S. EPA: Ozone, Particulate Matter, Carbon Monoxide, Nitrogen Oxides, Sulfur Dioxide and Lead.
DOT U.S. Department of Transportation EIA Energy Information Administration EISA Energy Independence and Security Act EPA U.S. Environmental Protection Agency EPCA Energy Policy Conservation Act
ERFC Emphasis on Reduction of Fuel Consumption ESC Electronic Stability Control
Feature Equipment on a vehicle not strictly necessary for basic vehicle functionality but required by law to improve safety or emissions, or optionally added by automakers to improve the comfort, convenience or consumer appeal of a vehicle. FI Fuel Injection
FMVSS Federal Motor Vehicle Safety Standard GHG Greenhouse Gas
ICE Internal Combustion Engine
LDV, Light Duty Vehicle Passenger cars and light trucks with a gross vehicle weight under 8,500 lbs
MPG Miles per gallon
MSRP Manufacturer’s Suggested Retail Price
NHTSA U.S. National Highway Traffic Safety Administration NPRM Notice of Proposed Rulemaking
OEM Original Equipment Manufacturer PHEV Plug-in Hybrid Electric Vehicle PSFI Performance-size-fuel economy index
SI Spark-Ignition, generally referring to gasoline-powered engines SUV Sport Utility Vehicle
Take Rate The percentage of new vehicles or passenger cars equipped with a specific feature in a given year.
VMT, VKT Vehicle Miles Traveled, Vehicle Kilometers Traveled: An expression for the average distance traveled by each vehicle in a given fleet.
Chapter 1
Introduction
Chapter 1
Chapter 1 outlines the importance of transportation in petroleum and GHG contexts, discusses the importance of vehicle features in the evolution of the passenger car, and outlines the themes to be discussed in the remainder of the document.
For nearly a century the automobile has been the dominant form of personal transportation in the United States. The passenger car has made inexpensive, reliable transportation accessible to virtually every citizen and has profoundly affected the development of modern society.
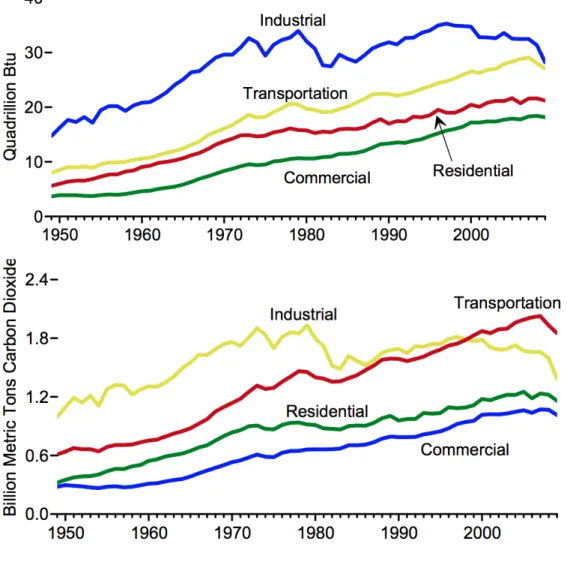
At the same time, transportation has also become a dominant source of greenhouse gas (GHG) emissions and fossil fuel consumption in the United States. As shown in Table 1.1, the Transportation sector represents a growing driver of energy and fossil fuel use. The Transportation sector is now responsible for 71% of petroleum consumption and 34% of GHG emissions. Since 1999 the Transportation sector has exceeded the Industrial sector as the largest emitter of greenhouse gases.[EIA, 2010] The Transportation sector derives 94% of its energy from Petroleum. 45% of this petroleum is used to produce motor gasoline, the vast majority of which is used to fuel Light Duty Vehicles (LDVs). The GHG emissions and fossil fuel consump-tion driven by the Transportaconsump-tion sector have been modeled by numerous groups.
Table 1.1: Data from EIA showing historical energy consumption and GHG emissions by sector.
The fundamental factors driving such consumptions are shown below, adapter from [MIT, 2008].
GHGemissions = LP K ∗ V KT ∗ F I Where,
GHGemissions = Greenhouse Gas Emissions (tons/year) LP K = Liters per Kilometer (L/100km)
V KT = Vehicle Kilometers Traveled (VKT in km/year) F I = GHG intensity of Fuel (GHG tons/liter of fuel)
While there are interactions among these factors, LPK is the only factor here reliant on the technical sophistication of vehicles themselves while FI and LPK are primarily a product of infrastructure and usage.
1.1
Vehicle Evolution
During its development over the past century the passenger car has evolved from a rudimentary, self-propelled ”horseless carriage” to a sophisticated device capable of traveling hundreds of miles at high speeds. All new vehicles sold in the United States incorporate seat belts and at least two airbags; virtually all new vehicles include air conditioning and automatic transmissions to increase driver comfort and many also include navigation systems, moonroofs, and a bevy of other electronic aids.
Gains in performance, size and fuel economy are relatively straightforward to analyze, as these factors have been carefully tracked since 1975 in the EPA Fuel Economy trends report. As shown in Figure 1-1 below fuel economy grew rapidly from approximately 1977-1987 and has since remained relatively constant. Vehicle performance has continually increased since the mid-1980s and vehicle size, measured using interior volume, has also grown modestly over the same time period.
However, vehicle capability has improved in other ways as well. Vehicles are safer, emit fewer criteria pollutants per mile traveled, and include a broad array of equipment designed to improve dynamic capabilities provide the driver with a high level of comfort and information.
[Cheah, 2010] highlights the importance of vehicle features by comparing two ve-hicles: a 2008 Audi A4 and a 2006 Mazda3 Touring, as shown in Table 1.2. The two vehicles are nearly identical in performance, interior space, exterior dimensions and highway fuel economy. However, the Audi has a significantly longer list of standard equipment, performs better in several crash tests, is 50% more expensive and weighs 345 kg more than the Mazda. Cheah attributes the mass increase primarily to the higher feature content of the Audi. However, this is only a single data point: a closer examination is needed to address the fleet-wide impact of features on the mass of
Figure 1-1: Average performance, size and fuel economy of new U.S. cars, 1977-2008, indexed to 1977 averages. Graphic from MacKenzie, 2009 using data from U.S. EPA, 2008
vehicles.
Figure 1-2 graphically illustrates four case studies of growth in the mass of vehicles of various classes.
1.2
Motivation
Existing work by [An and DeCicco, 2007, MacKenzie, 2009, Knittel, 2009] has in-vestigated the tradeoffs among performance, size and fuel economy and consumer willingness to pay for said attributes. However, as shown by Cheah in the previous section, vehicles similar in these common metrics may still be substantially differ-ent in their ability to deliver functionality to the purchaser in the form of additional features. The need to quantify this tradeoff dimension has, to date, remained unfilled. Performing an analysis of vehicle features pays dividends in other ways. While features such as fuel injection, multiple valves per cylinder and variable valve timing
Table 1.2: Audi A4 vs. Mazda3: A comparison of vehicles with similar primary attributes but very different features. Adapted from [Cheah, 2010].
Year, Model 2008 Audi A4 2.0T Quattro 2006 Mazda3 s Touring
Body style 4-dr sedan (seats 5) 4-dr sedan (seats 5) Wheelbase 104.3 in 103.9 in
length x width x height 180.6 x 69.8 x 56.2 in3 178.7 x 69.1 x 57.7 in3 Overall volume (l*w*h) 11.61 m3 11.68 m3
Horsepower 200 hp 160 hp Power-to-weight ratio 0.057 hp/lb 0.058 hp/lb 0-60mph (est.) 9.58 sec 9.59 sec Engine displacement 2.0L I4 2.3L I4
Front head, leg room 37.9 in, 41.3 in 39.1 in, 41.9 in Luggage capacity 13.4 f t3 11.4f t3
City/hwy (adj.) fuel econ-omy
22/31 MPG 26/32 MPG Features 16“ wheels, AWD, power seat
ad-justment, sunroof, heated mirrors, dual zone climate controls, 10 speak-ers + subwoofer, traction and stabil-ity control
17“ wheels, FWD, manual seat adjustment, sunroof op-tional
NHTSA crash test ratings driver, passenger, side im-pact front, rear, rollover
4, 4, 5, 4, 4 stars 4, 4, 3, 3, 4 stars MSRP $28,900 $17,600
Curb weight 1,595 kg (3,516 lb) 1,251 kg (2,758 lb)
(VVT) are tracked by the U.S. EPA, the deployment rates of these features are not strictly the product of consumer demand and automaker ability to deploy such technology. To varying degrees each of these technologies has been driven by criteria pollutant regulations. Because of this, viewing the deployment of such features in the broader context of safety regulation-driven and optional features serves to better characterize deployment of technology in the automotive fleet.
1.3
Research Objectives
This thesis serves to address the following primary research questions described below. Mass Impact What has been the impact of safety and emissions requirements and
Figure 1-2: Growth in mass of vehicles from four major classes from [Glennan, 2007] other optional features on the mass of automobiles in the United States?
Trends in Features What is the trend in deployment of features in each of these areas?
Technical Sophistication How can information about vehicle features be used to refine existing measures of technical sophistication?
Deployment Scenarios What do past trends in feature deployment rates tell us about possible future deployment of vehicle features?
1.4
Methodology and Comments
This thesis is composed of two distinct analyses. Chapter 2 combines estimated deployment data of vehicle features of three categories (safety equipment, emissions controls, and optional features) and estimated mass of each feature to calculate the total mass added to an average passenger car as a result of this equipment.
Chapter 4 analyses the characteristics of the deployment of vehicle features for which time series deployment data is available and identifies key parameters in the historical deployment of approximately 35 unique vehicle features at fleet-wide and manufacturer levels.
1.4.1
Data Sources
Estimates of mass impact of legally mandated safety features are drawn directly from analysis performed by NHTSA in DOT HS 809 834.[DOT, 2004a]. This study addresses both the deployment rate of specific features and their weight contribution year-over-year. Learning effects are addressed: vehicles from a range of dates are torn down and the mass contribution from each NHTSA regulation is individually addressed.
Specific equipment required for emissions controls from 1970 - 1990 has been interpreted from a timeline of EPA regulations [EPA, 2011]. The mass contributions from each of the regulations during this period are drawn from vehicle teardown data discussed below.
Take rates of some optional features is drawn from Wards Factory Installed databases. [Ward’s, 2010b, Ward’s, 2010a]. Of the 74 optional features analyzed, 34 of these fea-tures had historical take rate data available. Where option take rates are unavailable, yearly take rates have been estimated based on feature introduction dates and avail-ability on top-selling 2010 vehicles as discussed in Chapter 2. Of the forty features estimated using this linear method, half resulted in estimated take rates of less than 10% and with a minimal mass impact.
indi-vidual vehicle components attributed to the application of a specific feature. Confi-dential component-level teardown data, including mass, is provided by an unnamed OEM for four individual passenger cars (two compact and two full-sized). For twenty-five of these features, mass was calculated as an average value of the applicable equip-ment from these four vehicles. Where mass data for individual features is unavailable, an estimated value has been used. Of the features where estimated mass was used, twenty-four were on features with estimated take rates of less than 10% with minimal overall impact.
1.4.2
Limitations
Over the course of their development many features incorporate improvements that result in their implementation with a reduced mass (i.e. electric power steering vs. hydraulic power steering). [DOT, 2004a] incorporates a learning effect the mass of specific safety features by tearing down two vehicles a specific number of years apart and assumes a linear reduction in mass over the intervening years. All other features are assumed to have a constant mass over time. This assumption is the result of limitations on data availability. Vehicle teardown data for every year is not available, so component mass values from 2010 vehicles have been used to determine feature weights.
Since the teardown data used for the purposes of this analysis is at a component level, only components that can be directly attributed to a specific feature are in-cluded. For example, weight values used for power seats include only the switches, motors and harnesses identified separately in the data set. Gearboxes or other struc-tural changes to the seats in order to accommodate power assistance are not included. Because not all components of every system are composed of individually identifiable parts, the mass values for optional features calculated by this analysis could rea-sonably be called a lower bound of the possible range of masses of a given optional feature. This is distinct from the concept of secondary mass, discussed in Chapter 2, which refers to mass resulting from reinforcing other systems to maintain vehicle performance.
While light trucks represent an increasingly large share of new vehicle sales (40% in 2009), the use and makeup of the light truck fleet has changed dramatically. Light trucks, originally envisioned primarily as work vehicles, now include SUVs and crossover vehicles that have replaced passenger cars in private use. Since it would not be practical to isolate demographic groups among light truck purchasers, the analysis performed in this document focuses strictly on passenger cars and does not include information on light trucks.
Chapter 2
Vehicle Features
Chapter 2
Chapter 2 dissects the increasing presence of features into those im-proving safety, reducing emissions, and those offering luxury amenities. This chapter further quantifies the resultant mass increase in the pas-senger car fleet and proposes estimates of how fleet fuel consumption might change in the absence of these features.
2.1
Definitions
For the purposes of this thesis, a feature is defined as any component that is not strictly necessary for the basic functionality of the vehicle but that is either required by legal mandate or advertised as providing a benefit to the consumer.
In this section features are categorized as Safety, Emissions, or Optional. Safety and Emissions equipment are strictly required components as defined by respective governing agencies. Components with driver and passenger safety implications that are not currently mandated, such as rollover airbags and park distance control are classified as optional equipment for the purposes of mass impact, but are classified as safety features in Chapter 4. Table 2.1 identifies how features have been classified for the purposes of this analysis.1
Table 2.1: Examples of feature categorization.
Optional Features Safety Emissions Automatic Transmission Power Brakes Catalytic Converters
Power Steering Frontal Airbags Evaporative Emissions Controls Int. Wiper / Washers Child Seat Anchors EGR valves
Air conditioning Side Door Beams Fuel injection
2.2
Context
Following a decline in the late seventies and early eighties, the average mass of pas-senger cars in the United States has climbed steadily as shown in Figure 2-1. While some of this mass increase is attributable to a modest growth in interior volume over the same time period, a large portion of this growth in mass is the result of features that improve the safety, emissions, and comfort/convenience of modern vehicles.
Figure 2-1: The average mass of passenger cars in the United States has climbed since the mid-1980s. Source: [EPA, 2010]
This chapter proposes a framework for estimating the mass increase in modern
However, both of these features will soon become required safety features. Anti-lock brakes, a component of most Electronic Stability Control systems, are being phased in from 2009-2012 in compliance with FMVSS 126. Proposed legislation requiring curtain airbags under FMVSS 208 was issued during the writing of this document and is yet to be finalized.
vehicles that is the result of comfort/convenience features and also identifies estimates of mass attributable to regulations governing safety and emissions. Secondary mass estimates (defined in Section 2.6) are applied and the results of these estimates are summed to produce overall mass impact of features.
These calculations serve two primary purposes. First, using these estimates of feature mass we can estimate what the mass of current production vehicles might be without the presence of these additional features. Second, since the feature content of vehicles continues to grow, we can extrapolate trends in vehicle equipment to predict the mass of features in future vehicles.
2.3
Safety Features
Modern vehicles incorporate a vast array of technologies to reduce the likelihood of in-juries and fatalities in the event of a crash. Advanced materials strengthen critical ar-eas around vehicle occupants, seat belts reduce the likelihood of ejection, and airbags control occupant deceleration rates. New ways to protect occupants are constantly under development, and the National Highway Transportation Safety Administration (NHTSA) continually reviews available technologies. When it deems appropriate, NHTSA issues a ruling mandating that all vehicle incorporate new technologies.
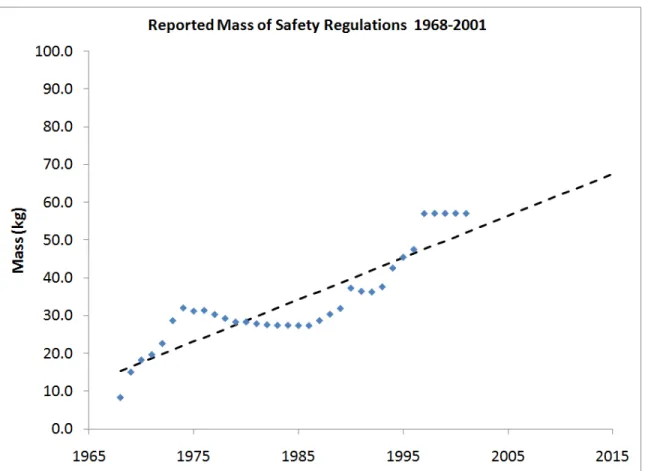
In 2004 NHTSA compiled a report [DOT, 2004a] that quantified the mass added to passenger cars and light trucks as a result of the cumulative impact of safety regulations from 1968-2001. According to this report, 2001 model year passenger cars were, on average, 57 kg (125.44 lbs) heavier as a result of these regulations. While a subsequent report has not been released, a regression of this data suggests that weight attributable to NHTSA regulations has risen to 62 kg (136.4 lbs) in 2010 as shown in Figure 2-2 below and, if current trends are maintained, would exceed 100 kg (220 lbs) by 2050.
This analysis incorporates only features that are explicitly mandated by NHTSA requirements but were not in widespread use prior to regulation. For example, rear window defoggers, although now required, were already in widespread use at the time
Figure 2-2: Average mass added by safety regulations from 1968-2001 as reported by U.S. DOT in report HS 809 834.
the regulation governing them was issued and are not included here.
Other features that have an impact on safety are classified as optional features for the purposes of this analysis. For example, while NHTSA does not specifi-cally track driveway incidents as they occur on private property, [NHTSA, 2011] and [Safe Kids USA, 2011] discuss the large number of children involved in such inci-dents each year. Ultrasonic parking assistance (Park Distance Control) and rearview cameras have the potential to reduce the number of such accidents. Since NHTSA regulations are frequently updated, features such as this may become required equip-ment in the future. In the meantime, however, they are classified as optional.
2.4
Emissions Controls
Since the first Clean Air Act in 1970, the Environmental Protection Agency has in-troduced a series of regulations governing automotive emissions of criteria pollutants. However, the EPA has not published a report that performs a tear-down analysis of the cumulative impact of its legislation comparable to the work published in DOT report HS 809 834.
To simulate the results of a comprehensive teardown report this thesis identifies individual vehicle components attributable to EPA regulations in the Bill of Ma-terials (BOM) of four typical passenger cars and then allocates the average mass to specific regulatory milestones from 1970 - 1990 published by the EPA on its webpage.[EPA, 2011] The allocation of these specific technologies to the milestones was confirmed as plausbile in an interview with an EPA staffperson in 2010. A sum-mary of this analysis is shown in Table 2.2.
Table 2.2: Emissions control legislation with associated components and mass. Date Regulation Components Introduced Estimated
Mass (kg) 1970 Clean Air Act PCV (Positive Crankcase
Ventilation) valves and early evaporative canisters.
1.75 1972 NOx Standards EGR (Exhaust Gas
Recir-culation) Valves
0.42
1975 First generation catalytic
converters
4.17 1981 Amended Clean Air Act 3-way catalytic converters 4.17 1990 Clean Air Act Enhanced evaporative
emis-sions controls and electronic engine management
3.03 1994-1997 Clean Air Act ”Tier I” various
1994 Clean Air Act Amendments On board diagnostics 1994-2003 CARB LEV I various
1999-2003 Transitional NLEV Pro-gram
various 2004-2009 Clean Air Act ”Tier II” various 2004-2010 CARB LEV II various
emis-sions in the United States. Since 1990 the California Air Resource Board (CARB) has introduced a series of regulations under the Low Emissions Vehicle (LEV) pro-gram. Under the Clean Air Act, other states are permitted to adopt either Federal standards or those set by CARB.
Since regulations may now only apply to vehicles sold in certain states, identifying the vehicle mass attributable to exclusively to emissions controls has become far more complex. To further complicate matters, the technologies used to meet these regulations (such as variable valve timing, multiple valves per cylinder, and direct injection) offer other benefits such as improved drivability and performance. From the EPA Tier 2 FRM Regulatory Impact Assessment[EPA, 1999]:
In addition to gains in breathing, the multiple-valve (typically 4-valve) design allows the spark plug to be positioned closer to the center of the combustion chamber (as discussed above) which decreases the distance the flame must travel inside the chamber. In addition, the two streams of incoming gas can be used to achieve greater mixing of air and fuel, further increasing combustion efficiency which lowers engine-out HC emissions. and
Variable valve timing can allow for increased swirl and intake charge velocity, especially during low load operating conditions where sufficient swirl and turbulence tend to be lacking. By providing a strong swirl formation in the combustion chamber, the air-fuel mixture can mix suffi-ciently, resulting in a faster, more complete combustion, even under lean air-fuel conditions, thereby reducing emissions.
.
As a result it is not appropriate to ascribe the mass increase from these technical changes exclusively to emissions regulations.
Since estimating the additional mass of emissions equipment beyond 1990 is quite complex, for the purposes of this analysis a linear regression has been performed on
the mass increases identified from 1970 - 1990 and extrapolated. The resultant mass increase values have been discussed with EPA staff members who agreed the values are plausible.
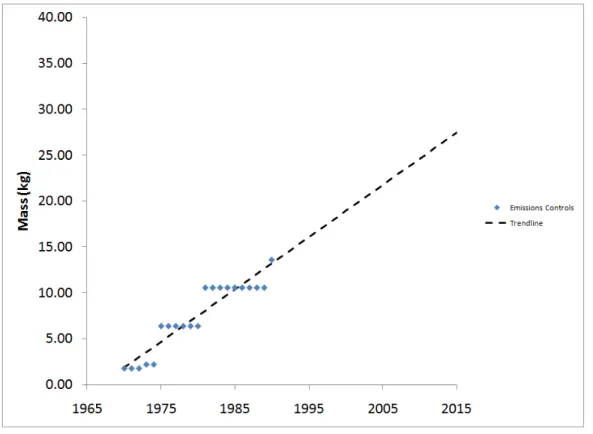
Figure 2-3 shows the calculated mass of emissions equipment from 1970-1990 and the projected trend based on a linear regression of values during this time period. By 1990, approximately 13.6 kg of emissions equipment had been added to the average passenger car. Regression suggests that by 2010 this value has nearly doubled to 24.6 kg per passenger car.
Figure 2-3: Estimated mass of emissions control equipment by year.
It is questionable whether a linear extrapolation of past trends is a reasonable assumption, and it could be argued that the shift from criteria pollutant regulations to GHG emissions regulations could lead to mass reductions through material selection and advanced design in an effort to meet GHG reduction targets. However, it is also possible that GHG reduction requirements will necessity the deployment of BEVs with large battery packs and lead to an increasing mass requirement attributable to
such regulations. In the absence of an alternative, a linear extrapolation has been used.
2.5
Optional Features
Most new cars sold in the U.S. are equipped with a large number of features designed to improve the comfort of passengers or provide additional information to the driver. Air conditioning, automatic transmissions, radios and other features are present in virtually every passenger car sold today, and dozens of other features are equipped at lower rates. A full list of features and their availability on top-selling 2010 passenger cars is shown in Appendix A.
Since not all cars are equipped with all features, the average mass added to each new vehicle on average by n features is determined according to the following equation:
M assf eatures = n
X
i=1
(massi) ∗ (takeratei)
The take rate (the percentage of new cars in a given year equipped with a feature) of many features is tracked by Ward’s Automotive in its Factory Installed equipment databases. [Ward’s, 2010b, Ward’s, 2010a] The data provided by Ward’s Automotive are sales-weighted take rates
For features that are not tracked by Ward’s data, yearly equipment rate is based on the availability of features on top-selling vehicles in early 2010 and the introduction date of the feature as shown in the formula below. This formula assumes strictly linear growth rather than the S-curve shaped growth shown to be typical, but since only two data points are used (date of introduction and take rate in 2010) it is not reasonable to generate an S-curve.
T akerate2010 = .85 ∗ Vstandard+ .25 ∗ Voptional+ .01 ∗ Vunavailable
feature standard, Voptional is the number of top ten selling vehicles that offer said
feature as an option, and Vunavailable is the number of top ten selling vehicles that do
not offer the feature at all.
Table 2.3: An example of vehicle feature availability in 2010. S = feature is standard in all trim levels; O = feature is optional or available on some trim levels; N = feature is not offered on this vehicle.
Feature To y ota Camry T o y ota Corolla Honda Accord Honda Civic Nissan Altima F ord F usion Chevrolet Impala Chevrolet Malibu F ord F o cus T o y ota Prius
Center Console / Armrest S S S O S S S S N S
Since many features are included standard and certain trim levels, a feature is said to be standard only if it is included on all trim levels. Using the example taken from Table 2.3, Vstandard = 8, Voptional = 1 and Vunavailable = 1 for the feature Center
Console/Armrest in 2010. As a result, the take rate for 2010 would be determined to be (8 ∗ .85) + (1 ∗ .25) + (1 ∗ .01) = .68 + .025 + .001 = 71%. The take rates for these features are assumed to grow linearly from the date of their first production, street-legal application.
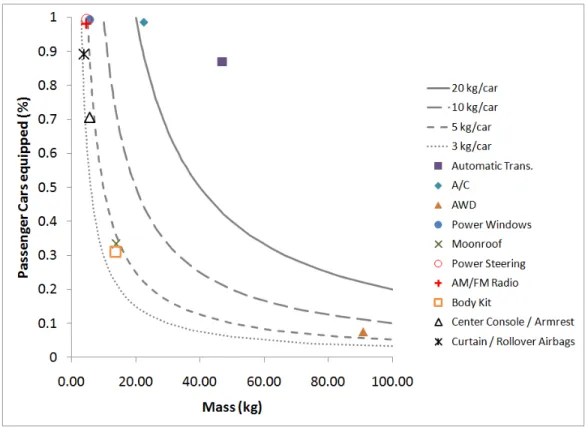
Figure 2-4 shows the distribution in mass and take rates for the ten features with the highest impact in 2010. Relatively only two features (air conditioning and automatic transmission) have an impact of more than 5kg per car in 2010, but a large number of features with varying masses and take rates produce a fleetwide impact of 2-3kg per passenger car.
The cumulative additional mass from comfort and convenience features from 1975 -2010 is shown in Figure 2-5. This analysis suggests that in -2010, the average passenger car was equipped with 136.1 kg in features. Project growth in the take rates of these features suggest that the mass impact would grow to 232.2 kg in 2050. This value includes only project growth in features already known and does not attempt to predict the impact of new features not yet available.
Figure 2-4: Mass and take rate of ten features with highest fleetwide impact. Lines of isometric fleet impact at levels of 20, 10, 5 and 3 kg/car are also shown.
2.6
Secondary Mass
Secondary mass is defined as the mass of additional components and structure nec-essary to support a primary component or system and maintain vehicle performance. For example, the primary mass of a sunroof system is contained in the sunroof cas-sette, drains, wiring harness and electronic modules necessary to operate it. Sec-ondary mass for a sunroof system would be additional structural reinforcement, in-sulation and marginal engine and brake component growth necessary to offset the increased vehicle mass. Secondary mass is usually considered in the context of pos-sible mass reductions but the reverse effect–secondary mass accumulation–is what is considered here.
A literature review by the Materials Systems Laboratory (MSL) at MIT of re-cent studies of secondary mass is shown in Appendix B. The Mass Decompounding Coefficient cited in the table refers to the percentage of primary mass attributable
Figure 2-5: Estimated mass impact of optional features by year. Dashed lines show projected future impact using fits of existing take rate data, while solid line is a linear fit of historic data.
to secondary mass. For example, a mass decompounding coefficient of 50% would indicate that the study found for each kilogram of primary mass, 0.5 kg of secondary mass was identified.
As reported in the literature the coefficients cited in the table vary widely from 23-129%. A strict average of these studies results in a mass decompounding coefficient of 79.6%. Thus for the purposes of this analysis a secondary mass coefficient of 80% has been used.
Recent studies, such as those of the Materials Systems Lab at MIT, have narrowed focus to identify whether power train components are held constant or not. Where power train components are allowed to change, the mass decompounding coefficient is generally higher. However, the ability to incorporate power train changes into a ve-hicle design is typically a function of timescale: year-to-year power train components usually remain constant but during a vehicle refresh or facelift such changes would
be possible. Since this thesis identifies changes over decades on a fleet-average basis, such changes are abstracted out.
2.7
Conclusions
Figure 2-6 highlights the impact that vehicle features have had since 1975, incorpo-rating a secondary mass value of 80% applied to each feature category.
Figure 2-6: Mass of passenger cars 1975-2010 and weight attributed to Safety, Emis-sions and Comfort/Convenience features (Secondary mass included).
Required safety and emissions equipment are the source of approximately 62 kg (3.9%) and 24.6 kg (1.5%), respectively to a 2010 vehicle. On average, optional equip-ment added to new 2010 vehicles added more than 136 kg (8.6%) to 2010 vehicles. By comparison, 1975 vehicles on average incorporated 31.2 kg (1.7%) of safety equipment, 6.35 kg (0.3%) emissions equipment, and 71 kg (3.9%) of optional features.
According to this analysis, basic sales-weighted passenger car mass (average pas-senger car mass less mass attributed to features) was 1183 kg (2603 lbs) in 1982. This base mass actually continued to drop until a low of 1154 kg was reached in 1987. Ba-sic vehicle mass has remained relatively constant, reaching a value of 1190 kg in 2010. Virtually all of the 200 kg in growth in vehicle mass since the mid-1980s is attributable to increasing adoption of vehicle safety, emissions, and comfort/convenience features.
Chapter 3
Measuring Technological
Sophistication
Chapter 3
Chapter 3 reviews existing methods used to estimate vehicle techno-logical sophistication. This chapter further uses the estimates of mass devoted to features to inform these estimates.
This chapter discusses a variety of measures of technical sophistication and their relatively consistent growth over time. Brake Mean Effective Pressure (BMEP) is a measure of technical efficiency, while the Performance-Size-Fuel Economy Index (PSFI), developed by An & DeCicco (2007), is a measure of the ability to deliver measurable amenities to consumers.
Neither is a perfect measure: technical efficiency is a relatively foreign concept to most car buyers and improvements in thermal efficiency can be used to either generate greater horsepower or improve fuel economy. On the other hand, PSFI is unable to capture all attributes that are important consumers and therefore underestimates actual growth.
This chapter proposes incorporating vehicle features, using mass values identified in Chapter 2, into the PSFI metric. The resulting metric, adjusted PSFI, thereby more closely reflects customer-perceivable amenities.
3.1
BMEP
A common measure of internal combustion engine efficiency is Brake Mean Effective
Pressure (BMEP). As discussed in [Chon and Heywood, 2000] and [Heywood and Welling, 2009], BMEP is a measure of the brake work per cycle an engine produces divided by the
engine’s displacement:
BM EPmax =
4π ∗ Tmax
Vd
or can be expressed as a function of volumetric efficiency (ηV), fuel conversion
efficiency (ηf,i) and mechanical efficiency (ηm) multiplied by the fuel to air mass ratio
(F
A), intake/atmospheric air density (ρa,i) and fuel heating value (%HV): BM EP = ηVηf,iηm
F
Aρa,i%HV
In Figure 3-1 Heywood and Welling show that the BMEP of engines increased at a relatively constant rate of approximately 1.5% per year from 2000 - 2008, with slight variations between naturally aspirated and forced-induction engines. These measurements are not sales-weighted, but are derived from the engines available each year.
These results suggest that engines are becoming more efficient at a relatively constant rate. However, since BMEP is strictly a measure of engine efficiency it is silent on the issue of how the entire vehicle system might have developed due to advances in manufacturing technology, materials and design.
3.2
PSFI
The BMEP growth rate of approximately 1.5% per year shown by Heywood and Welling correlates well with the growth rate in ton*mpg, a unit used by the EPA to de-scribe vehicle efficiency. An and DeCicco (2007), using data from [Heavenrich, 2006], calculate that ton*mpg increased an average of 1.6% per year from 1975 - 2005.
Figure 3-1: Trends in BMEP for U.S. engines from 2000 - 2008 [Heywood and Welling, 2009]
However, recognizing that ton*mpg does not incorporate growth in amenities such as size and performance, An and DeDicco (2007) introduce the concept of the Perfor-mance Size Fuel Economy Index (PFSI) as a measure of whole-vehicle sophistication based on readily measurable amenities.1 For passenger cars PSFI is defined as:
P SF I = P ∗ S ∗ F = hp lb ∗ F T
3∗ M P G
In words An and DeCicco describe this measure as ”the ratio of moving a spatial carrying capacity a unit distance with a given performance capability per unit of fuel consumed.” As shown in Figure 3-2, An and DeCicco, incorporating growth in all
1An and DeCicco use the term amenities to describe desirable characteristics tracked by the
EPA. This term should not be confused with the term feature used in this document to describe the addition of physical equipment to perform specific functions.
primary vehicle attributes tracked by the EPA, find that PSFI has grown at a rate of 5.3% for passenger cars from 1977 - 2005.
Figure 3-2: Performance Size Fuel Economy Index, 1975 - 2005 from [An and DeCicco, 2007]. This metric of vehicle sophistication has grown with re-markable linearity since 1975.
3.3
Adjusted PSFI
By incorporating three commonly measured attributes, PSFI is clearly a step closer to accurately representing a measure of the technical sophistication of modern vehicles. However, a critical omission of PSFI is that it is unable to capture developments in feature content that result in improved vehicle safety, reduced emissions and com-fort/convenience.
As a quick illustrative example, take the values used for PSFI in 2005: 3463 lbs, 182 hp, 111 cu ft and 29.5 mpg. Assume that several years later car companies have, on average, added 346 lbs (10% of weight) of equipment to improve safety, emissions, and comfort/convenience of the vehicle fleet. Further assume that powertrains have improved sufficiently to increase horsepower 10% without any resulting decrease in fuel economy. The resulting fleet of vehicles–with an average weight of 3809 lbs and 200 horsepower but with identical interior volume and fuel economy–would clearly be more sophisticated than the vehicles that preceded them but the calculated average PSFI would be exactly the same.
To ameliorate such a shortcoming of PSFI, this paper proposes an Adjusted PSFI metric. Adjusted PSFI simply adds a fourth term to the PSFI that represents a ratio of vehicle mass with safety, emissions and comfort convenience features over the same vehicle without these features. The resultant P SF IAdjusted metric is as follows:
P SF IAdjusted= P ∗ S ∗ F ∗
M assw/f eatures
M assw/oF eatures
= hp lb ∗ F T
3∗ M P G ∗ lb
lb
Since this fourth term is unitless, the P SF IAdjusted metric has the same units as
the standard PSFI metric. However, as shown in Figure 3-3, using the new metric we can see that technical sophistication has grown at a faster rate than that shown by PSFI.
3.4
Conclusions and Tradeoffs
These analyses indicate that the average technological sophistication of vehicles, mea-sured by thermal efficiency of available engines, has grown consistently by a rate of approximately 1.5% per year since the 1980s. When determined by ability to deliver customer-perceivable amenities the growth is shown to be approximately 5.3% per year since 1977.
Both of these indexes are measures of average vehicle performance–BMEP refer-ring to non-sales weighted availability and PSFI referrefer-ring to sales weighted delivery
Figure 3-3: Traditional PSFI vs. Adjusted PSFI growth from 1977 - 2010. of measurable vehicle amenities. However, both of these metrics are silent on the question of how different vehicle amenities can be traded off against one another.
[Cheah, 2010] uses a combination of techniques summarized in Table 3.1 to deter-mine a ”10-7” rule: that each ten percent in weight reduction results in a approxi-mately a 7% reduction in fuel consumption for gasoline-powered midsize cars.
Alternatively [Knittel, 2009] uses a Cobb-Douglas model to determine that a ten percent decrease in weight would correlate to a 4.26% increase in fuel economy, or that a ten percent decrease in horsepower would result in a 2.57% increase in fuel economy.
Cheah, Knittel and MacKenzie have focused on tradeoffs among the conventional amenities size, performance and fuel economy. Literature to-date has not explored to what extent safety, emissions, and comfort/convenience features could be traded off against conventional attributes. A tradeoff analysis of features should extent beyond
Table 3.1: Fuel consumption (FC)-curb weight relationship for a current conventional gasoline midsize car, from [Cheah, 2010].
Approach FC reduction per 10% mass reduction
FC reduction per 100 kg mass reduction
Literature Review 5.6-8.2% 0.36-0.58 L/100 km Empirical data
(MY2006-2008)
5.6% 0.36 L/100 km
Engineering Simulation (ADVISOR)
6.9% 0.39 L/100 km
the exploration of vehicle mass as features also impose parasitic losses that reduce powertrain efficiency.
Chapter 4
Deployment Rates of Vehicle
Technology
Chapter 4
Chapter 4 reviews literature on the technology adoption and, using data on deployment of features, identifies typical rates of deployment of specific features in the automotive fleet.
Each of the metrics discussed in the previous chapter: BMEP, ton*mpg, PSFI and P SF IAdjusted suggest that the growth in vehicle capability is strictly an evolutionary
process resulting from marginal gains in performance in multiple areas. However, such marginal improvement in vehicle functionality can be better characterized as the product of the independent development of hundreds of individual technologies.
The deployment of technology is aptly characterized by a logistic curve (also S-Curve). One of the earliest uses of this functional form was used by Everett Rogers in describing the process of Diffusion of Innovations. An image of this process is shown in 4-1. 1
Per [Rogers, 2003] consumer adoption has depended primarily on five key factors:
1In this chapter the terms diffusion and deployment are used interchangeably. These terms both
describe the process by which innovations are brought to market, although the traditional term diffusion characterizes the process as consumer-driven, while deployment has connotations of being producer-driven.
Figure 4-1: Functional form of the diffusion of innovations as envisioned by [Rogers, 2003]
Relative Advantage People will purchase an invention if they believe it will en-hance their utility in some fashion.
Complexity The degree to which an innovation is perceived as relatively difficult to understand and use.
Compatibility The degree to which an innovation is perceived as consistent with the existing values, past experiences, and needs of potential adopters.
Trialability The degree to which an innovation can be experimented with on a limited basis.
4.1
Common Models of Diffusion/Deployment
A wealth of literature has been published on the diffusion of innovations in various markets. One of the most commonly-cited of these, the Bass diffusion model, describes process of adoption as primarily the function of two effects: advertising and word-of-mouth.[Bass, 1969] Figure 4-2 shows a representation of this process using a System Dynamics model. The counterbalancing feedback loops of market saturation and word of mouth communication create the familiar S-shaped curve seen in diffusion models.
Figure 4-2: Functional form of the Bass diffusion model as envisioned by [Sterman, 2000]
4.2
Applying Regression
This chapter provides characterization of historical deployment rates of vehicle fea-tures intended to inform plausible deployment rates for future automotive technology. For the purposes of this analysis, a least-squares regression with a logistic
(S-Curve) form has been applied to feature take rates gathered from the EPA Fuel Economy Trends report, Ward’s Factory Installed data, and DOT report HS 809 834. The functional form of the regression used in these analysis is as follows:
T akeRate(t) = Limit 1 + αe−βt
Where,
Limit = Maximum Take of Features t = time in years
α = regression parameter approximating lag β = regression parameter approximating steepness
A complete list of features with charts of take rate data and applied regressions is provided in Appendices C - F.
4.3
Prior Work
[DeCicco, 2010] applies regression with a logistic form to feature data available from EPA for front-wheel drive, fuel injection, multivalve engines and VVT. The analy-sis proposes a logistic function and discusses both the steepness parameter of the adoption curve and also the number of years since the ”first significant use” although it is unclear exactly what criteria have been used to establish this date. DeCicco also proposes a logistic function within the range of other powertrain technologies as a plausible deployment scenario for hybrid electric vehicles (HEVs) although the author notes that HEVs will compete with other technologies for incorporation into future vehicle fleets.
While [Kramer and Haigh, 2009] do not use the term ”logistic function,” the au-thors use descriptive language to identify phases of growth in the power generation sector that are remarkably similar to those seen in the automotive industry. Kramer and Haigh also discuss the importance of the developmental phase of new
technol-ogy, citing that it takes ”time and industrial capacity”–not just capital investment–to deploy new technology.
[Nakicenovic, 1986] discusses the logistic form of the diffusion of technology in a variety of fields and identifies several examples of diffusion of automotive features. Nakicenovic also discusses differences among different types of vehicle features, a concept continued here with the differentation among safety, powertrain, and com-fort/convenience features. Nakicenovic cites examples of the time to reach 50% pen-etration of a new technology, a parameter referred to later in this chapter as ”devel-opmental lag time.”
The work performed in this chapter updates the work performed by Nakicenovic with nearly 25 years of new data on a broader array of technologies. The larger quantity of data available also allows secondary regressions of fit characteristics.
4.4
Important Characteristics and Secondary
Re-gression
In the form used here logistic regressions incorporate three primary characteristics: maximum take rate (or application), maximum growth rate (slope of the curve at its inflection point) and lag time, or delay in reaching the period of maximum growth as shown in Figure 4-3.
4.4.1
Maximum Take Rate
Unlike stand-alone products where a potential market needs to be identified, the sales of a particular feature of a passenger car cannot exceed sales of the car itself. As a result, the potential market is defined as the percentage of the new car fleet equipped with a given feature.
When examining historical maximum take rates, one soon encounters a problem: for most features where data is available, take rates have either already approached 100% or are projected to reach this saturation point. The reason for this is simple:
Figure 4-3: Important characteristics of a logistic function.
data is not closely tracked for technologies that are unsuccessful! At first blush this would seem to lead to a problem of selection bias, but a closer look is appropriate.
Examples of actual failed attempts to bring features to market in the automotive industry are not found in this data set.2 When take rates for a given feature do fall it
is generally the result of a technology supersession: eight-track players are replaced by cassette decks and CD players; traction control is replaced by stability control.
The question, then, seems to be one of boundary definition. Broadly defined, fuel injection has now saturated 100% of the new passenger car market. However, the growth in the use of fuel injection was in fact characterized by the the successive up-take of mechanical fuel injection, throttle-body fuel injection, and port fuel injection as shown in Figure 4-4. Since the development of this figure Gasoline Direct Injection
2One potential exception to this conclusion are diesels in the US market. After reaching a peak
of 6% of new passenger cars in 1981, diesels have fallen to less than a percent of recent new car sales. However, the argument can also be made that diesels were simply replaced by more preferable SI technology, thereby falling into the pattern of technology supersession discussed here.
(GDI) has seen large gains in use and may soon surpass other existing types of fuel injection.
Figure 4-4: Technology supersession in fuel injection and engine management as envisioned by [Amey, 1995]
Technology supersession is not always entirely contained within the automotive domain. Two recent examples–mobile phones and navigation systems–also show ev-idence of technology supersession. In-car phones originally reached a high of 9% of new passenger cars sold in 2000, but in the past decade the paradigm of in-car elec-tronics has been replaced by a model in which owners are presumed to buy a separate device. Take rates of in-car navigation systems are still increasing, but an increasing number of buyers use a stand alone portable navigation system or cell phone-based navigation application. Time will tell whether a market will continue to exist for factory-installed navigation systems with large screens and vehicle integration.
tech-nology will not reach 100% take rate:
Limited Appeal (Example: Rear sear entertainment) Some features simply will not appeal to all buyers. Rear Seat DVD players, for example, are generally considered desirable by buyers with small children but are of very limited use to a large fraction of buyers.
Significant Tradeoffs (Examples: Automatic Transmission, Front-Wheel Drive) Some features or technologies inherently involve tradeoffs in other attributes. Automatic transmissions, for example, remove the feel of control that some buy-ers want. Front-wheel drive, while offering a benefit to fuel economy, requires the sacrifice of rear-wheel drive handling dynamics sought after by some buyers. Competing Technology / Paradigm (Example: On-board Navigation) Some fea-tures and technologies compete with others for market share. On board nav-igation, for example, competes with mobile phones and portable navigation devices.
4.4.2
Maximum Growth Rate
The maximum rate at which the take rate of a technology grows is dependent on a variety of factors: consumer demand, producers’ ability to bring the technology to market on its fleet and, in some cases, the influence of regulation.
DeCicco (2010), while using slightly different regressions than those in this anal-ysis, points to the maximum growth rate (UM ax) of 17%/year for fuel injection in
LDVs, 11%/year for front wheel drive in passenger cars. While DeCicco does not perform an explicit regression on other technologies, the proposed value of 7.6%/year a plausible adoption rate of HEVs is similar to those he shows for multivalve engines and VVT.3
3Non-linear least squares regression requires the use of starting values to begin optimization.
Different starting values may result in the convergence on a variety of solutions, which may account for different regression values in the literature
However, as discussed in Chapter 2, each of these technologies has, to a varying extent, been driven by regulation. Figure 4-5 examines a histogram of the maximum growth rate of all features for which data is available. Figure 4-6 performs the same analysis but divides technologies into the functional categories of safety, powertrain, and comfort/convenience.
Figure 4-5: Histrogram of maximum feature growth rates.
Peak annual growth rates range from 1% - 23.9%. Safety features see the fastest deployment among these categories, ranging from 4.5% per year to 23.9%. This max-imum growth rate seems to confirm conventional wisdom, adopted in [NHTSA, 2010] and others, that an average five-year product development cycle is appropriate for modeling the automotive industry– even technologies with a clear life-saving benefit cannot be deployed much faster than 20% of the new vehicle fleet per year.
This histogram also seems to confirm the sentiment expressed by DeCicco, that the examples of technology growth in powertrain development commonly cited (FI, FWD, VVT, and Multivalve engines) exhibit ”very rapid rates of change.” In the
Figure 4-6: Histogram of maximum feature growth rate by category.
broader context of automotive features, yearly growth rates of less than 5% per year are more common.
The fastest growing of the comfort/convenience features, Satellite Radio, merits additional consideration. At 11% per year, Satellite radio is currently exhibiting very rapid growth in application for a feature where regulatory impact is not a consider-ation. Satellite radio has been the subject of a very aggressive marketing campaign in recent years. Since satellite radio is a subscription-based service, it represents a stream of residual revenue from the vehicle purchaser, typical shared between the satellite radio provider and vehicle manufacturer. As a result, OEMs have an incen-tive to push satellite radio to customers in the hopes that many of them will continue to subscribe. However, since the Wards data used in these regressions shows only the purchase of an option it is unknown how many of these customers actually activate the satellite radio service or are even aware of its installation.4
4Dealers may also receive a bonus for successfully selling options such as satellite radio. This
4.4.3
Developmental Lag Time
When a new technology or feature is brought to market in the automotive industry it is typically done in limited quantities and often on high-end flagship products. Fuel injection, for example, was first brought to market by Mercedes in 1954-55 on its 300SL race homologation vehicle. It was not until 1985, three decades later, that maximum growth in the mainstream automotive market was achieved.
This period of development and maturation seems to be not only the product of limited consumer demand, but also of an automotive manufacturing infrastructure building competence and confidence in a new concept.
The analysis shown here is a secondary regression comparing the inflection point from primary regressions to the date of the first production, street-going vehicle to use a technology. Since many features referenced here were developed before the earliest Wards data sets used, start dates have been identified using a variety of sources including Wikipedia, patent databases, and company advertising. As such, small discrepancies may exist in some start dates. A complete table of the values used for the charts shown below is available in Appendix G.
Figure 4-7 shows a regression of all features simultaneously, while Figure 4-8 shows independent secondary regressions by feature category. This analysis shows a dra-matic, exponential decline in the developmental lag time of features deployed over the past century.
There are a variety of explanations for such a change in the automotive industry. It is theoretically possible that the marked decrease in developmental lag time of features is the product of more stringent consumer expectations resulting from more exposure to new products and features through new media, and a higher level of communication between consumers leading to greater Word of Mouth interaction between adopters and potential adopters.
However, improvements in supply side capabilities have likely played a strong role as well. [Clark and Fujimoto, 1991] and [Ellison et al., 1995] highlight that while U.S.
Many manufacturers also provide the service free of charge for a period of time, a way of increasing the trialability of the feature for potential customers.
Figure 4-7: Historical phase-in time of all features.
and European automakers were at a significant disadvantage to Japanese producers in the 1970s and 1980s (Figure 4-9). However, by the mid-1990s they had reduced overall product lead time by nearly a year. The resultant increase in product changes allows a manufacturer to incorporate new features into the product mix more readily, while increasing competition pushes manufacturers to differentiate products by the incorporation of features with consumer appeal.
The structure of the automotive industry itself has also changed significantly over this same time period. Automakers are no longer vertically-integrated giants capable of receiving raw materials in one end of a plant and shipping cars out the other– the industry is now highly stratified and automakers are dependent on a pyramid of suppliers for components. [Ellison et al., 1995] highlight the increased role that suppliers play in the product development process. For U.S. suppliers, Ellison et al. (1995) find that supplier content in the product development process more than doubled from 15% to 33% from the 1980s to the 1990s. While Japanese supplier
Figure 4-8: Historical decrease in phase-in time of features by category. content decreased slightly over the same period, European supplier content increased. Increasing reliance on suppliers suggests that intellectual property is distributed more quickly as suppliers are free to market a new technology to a variety of manufacturers as customers.
However, despite these factors that dramatically different competitive landscape and decline, current developmental lag time still for new vehicle features remains on the order of approximately a decade, although this represents a dramatic decline since the 1950s.
4.5
Alternative Methodology: Z-Curves and
Lo-gistic Approximation
[Schafer et al., 2006] and [Bandivadekar, 2008] describes deployment of new automo-tive technology in three primary phases. The authors then project potential time
Figure 4-9: Product variety and model changes by region, adapter from [Clark and Fujimoto, 1991].
periods for these phases for a variety of technologies (shown in Figure 4-10). This section approximates the three phases used by Bandivadekar and Schafer et al. by extrapolating parameters identified by regression with a logistic form performed in the previous sections.
Table 4.1: Stages of deployment using parameters extracted from logistic regressions. Vehicle Technology Implementation Stage Variable Valve Timing Anti-lock brakes Keyless Entry Satellite Radio Market Competitive Vehicle 17 15 9 4 Penetration across new vehicle produc-tion
15 25 12 8
Major fleet penetra-tion
10+ 10+ 10+ 10+
Total time required 42+ 50+ 31+ 22+
In this analysis the periods of time for each phase of technology deployment are defined in the following manner. The ”Penetration across new vehicle production” phase is defined as the maximum fit take rate from logistic regression divided by the maximum growth rate from the same regression. Conceptually this can be envisioned
Figure 4-10: Stages of deployment of new vehicle technology. Image from [Bandivadekar, 2008], adapter from [Schafer et al., 2006]
as the line of maximum slope being extended until it intersects the x-axis and the maximum take rate (generally 100%).
The ”Market Competitive Vehicle” phase is defined here as time between the first production application and the x-axis intercept of maximum growth, or: DateM axGrowth−
DateIntroduction− (GrowthRateM ax/2 ∗ T akeRateM ax).
The ”Major Fleet Penetration” phase is not addressed here as it is generally the product of fleet turnover rates. The ”10+ years” value is used in all cases.
Table 4.1 shows the results of applying such parameters to four examples of tech-nologies with varying function, complexity and timing. This analysis confirms that for a variety of historical examples the time periods Schafer identifies are plausible.
Z curve fit parameters for all relevant time series feature data is plotted in Ap-pendix G. The last column, ratio, represents a ratio of the time spent in the devel-opment phase over the time spent in the deployment phase. Values greater than 1 indicate that more time is spent in development than deployment, while values less than one indicate that deployment takes longer than development.
Table 4.2: Z-curve: Phases of deployment and actual percentages of new vehicles sold with each technology for the four examples used in the previous table.
4.6
Differences Among Manufacturers
The analyses performed in the previous sections show trends in the new passenger car fleet as a whole. However, the automotive market is composed of a range of independent companies from large, full-line producers to boutique operations or those that compete only in a few segments. A fleet-wide analysis does not show differences between such varied producers.
4.6.1
Manufactuer-Specific Action and Fleet Impact
Figures 4-11, 4-12, and 4-13 show sales-weighted deployment of three key power-train technologies in the U.S. passenger car fleet overlaid with the start and finish of implementation by ten major automotive manufacturers based on data drawn pri-marily from the EPA fuel economy trends database. The manufacturers include three U.S., three European, and four Japanese auto manufacturers.
The manufacturer-specific bars start with the release of the first model includ-ing the technology and end with the phase-out of the last model not includinclud-ing the technology. The bars thereby represent the transitional period for each manufacturer with respect to the technology. In each case the bars have been ordered by the first use of the technology, with the manufacturers at the lower end of the chart beginning earliest.
Several key factors surface upon examination of technology deployment on a manufacturer-by-manufacturer level.5
Figure 4-11: Differences among automotive manufacturers in phase-in of fuel injec-tion.
Individual Producers Are Faster Than the Market While fleet-wide deployment may take decades, individual manufacturers are capable of deploying technol-ogy much faster. Mazda deployed Fuel Injection, VVT and Multivalve engines across its entire product portfolio in three, four, and eight years respectively. This is a special case as Mazda has traditionally been an OEM with a limited
5Small distinctions arise in this analysis. Chrysler began experimenting with fuel injection around
the same time as GM and in fact sold a small number of vehicles equipped with the Bendix ”elec-trojector” system. However, because the system was installed post-production and was purportedly installed on fewer than one hundred vehicles it is not counted as a start date here.

![Figure 1-2: Growth in mass of vehicles from four major classes from [Glennan, 2007]](https://thumb-eu.123doks.com/thumbv2/123doknet/14135978.469660/20.918.151.765.103.610/figure-growth-mass-vehicles-major-classes-glennan.webp)


![Figure 3-2: Performance Size Fuel Economy Index, 1975 - 2005 from [An and DeCicco, 2007]](https://thumb-eu.123doks.com/thumbv2/123doknet/14135978.469660/42.918.153.756.219.707/figure-performance-size-fuel-economy-index-decicco.webp)

