Publisher’s version / Version de l'éditeur:
ICETECH 06, 2006
READ THESE TERMS AND CONDITIONS CAREFULLY BEFORE USING THIS WEBSITE.
https://nrc-publications.canada.ca/eng/copyright
Vous avez des questions? Nous pouvons vous aider. Pour communiquer directement avec un auteur, consultez la
première page de la revue dans laquelle son article a été publié afin de trouver ses coordonnées. Si vous n’arrivez pas à les repérer, communiquez avec nous à PublicationsArchive-ArchivesPublications@nrc-cnrc.gc.ca.
Questions? Contact the NRC Publications Archive team at
PublicationsArchive-ArchivesPublications@nrc-cnrc.gc.ca. If you wish to email the authors directly, please see the first page of the publication for their contact information.
NRC Publications Archive
Archives des publications du CNRC
This publication could be one of several versions: author’s original, accepted manuscript or the publisher’s version. / La version de cette publication peut être l’une des suivantes : la version prépublication de l’auteur, la version acceptée du manuscrit ou la version de l’éditeur.
Access and use of this website and the material on it are subject to the Terms and Conditions set forth at
Evolution of an inertial measurement system called MOTAN: summary
of installations on five ice-strengthened ships
Johnston, M. E.
https://publications-cnrc.canada.ca/fra/droits
L’accès à ce site Web et l’utilisation de son contenu sont assujettis aux conditions présentées dans le site LISEZ CES CONDITIONS ATTENTIVEMENT AVANT D’UTILISER CE SITE WEB.
NRC Publications Record / Notice d'Archives des publications de CNRC:
https://nrc-publications.canada.ca/eng/view/object/?id=0ae4f2c6-662d-47bc-ac0a-b42015124934
https://publications-cnrc.canada.ca/fra/voir/objet/?id=0ae4f2c6-662d-47bc-ac0a-b42015124934
Evolution of an Inertial Measurement System called MOTAN:
Summary of Installations on Five Ice-Strengthened Ships
M.E. Johnston
Canadian Hydraulics Centre National Research Council Canada
Ottawa, Ontario Canada michelle.johnston@nrc-cnrc.gc.ca
ABSTRACT
This paper provides a description of MOTAN, an inertial motion measurement system that has been used to measure ice-induced global impact forces on ships since the year 2000. Measurements from three ships are used to show that MOTAN measures whole-ship motions reliably, and that those motions can be used to determine global impact forces on ships with reasonable accuracy. Data from the CCGS Terry Fox are used to show that MOTAN and two other, independent instrumentation systems measured impact forces that were in good agreement. Having demonstrated that MOTAN is a viable means of measuring global impact forces on ships, the discussion focuses upon more recent efforts to develop an autonomous MOTAN, i.e. a system that operates unattended during a ship’s entire operating season. To date, the autonomous MOTAN has been installed on two ships: CCGS Henry Larsen and the M/T Véga Desgagnés, with the objective of using the data to determine statistical information about the magnitude and frequency of global loads that a ship experiences during its operating season.
KEY WORDS: inertial measurement system; MOTAN; autonomous MOTAN; global load; impact forces; ice-ship interaction.
INTRODUCTION
In the year 2000, the Canadian Hydraulics Centre (CHC) of the National Research Council Canada (NRCC) began exploring a new application for their inertial measurement system called MOTAN. CHC developed MOTAN in the 1980s as a means of measuring the motions of ships and floating structures in a wave basin or towing tank (Miles, 1986). The new application involved using MOTAN to measure the whole-ship motions of an icebreaker, with the intention of using those motions to determine global impact forces during ship-ice collisions. The first full-scale installation of MOTAN was on the USCGC Healy during her maiden voyage in ice in April 2000 (Johnston et al., 2001-a). The promising results from ‘Healy’ provided the impetus to continue developing MOTAN as a load measurement system.
Since then, the experience gained from five installations on ice-strengthened ships (summarized in this paper) and model-scale validation work (Johnston and Gagnon, 2005) has been used to improve MOTAN. Because MOTAN has evolved over the years, it was felt that a discussion of its history and an updated description of the system was needed. This paper provides that description, along with a discussion of the lessons learned over the past six years, and how that experience has translated into an improved system for measuring global forces on ships.
MOTAN
MOTAN, which stands for MOTion ANalysis, is a two-part package that consists of (1) a portable, lightweight instrument that measures ship motions in six degrees of freedom and (2) computer software to process the measured ship motions and calculate global impact forces, as shown in Fig. 1. The physical MOTAN sensor has an orthogonal arrangement of three accelerometers and three rotational rate sensors that measure ship motions in six degrees of freedom. The accelerometers measure the total ship acceleration (including the earth’s gravity components) and the rate sensors measure the three-dimensional angular rotational rate of the ship along a body-axis coordinate system that moves with the ship. A standard data acquisition system is used to record six analog voltage signals from the sensor. Vibrations higher than 5 Hz are removed from the signal by a low-pass hardware filter, since those frequencies are not representative of the ship’s global response to impacts. MOTAN can be easily installed anywhere on the ship. It is usually installed near the ship’s centre of gravity because that is closest to the reference point used in calculating global impact forces and moments, as discussed subsequently.
Software for Calculating Whole-ship Motions
The MOTAN software relies upon nonlinear equations of motion to calculate transient whole-ship motions due to ice impacts. The software MOTAN9 is used to transform the accelerations and rotational rates measured by the physical MOTAN sensor (with respect to the
body axis of the ship, x', y' and z') to an inertial frame of reference (x, y, and z) that moves with the same average horizontal velocity as the ship, relative to the earth. Fig. 1 shows the output from the software, which includes time-series traces of the displacement, rate and acceleration in surge, sway and heave (translational motions) and pitch, roll and yaw (rotational motions).
Rate Acceleration Computer Software Displacement Surge x x x Sway y y y Heave z z z Pitch θ θ θ Roll φ φ φ Yaw ψ ψ ψ x’ y’ z’ Heave Pitch Roll Yaw Sway Surge
arrows used to show coordinate system and (positive) sign convention
MOTAN9
Whole-ship Motions
(6 files each in displacement, rate and acceleration)
EFM
Global Load
(determined using whole-ship motions output by MOTAN9) MOTAN
Sensor:
3 accelerometers 3 angular rate sensors
1.88 kg (260 mm x 160 mm x 100 mm)
Fig. 1 Hardware and software components of MOTAN, as of 2006
A number of changes have been made to the motion software MOTAN6 since it was developed to calculate the motions of model-scale ships. In the year 2000, MOTAN7 was developed to analyze measurements from USCGC Healy, which was the first full-scale installation of the MOTAN system (Johnston et al., 2001-a). Since then, MOTAN7A has been developed and has been used to calculate the transient ship motions of CCGS Louis S. St-Laurent (Johnston et al., 2003) and CCGS Terry Fox (Johnston et al., 2004). More recently, MOTAN9 and MOTAN10 were developed to eliminate the spurious oscillations in the coupled motions caused by impact-generated changes in ship speed. MOTAN9 is used to calculate whole-ship motions for short impact records (less than about 30 seconds) and MOTAN10 is appropriate for longer records such as those recorded by the autonomous MOTAN.
One assumption inherent in the MOTAN analysis is that the ship must qualify as a rigid body. Johnston et al. (2004) use data from two MOTAN sensors on the CCGS Terry Fox to demonstrate that icebreakers satisfy the rigid body requirement. The authors show that rotational rates and global accelerations in the bow of the ‘Terry Fox’ were comparable to those near the centre of gravity.
Software for Calculating Global Impact Forces
In the year 2000, the software called HPF (for Heave, Pitch Force) was developed, as a first approach, to calculate vertical impact forces on the ‘Healy’ using only the heave and pitch motions output by MOTAN7 (Johnston et al., 2001-a). While the HPF software was feasible for calculating global forces from symmetrical impacts, it was not able to calculate impact forces from oblique collisions (where sway, roll and yaw motions are important). In 2002, the software called EFM was developed to compute global impact forces from the entire suite of whole-ship motions that were output from MOTAN7A (Fig. 1). As such, EFM is appropriate for both symmetrical and oblique impacts.
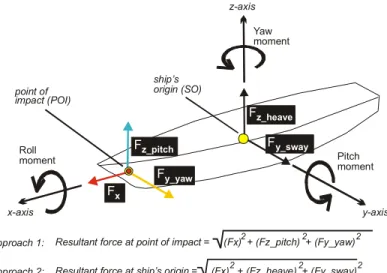
Johnston et al. (2006-a) provide a complete discussion of the EFM software, which uses the six linear coupled differential equations included in Salvesen et al. (1970) and McTaggert (1997) to calculate three global exciting forces and three global exciting moments at the ship’s origin. EFM can be used to calculate the resultant impact force using the two different approaches shown in Fig. 2. Approach 1 is used to calculate the impact force at the point of impact, using the component forces F_x, F_z_pitch and F_y_yaw. The longitudinal impact force (F_x) is calculated from the surge acceleration only, and is the same everywhere along the longitudinal axis of the ship. The vertical (F_z_pitch) and lateral (F_y_yaw) forces are calculated by dividing the pitch and yaw moments respectively, by the moment arm (the longitudinal distance from the ship’s origin to the point of impact). Approach 2 is used to calculate impact forces at the ship’s origin, using F_x, F_z_heave and F_y_sway. Unlike the first approach, the second approach does not require information about the impact location. This paper gives an example of forces calculated using MOTAN9/EFM using the relatively short records from the ‘Louis S. St-Laurent’ data. Impact forces on the ‘Terry Fox’ are calculated using MOTAN7A/EFM, to be consistent with the results presented in Johnston et al. (2006-a).
x-axis ship’s origin (SO) y-axis z-axis Fz_heave Fz_pitch Fy_yaw Fy_sway Pitch moment Roll moment Yaw moment point of impact (POI) Approach 1: Approach 2: Fx 2 2 2
Resultant force at ship’s origin = (Fx) + (Fz_heave) + (Fy_sway)
2 2 2
Resultant force at point of impact = (Fx) + (Fz_pitch) + (Fy_yaw)
Fig. 2 Approaches used to calculate resultant forces at (a) point of impact and (b) ship’s origin.
Calculating exciting forces and moments with the EFM software requires having information about the ship’s characteristics, hydrodynamic coefficients and hydrostatic coefficients. McTaggert (1997) describes those coefficients in greater detail. The coefficients, which depend upon ship speed and ship motion frequency, are determined for a wide range of frequencies, at operational speeds from 1 to 12 kn (0.5 to 6.2 m/s). To date, the Hydrodynamic Coefficients have been developed for USCGC Healy, CCGS Louis S. St-Laurent, and CCGS Terry Fox. They are currently being developed for the CCGS Henry Larsen and the M/T Véga Desgagnés.
THE EXPLORATION PHASE OF MOTAN: PROVING THE CONCEPT
This section describes the first three installations of MOTAN. Data from USCGC Healy are used to show that MOTAN provides a reliable means of measuring whole-ship motions. The CCGS Louis S. St-Laurent data are used to illustrate the type of global impact forces that MOTAN measured during backing and ramming operations. Data from CCGS Terry Fox are used to show that the impact forces measured by MOTAN were in good agreement with forces measured on two other, independently operated instrumentation systems.
USCGC Healy (April 2000)
The first full-scale installation of MOTAN was on the 16000 t USCGC Healy during her maiden voyage in ice, in April 2000 (Johnston et al., 2001-a). The voyage provided an excellent opportunity to measure whole-ship motions under a variety of conditions. As the ship transited from Halifax, Nova Scotia to Nuuk, Greenland she encountered open water, the Labrador marginal ice zone and pack ice east of Baffin Island. Although not planned as such, the roll and pitch motions measured by MOTAN were compared to two other onboard commercial ship motion packages. One commercial system, the TDGPS, measured the ship’s roll and pitch using differential output from four ship-mounted antennas. The TDGPS also output the ship’s heading, position and speed. The other commercial onboard system, the dynamic motion sensor MMS, used an orthogonal array of three linear accelerometers and three vibrating gyroscopes to measure the roll and pitch. It should be noted that, while neither the TDGPS or the MMS was meant for scientific evaluation during the ‘Healy’ trials, data from those sensors provided a means of validating the full-scale ship motions measured by MOTAN.
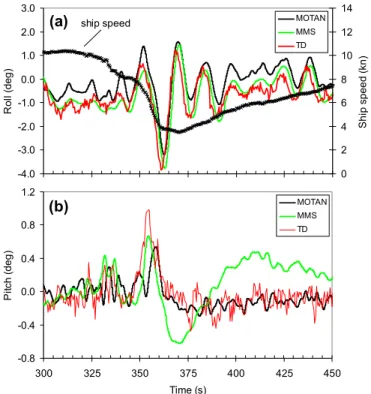
Fig. 3 shows a comparison of the roll and pitch measured by the MOTAN, TDGPS and MMS when ‘Healy’ impacted a first-year ice ridge at about 11 kn. Observations from the bridge noted that the ship was in loosely consolidated pack ice, and that the impact caused significant motions in roll and pitch. Analysis of data from MOTAN showed that this particular ridge impact produced the highest roll motions of any of the 17 events logged during the ‘Healy’ trials. The impact caused the ship speed to decrease to 4 kn, from 11 kn and produced roll motions upwards of 3.2 degrees on all three motion packages (Figure 3-a). All three systems measured a change in pitch during the impact (Fig. 3-b), however the agreement between the different instruments was not as favorable as in roll (Fig. 3-a). Little can be said about which of the three systems was most accurate because specifications were not available for the TDGPS and MMS.
Fig. 3 is reproduced from Johnston et al. (2001-a). The figure shows that the ridged impact discussed above produced a total vertical impact force of 4.3 MN, as calculated using the software HPF. Recall that the HPF software calculated impact forces from the heave and pitch motions only. Given past measurements on the USCGC Polar Sea (Minnick and St. John, 1990) and MV Arctic (German and Milne Inc., 1985), an impact force of 4.3 MN was considered a reasonable estimate for a ship impact with ridged first-year ice.
Results from the Healy trials showed that MOTAN could be used to measure global impact forces. The system required a number of improvements, however. For instance, many of the impact events
during the ‘Healy’ trials had been ‘lost’ because noise contaminated the MOTAN signal. That problem could be mitigated by using a gain to improve the signal to noise ratio. A gain would be needed whenever MOTAN was installed near the centre of gravity because motions there are attenuated, compared to the bow. The second improvement would require developing a data acquisition system for MOTAN. During the ‘Healy’ trials, the data acquisition system that sampled data from the hull-mounted strain gauges (St. John et al., 2001) was also used to acquire data from MOTAN. Because the two systems required different sampling rates (100 Hz versus 20 to 50 Hz respectively for the strain gauges and MOTAN), and because the sampling intervals were different (a few seconds for the strain gauges and a few minutes for MOTAN), fewer MOTAN data were collected than hoped.
-4.0 -3.0 -2.0 -1.0 0.0 1.0 2.0 3.0 300 325 350 375 400 425 450 Time (s) Ro ll ( d e g ) 0 2 4 6 8 10 12 14 S h ip spee d (k n) MOTAN MMS TD ship speed
(a)
-0.8 -0.4 0.0 0.4 0.8 1.2 300 325 350 375 400 425 450 Time (s) P it c h ( deg ) MOTAN MMS TD(b)
Fig. 3 Roll and pitch measured by three independent systems when Healy impacted ridged first-year ice at 11 kn. Analysis of MOTAN data performed using MOTAN7.
CCGS Louis S St-Laurent (October 2000)
In October 2000, MOTAN was used to measure global ship accelerations of the 13000 t CCGS Louis S. St-Laurent during backing and ramming operations in multi-year ice (Johnston et al., 2001-b). The MOTAN measurements were used to corroborate the loads and deflections measured on the ship’s propellers using specially designed instrumentation (Edgecombe et al., unpublished). The trials also provided an excellent opportunity to measure global forces during impacts with multi-year ice – extremely valuable data, considering the difficulty and expense of arranging for ship trials in multi-year ice. Before MOTAN was installed on ‘Louis’, two modifications were made to the system. First, a data acquisition system was developed that would allow MOTAN to be activated from the bridge using a hand held remote ‘trigger’. Second, a gain was applied to the MOTAN signal to
improve the signal to noise ratio. Those two modifications vastly improved the quantity and quality of data recorded during the weeklong trials, with more than ten hours of data and over 200 impacts being recorded.
Bridge observations of the ship’s response were used to help identify which impact events generated the most significant motions, and therefore global loads. The surge acceleration was examined to confirm that an impact had occurred. The sway acceleration provided information about whether the impact resulted from a symmetrical hit (in which case the sway was minimal) or oblique hit (which usually generated considerable sway). A global positioning system was used to determine the ship speed, which also provided information about the ‘significance’ of the impact.
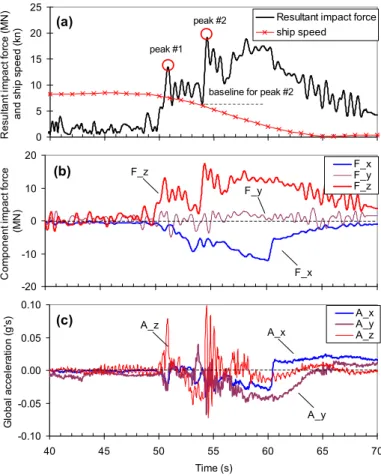
Johnston et al. (2003) include a detailed discussion of several of the impact events from the ‘Louis’ trials. For the purposes of this paper, data from one of the ‘Louis’ impacts were re-analyzed using the recently developed MOTAN9 software, in combination with EFM. The event shown in Fig. 4 occurred when ‘Louis’ impacted a hummocked multi-year ice floe at 8.3 kn. The resultant force for that event was calculated using Approach 1 (Fig. 2). The point of impact was determined from bridge observations noting that the symmetrical impact caused a direct hit to the bow (61 m from the ship’s origin).
0 5 10 15 20 25 40 45 50 55 60 65 70 Time (s) R e su lt a n t im pa ct f o rc e ( M N ) an d shi p s p ee d ( k n)
Resultant impact force ship speed
peak #1 peak #2
baseline for peak #2
(a) -20 -10 0 10 20 40 45 50 55 60 65 70 Time (s) C o m p on en t i m p a ct f o rc e (MN ) F_x F_y F_z F_x F_y F_z (b) -0.10 -0.05 0.00 0.05 0.10 40 45 50 55 60 65 70 Time (s) G lob al a c c el er a ti on ( g 's ) A_x A_y A_z A_x A_y A_z (c)
Fig. 4 Impact forces and accelerations measured by MOTAN on ‘Louis’. The baseline for peak #2 has been shifted to account for the offset introduced when the ship rode-up onto the floe. Analysis was performed using MOTAN9 and EFM.
The ship impacted the multi-year ice floe at an elapsed time of 50 s.
After impact, the ship penetrated the floe and rode-up onto it. The ship stopped with its bow partly suspended on the floe at an elapsed time of 65 s. Observations from the bridge noted that the ship had a pitch angle of 5 degrees when it came to a halt on the floe. The two highest resultant forces occurred when the ship impacted the floe (at 51 s, peak #1) and as the ship rode-up onto the floe (at 54.5 s, peak #2) as shown in Fig. 4-a. The initial impact produced a resultant force of 13.5 MN (peak #1). Properly interpreting a resultant force for peak #2 required adjusting the baseline to account for the offset that resulted when the ship rode up onto the floe. The ride-up process alters the ship’s hydrodynamics – a situation for which MOTAN was not designed (Johnston and Gagnon, 2005). Shifting the baseline from 0 MN to 6.4 MN, decreased the resultant force for peak #2 to 12.7 MN, from 19.1 MN.
Note that resultant forces for this particular ramming event were highly dependent upon the vertical force component (F_z, Fig. 4-b), which in turn was a function of the vertical acceleration (A_z, Fig. 4-c). In comparison, the longitudinal (F_x) and lateral (F_y) force components contributed less to the resultant impact force, which is in agreement with the lower longitudinal (A_x) and lateral (A_y) accelerations. Note also that, because the event was a symmetrical impact, F_y was minimal.
CCGS Terry Fox (June 2001)
In June 2001, MOTAN was used to measure global impact forces on the 6800 t CCGS Terry Fox. During the trials, more than 150 controlled collisions with pieces of glacial ice, or bergy bits, ranging from 30 to 22000 t, were conducted at impact speeds up to 14 kn (7.2 m/s). Most of the ship-ice collisions qualified as oblique impacts, in which a near-straight trajectory was used to target instrumentation on the ship’s port side. Local forces, ice pressures and contact areas were measured on a 4.5 m² strain-gauged area (Ritch et al., 2006) or a 5.4 m² impact panel (Gagnon, 2006). It should be noted that individual impacts affected only one, or the other, instrumented area of the hull because they involved relatively small contact areas (Ritch et al., 2006). Because of the localized nature of the ship-ice contact, it was possible to compare impact forces measured on a specific region of the instrumented hull, to global forces measured by MOTAN.
Johnston et al. (2006-b) provide a detailed comparison of the force-time histories for the six “best” impact events that occurred during the trials. The authors examined only those impacts that resulted in contact areas that were captured completely within the instrumented areas. Cases where the contact areas extended beyond the hull instrumentation would have produced impact forces that were underestimated, thus skewing the comparison.
One of the six impacts examined in Johnston et al. (2006-b) is presented here. Event 104, which generated the highest forces on the strain-gauged area (Ritch et al., 2006) is used to illustrate the type of load histories that resulted from the ship-ice collisions. This particular event occurred when the ship impacted a 1900 t bergy bit at a speed of 6.0 kn. Observations noted that the “very hard hit” caused a wave of water to splash over the foredeck. Resultant impact forces from MOTAN were calculated at the point of impact using Approach 1 (Fig. 2). Approach 1 requires information about where the impact occurred, which was easily determined from the strain-gauged data. Approach 2 was used to calculate resultant forces at the ship’s origin. Fig. 5 shows that MOTAN and the strain gauged area measured forces that were in good agreement. The peak resultant force at the ship’s
origin (Res_SO, 4.9 MN) closely matched the timing and magnitude of the peak force on the strain-gauged area (4.6 MN). In comparison, the peak resultant force at the point of impact (Res_POI, 3.8 MN) was lower, and occurred later, than the peak force on the strain-gauged area. Note that MOTAN produced force-time histories that were considerably “smoother” than the strain-gauged area. That is to be expected. While MOTAN measures rapid changes in the global ship accelerations (see Fig. 4-c), global impact forces take into account only those frequencies that are considered representative of the global ship response (below about 2 Hz).
0 2 4 6 17.0 17.5 18.0 18.5 19.0 19.5 20.0 time (s) F o rc e (M N ) SGA Res_SO Res_POI
Fig. 5 Global resultant forces from MOTAN at ship’s origin (Res_SO) and point of impact (Res_POI) compared to forces measured on the strain gauged area (SGA). Analysis performed using MOTAN7A and EFM after Johnston et al. (2006-b).
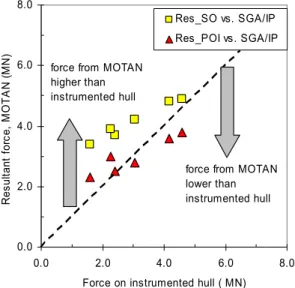
Fig. 6 shows the peak forces that were measured by the different instrumentation systems for Event 104 and the other five impacts examined in Johnston et al. (2006-b). Forces from MOTAN are compared to those on either the strain-gauged area (SGA) or the impact panel (IP), since only one of the instrumented areas registered the impact. In the figure, a dashed line was used to denote a 1:1 agreement between forces measured by the different instruments. Data points above the dashed line indicate that MOTAN measured a resultant force that was higher than the instrumented hull. Data points below the dashed line show that MOTAN measured a resultant force that was lower than the instrumented hull.
0.0 2.0 4.0 6.0 8.0 0.0 2.0 4.0 6.0 8.0
Force on instrumented hull ( MN)
Re s u lt a n t f o rc e , M O T A N ( M N ) Res_SO vs. SGA/IP Res_POI vs. SGA/IP
force from MOTAN lower than instrumented hull force from MOTAN
higher than instrumented hull
Fig. 6 Forces on the strain-gauged area (SGA) and impact panel (IP) compared to resultant global forces from MOTAN at the ship’s origin (Res_SO) and the point of impact (Res_POI) for six impacts. Dashed line represents a 1:1 agreement.
Fig. 6 shows reasonably good agreement between the impact forces calculated from MOTAN, using either approach, and the forces measured on the instrumented hull. The comparison is especially favorable considering the very different nature of the three instrumentation systems. Resultant forces at the ship’s origin (Res_SO) were consistently higher than forces measured by the strain-gauged area or impact panel. In comparison, resultant forces at the point of impact (Res_POI) were sometimes lower, or higher, than forces measured on the instrumented hull.
A number of factors contributed to the difference between the forces measured by MOTAN and the instrumented hull. The most logical explanation is that MOTAN captured the global force regardless of where the impact occurred, whereas the instrumented hull may have only partially captured the impact force. Despite evidence that the contact areas were relatively small, the loaded areas may have extended beyond the instrumented hull, even for the six ‘best’ impacts used in the comparison. The hull instrumentation was not designed to provide information about the global loads, per se. Rather, the strain-gauged area and impact panel provided valuable information about the rapid changes in the spatial distribution of force and contact area. Calibration errors (SGA and IP) and/or data processing technique (MOTAN) likely also influenced the results in Fig. 6. MOTAN may have overestimated the forces, or underestimated them, depending upon whether Approach 1 or Approach 2 was used for the calculation. Because the impact registered on either one, or the other of the instrumented areas, there is little doubt where the impact occurred; an important consideration for calculating forces from moments using Approach 1. While model-scale impact tests showed that MOTAN measured forces that were in favorable agreement with forces measured independently on an impacted plate (Johnston and Gagnon, 2005), a larger number of impact events from the ‘Terry Fox’ trials will need to be examined before a similar conclusion can be drawn for full-scale data.
AUTONOMOUS MOTAN: DEVELOPMENT AND IMPLEMENTATION
A fundamental part of the MOTAN installations on ‘Healy’, ‘Louis S. St-Laurent’ and ‘Terry Fox’ required having personnel on the bridge to activate the data acquisition system, and to take notes about the ship’s response and the ice feature that caused it. A MOTAN system that operated autonomously would be needed when it was not possible to have personnel stationed on the bridge to activate MOTAN. The so-called ‘autonomous MOTAN’ would record data throughout a ship’s entire operating season, which could be used to gather statistical information about the ice-induced global loads on ships. It was recognized that examining events on a case-by-case basis would not be a feasible approach for obtaining statistical information about ice loads, because it was labor intensive.
Developing an autonomous MOTAN required making a number of changes to the existing system. First, the data acquisition system was upgraded to allow data to be collected continuously for several months. The large volume of data was stored on both a hard drive and an external back-up system. By design, the autonomous MOTAN could restart automatically, should power to the unit fail at any time. All of the data acquisition system components were housed in a self-contained unit that could be installed easily at a convenient location on a ship. Because the autonomous MOTAN would collect reams of data, identifying impact events on a case-by-case basis would no longer be possible. Peak detection software was developed to facilitate event
identification, whereby an event would be ‘flagged’ each time a specific threshold was exceeded. The threshold, which is specified by the user, is a weighted average of select global ship accelerations. Fig. 7 shows the self-contained autonomous MOTAN system that was developed in 2003. For illustrative purposes, the MOTAN sensor and its aluminum housing have been placed on top of the data acquisition system. Normally, the MOTAN sensor is installed at a suitably stiff location at some distance from the data acquisition system.
To date, the autonomous MOTAN has been installed on two ships: CCGS Henry Larsen and the M/T Véga Desgagnés. The following discussion provides a brief description of those two installations. Because the autonomous MOTAN is still a ‘work-in-progress’, global impact forces for those two ships are not included here.
MOTAN
tape measure circled, for scale
MOTAN housing
data acquisition system for autonomous MOTAN
Fig. 7 Autonomous MOTAN system
CCGS Henry Larsen (March to May, 2004)
In the spring of 2004, the autonomous MOTAN was installed on the 8000 t CCGS Henry Larsen. The system operated continuously from March until May, as the ship operated in the ice-covered waters off Newfoundland and in the Gulf of St. Lawrence. During the first week of March, the author was onboard the ship to install the system, ensure that it functioned properly, and note when significant impacts occurred. Observations from the bridge enabled the peak detection software that had been developed for the autonomous MOTAN to be evaluated in terms of the number of impact events that it identified correctly. After that first week, Coast Guard personnel made similar observations whenever significant impacts occurred. Thanks to the efforts of Captain Vanthiel, Captain Broderick and the Crew of the ‘Henry Larsen’ a total of 49 events were documented from 8 March to 6 May 2004. Most of those events occurred as the ship transited medium to thick first-year ice at speeds from 9 to 15 kn.
The autonomous MOTAN functioned well on ‘Henry Larsen’ from March to May, continuously measuring the ship motions for 1796 hours. Experience showed that the system would benefit from having a global positioning system for two reasons. First, that information could be used to determine the ship speed, which is required by EFM to calculate global loads. Second, the GPS information could be used to superimpose the ship’s track on the Canadian Ice Service’s Ice Charts. That would provide an indication of when the ship was in ice, and what type of ice was being transited. Although Coast Guard personnel noted the ice conditions and ship speed for a number of impact events, that information is not available for hundreds of other impacts that occurred during the voyage.
M/T Véga Desgagnés (February to March, 2005)
Thus far, the discussion has shown that MOTAN is a viable means of measuring global forces on rigid ships such as icebreakers, but could the system also be used for less rigid, ice-strengthened commercial ships? An opportunity to answer that question came in 2003, when a presentation on MOTAN sparked interest from Petro-Nav, Inc. about using the system to measure loads on commercial ships. Mr. C. King, the Director of Operations for Petro-Nav, was agreeable to having MOTAN installed on one of the ice-strengthened, double-hulled tankers that Petro-Nav chartered from either Rigel Shipping Canada or Groupe Desgagné, with the corollary that specifics be discussed and approval obtained.
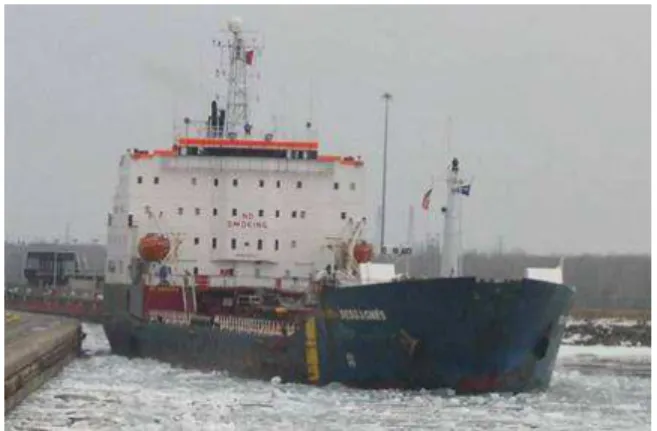
A number of challenges had to be surmounted before the autonomous MOTAN could be installed on a petroleum products tanker. First, the system needed to be installed on a ship that transited ice-covered waters. With Petro-Nav’s assistance, it was decided that the 13000 t M/T Véga Desgagnés (Fig. 8) would be the most suitable ship for the autonomous MOTAN, since it was scheduled to make a number of transits through the Gulf of St. Lawrence that season. Due to the limited space and time available, the autonomous MOTAN would need to be installed on the ship quickly, while she was docked in Montreal or Québec City and before she transited the Gulf of St. Lawrence.
Fig. 8 M/T Véga Desgagnés, commercial tanker on which the autonomous MOTAN was installed from February to March 2005 (photo courtesy of Groupe Desgagnés)
The greatest challenge, by far, related to finding an area where the autonomous MOTAN could be safely installed and operated. Because the Véga Desgagnés is a petroleum tanker, much of the ship was zoned as intrinsically safe. While MOTAN is not likely to generate sparks, neither is it certified as intrinsically safe, which meant that it could only be installed in certain areas. The stern of the ship was not designated as intrinsically safe, but that was not an optimal location because motions there would have been severely attenuated. Fortunately there was one area of the bow, below the forecastle deck, that was not designated as intrinsically safe. After consultation with PetroNav, Groupe Desgagnés and Transport Canada it was decided that the autonomous MOTAN could be safely installed and operated in that area.
The idea of installing two MOTAN sensors on the ship (as was done on the ‘Terry Fox’) was also explored, because that would have allowed ship motions in the bow to be compared to some other location. That
was not possible for a number of reasons. First, linking two MOTAN sensors would have required running cables topside, and that was not permissible given the intrinsic safety requirements. Second, the ship’s stern was the only other location where the MOTAN could have been installed and, as mentioned earlier, little would have been gained from installing MOTAN in the stern.
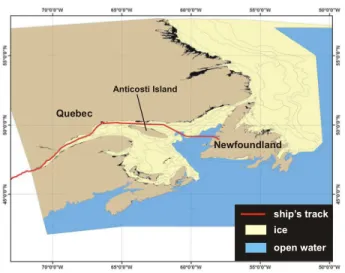
The autonomous MOTAN was installed on the Véga Desgagnés on 8 February 2005, when she docked in Montreal for the day. The system was removed on 19 March 2005, after the ship docked in Québec City. A total of 929 hours of data on the ship’s motions and position were collected as she transited between Québec, Newfoundland and Nova Scotia. Fig. 9 shows the ship’s track for the return route from Newfoundland (24 February to 3 March), superimposed on the weekly Ice Chart for 28 February 2005. The Ice Charts provide a general idea of the ice conditions through which the ship navigated, however the most valuable information was obtained from discussions with the Captain. For instance, Captain Dionne described the difficult ice conditions that the Véga Desgagnés encountered north of Anticosti Island (Fig. 9), when she encountered rafted first-year ice.
Quebec Anticosti Island Newfoundland ice ship’s track open water
Fig. 9 Route taken by Véga Desgagnés from 24 February to 3 March, overlain on Ice Chart for 28 February 2005. Difficult ice conditions were experienced north of Anticosti Island (Captain Dionne, personal communication).
CONCLUSIONS AND RECOMMENDATIONS
This paper summarized the six years of work on developing and implementing MOTAN as a means of measuring global ice impact forces on ships. An updated description of MOTAN was given, as was a discussion of the lessons learned and experience gained from installing MOTAN on four Coast Guard icebreakers and one commercial tanker. Results have shown MOTAN to be a reliable means of measuring whole-ship motions and global ice impact forces on icebreakers. Future work will involve continued efforts to validate MOTAN using data from independent load measurement systems. Work will continue in the area of using the autonomous MOTAN to provide statistical information about the global loads likely to be experienced by a ship during an operating season. That work has been underway for the past two years, as the autonomous MOTAN has been installed on the CCGS Henry Larsen and the M/T Véga Desgagnés. Results from those two installations are currently being analyzed.
Should the analysis show that MOTAN is appropriate for measuring impact forces on ice-strengthened commercial ships (as has been shown for Coast Guard icebreakers), the MOTAN system would have a much broader application.
ACKNOWLEDGEMENTS
Sincere appreciation is extended to V. Santos-Pedro of Transport Canada for his interest and support in developing and implementing MOTAN for the past six years. The success of the field measurements would not have been possible without the cooperation of the Canadian Coast Guard, and their willingness to have MOTAN installed on three of their icebreakers. A warm thanks for the interest, enthusiasm and participation of the Captains & Crew of the three CCGS icebreakers – they were responsible for producing impact events for the benefit of CHC/NRC and MOTAN! Thanks to the United States Coast Guard, J. St-John and M. Steele for their assistance during the USCGC Healy trials. Genuine thanks to C. King of Petro-Nav Inc., Groupe Desgagnés, Captain Dionne & Crew of the M/T Véga Desgagnés for their willingness, flexibility and cooperation in allowing the autonomous MOTAN to function (unattended) on their ship. The input of M. Miles, R. Frederking and G. Timco has been instrumental over these past years of exploring and expanding upon the potential of MOTAN.
REFERENCES
Gagnon, R. (2006). Analysis of Data from Bergy Bit Impacts using a Novel Hull-Mounted External Impact Panel. Submitted to Cold Regions Science and Technology.
German and Milne Ltd., 1985. MV Arctic: Test Results and Analysis, Final Report (1985). Report submitted to Transport Canada, prepared by German and Milne Inc and Technical Research Centre of Finland, Ship Laboratory, 28 January 1985. Report number TP 6270E, 95 pp. Johnston, M. and Gagnon, R. (2005) Validating MOTAN: Results from
Model-scale Impact Tests with the CCGS TERRY FOX. Proceedings of 18th International Conference on Port and Ocean Engineering under Arctic Conditions, POAC’05, Potsdam, New York, U.S.A., Vol. 1, pp. 409 - 419.
Johnston, M., Frederking, R. and Timco, G.W. (2001-b). Whole-Ship Motions and Accelerations at the Stern of the CCGS Louis S. St. Laurent, October 2000 Ice Trials. NRC Report HYD-TR-062, July, 2001,Ottawa, Ont., Canada.
Johnston, M., Frederking, R., Timco, G.W. and Miles, M. (2003) MOTAN: A Novel Approach for determining Ice-Induced Global Loads on Ships. Proceedings MARI-TECH 2003, Montreal, QC, Canada.
Johnston, M., Frederking, R., Timco G. and Miles, M. (2004) Using MOTAN to Measure Global Accelerations of the CCGS TERRY FOX During Bergy Bit Trials. Proceedings 23rd International Conference on Offshore Mechanics and Arctic Engineering, OMAE’04, Vancouver, Canada, Paper OMAE2004-51239.
Johnston, M., Timco, G., Frederking, R, and Miles, M. (2006-a). Global Loads on CCGS TERRY FOX as Determined from an Inertial Measurement System called MOTAN, Submitted to Cold Regions Science and Technology.
Johnston, M., Ritch, R. and Gagnon, R. (2006-b). Comparison of Impact Forces Measured by Different Instrumentation Systems on the CCGS TERRY FOX during the Bergy Bit Trials. Submitted to Cold Regions Science and Technology.
Johnston, M., Timco, G., Frederking, R. and Miles, M. (2001-a). Whole-Ship Motions of USCGC HEALY as Applied to Global Ice Impact Forces. Proceedings 16th International Conference on Port and Ocean Engineering under Arctic Conditions, POAC’01, Ottawa, Canada, Vol. 2, pp. 955-964.
McTaggart, K. (1997) An Improved Strip Theory Program for Ship Motions and Sea Loads in Waves. 4th Canadian Marine Hydromechanics and Structures Conference (SNAME), Ottawa, June, 1997.
Miles, M. (1986) Measurement of Six Degrees of Freedom Model Motions using Strapdown Accelerometers. Proceedings of the 21st American Towing Tank Conference, Washington, D.C., Aug. 1986. pp. 369 - 375.
Minnick, P. and St. John, J. (1990) Global Ice Forces and Ship Response to Ice: Second Season. Report submitted to Maritime Administration, prepared by ARCTEC Engineering Inc, August 1990. Report Number SSC-343, 46 pp.
Ritch, R., Frederking, R., Johnston, M., Browne, R. (2006). Local Ice Pressures Measured on a Strain Gauged Panel During the CCGS TERRY FOX Bergy Bit Impact Study. Submitted to Cold Regions Science and Technology.
Salvesen, N., Tuck, E.O., and Faltinsen, O. (1970) Ship Motions and Sea Loads. Transactions, Society of Naval Architects and Marine Engineers, Vol. 78, pp. 250-287.
St. John, J., Tunik, A., Riska, K., Sheinberg, R. (2001) Forward Shoulder Ice Impact Loads during the USCGC Healy Ice Trials. Proceedings of 16th Int. Conference on Port and Ocean Engineering under Arctic Conditions (POAC’01), 12 – 17 August 2001, Ottawa, Canada, Vol. 2, p. 965 - 968.