Publisher’s version / Version de l'éditeur:
Vous avez des questions? Nous pouvons vous aider. Pour communiquer directement avec un auteur, consultez la première page de la revue dans laquelle son article a été publié afin de trouver ses coordonnées. Si vous n’arrivez pas à les repérer, communiquez avec nous à [email protected].
Questions? Contact the NRC Publications Archive team at
[email protected]. If you wish to email the authors directly, please see the first page of the publication for their contact information.
https://publications-cnrc.canada.ca/fra/droits
L’accès à ce site Web et l’utilisation de son contenu sont assujettis aux conditions présentées dans le site
LISEZ CES CONDITIONS ATTENTIVEMENT AVANT D’UTILISER CE SITE WEB.
Proceedings of the RCI 21st International Convention: 23 March 2006, Phoenix,
Arizona, pp. 29-39, 2006-03-01
READ THESE TERMS AND CONDITIONS CAREFULLY BEFORE USING THIS WEBSITE. https://nrc-publications.canada.ca/eng/copyright
NRC Publications Archive Record / Notice des Archives des publications du CNRC :
https://nrc-publications.canada.ca/eng/view/object/?id=edb19d97-e440-4916-bb4b-853143046075 https://publications-cnrc.canada.ca/fra/voir/objet/?id=edb19d97-e440-4916-bb4b-853143046075
NRC Publications Archive
Archives des publications du CNRC
This publication could be one of several versions: author’s original, accepted manuscript or the publisher’s version. / La version de cette publication peut être l’une des suivantes : la version prépublication de l’auteur, la version acceptée du manuscrit ou la version de l’éditeur.
Access and use of this website and the material on it are subject to the Terms and Conditions set forth at
Which is the weakest link? Wind performance of mechanically attached
systems
http://irc.nrc-cnrc.gc.ca
Which is t he w e a ke st link ? Wind
pe rfor m a nc e of m e cha nic a lly-at t a che d
syst e m s
N R C C - 4 5 6 9 3
B a s k a r a n , B . A . ; K o , S . K . P .
A version of this paper is published in / Une version de ce document se
trouve dans: Proceedings of the RCI 21
stInternational Convention,
Phoenix, Arizona, March 23-28, 2006, pp. 29-39
WHICH IS THE WEAKEST LINK
1?
WIND PERFORMANCE OF MECHANICALLY ATTACHED SYSTEMS
Bas. A. Baskaran Ph.D, P.Eng and Steven Kee Ping Ko, M.EngM24-National Research Council Canada 1200 Montreal Road
Ottawa, ON, Canada, K1A OR6
ABSTRACT
Wind dynamics, on a mechanically attached single ply roofing assembly, lift the membrane and cause fluttering, introducing stresses at the attachment locations. To identify the component of the system that has the weakest resistance against wind uplift forces, a dynamic method of evaluating roofing systems is beneficial. Each component in the assembly offers resistance to wind uplift. Failure occurs when the wind uplift force is greater than the resistance of any one or more of these links. This study presents data that will help roof system designers maximize wind uplift ratings by choosing the appropriate roof components at the early design stage or by replacing/adding components to improve wind uplift resistance during reroofing. By diagnosing the weakest link from the failure mode, one can improve the wind resistance of a system. Therefore, a series of Mechanically Attached Systems (MAS) were constructed and exposed to simulated dynamic wind uplift forces at the Dynamic Roofing Facility of the National Research Council Canada (NRC-IRC). The goal of the paper is to present the ongoing experimental program and answer the following questions:
• By modifying the wind uplift resistance for one of the components, how much does the wind uplift rating of the assembly improves?
• Does the presence of a vapour barrier (retrader) in a system modify the force resistance chain? If so, to what degree does the wind uplift rating changes?
• Does a difference in steel deck thickness affect the force resistance chain and how much? Through a case study, this paper concludes with a procedure for system optimization.
1
This paper has been dedicated in the memory of James Sheahan who represented RCI in SIGDERS meeting. Jim was instrumental in the development of ‘weakest link’ concept.
PREAMBLE
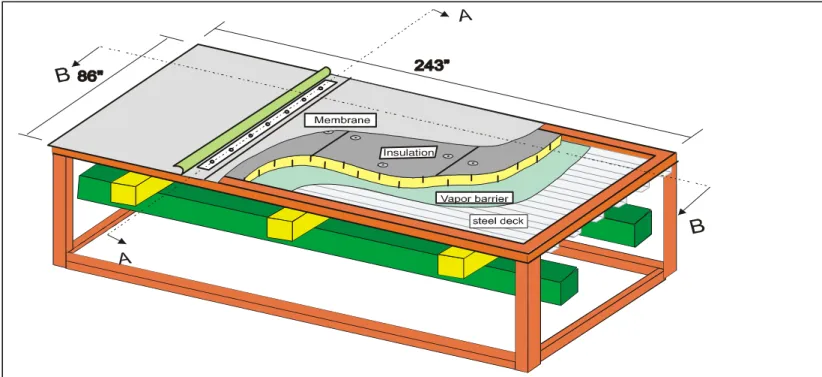
More than 50% of North American low slope buildings are roofed with single ply assemblies (NRCA, 2004). A Mechanically Attached System (MAS) is one in which the waterproofing single ply sheets are integrated with the other components using fasteners. This is becoming a popular installation method due to its lower installation cost. Wind effects on the MAS are shown in Figure 1. Wind dynamics cause membrane elongation and billowing. The magnitude of the wind induced suction and the membrane’s elastic property determine the billowing shape and fluttering magnitude. The components of a MAS are: deck, fasteners, plates, barriers (retarders), insulation, and membrane. Each component offers a certain resistance to the wind uplift force. This can be illustrated through a force resistance link diagram, which is also shown in the Figure 1. All resistance links should remain connected for the system to be durable and to keep the roof properly in place. Failure occurs when the wind uplift force is greater than the resistance of any one or more of these links. For example, the roof assembly is considered failed when a fastener (Link 6) pulls out from the deck even if the membrane and its seams are in good condition. Similarly, a system is considered failed when a seam (Link 2) tears under gusting wind while other components remain intact. (Baskaran, 2002).
For a roofing designer, this paper presents a procedure to optimize a mechanically attached systems wind uplift resistance. For a roofing component manufacturer, this paper emphasizes the need to scrutinize experimental data and work to improve the wind uplift resistance through failure mode diagnosis. The paper presents a cost benefit analysis case study for a thermoplastic system. However, the concepts are equally valid for other MAS. Experimental investigations for this study were carried out at the National Research Council Canada (NRC/IRC) Dynamic Roofing Facility (DRF). Details of the DRF’s operations were documented in Baskaran and Lei (1997). SIGDERS dynamic test protocol (CSA, 2004) was used and procedures involved in the development of the SIGDERS load cycle were presented at a previous RCI conference {Baskaran et al (1999)}.
EXPERIMENTAL SETUP AND RESULT DISCUSSION
System responses were measured as time histories by equipping the system with pressure sensors and load cells. All the measured time history records were analyzed and presented as pressure difference across the membrane or insulation and tensile forces on the membrane or insulation fasteners. Throughout the paper, data from system-sustained conditions are reported in three sections as follows:
• Effect of Vapour Barrier (retarder) on Wind Uplift • Effect of Seaming Technique on Wind Uplift • Effect of Deck Enhancement on Wind Uplift
Insulation
Membrane
Deck
Fastener
Plate
Barrier
Seam
Wind uplift
force
Resistance
Figure 1: Wind effec ts o n mechanica lly attac hed systems Page 1 of 1 6
Effect of Vapour Barrier (Retarder) on Wind Uplift
Four full-scale system mock-ups (Systems 1 to 4) were constructed and tested. System components were as follows:
• System 1: 22 Ga Type E (80 ksi) steel deck. Note that the measured tensile strength of the deck coupons was 101 ksi (696 Mpa). A layer of 2” (51 mm) thick ISO 4 by 8 boards was attached with 8 fasteners per board. A 45 mil (1.2 mm) thick and 78” wide (1981 mm) TPO membrane was used.
• System 2 had the same components as those of System 1. In addition, sheets of #15 building papers were laid over the steel deck. The sheets were overlapped {6” (152 mm)} and adhered with cold adhesive.
• System 3: 6-mil poly sheet. A poly sheet was loose laid over the steel deck.
• System 4: Self-adhered membrane of 36“ wide (914 mm) sheets fully adhered directly over the steel decks.
For discussion purpose, System 1 is labelled as system with no vapour barrier (NOVB) where as Systems 2,3 and 4 are labelled as systems with a vapour barrier (VB).
Insulation
The geometric details of a typical tested system are depicted in Figure 2. Membrane sheets were fastened at 12” (305 mm) spacing (Fs) along the seam, resulting in 7 fasteners per seam. Based on this arrangement, the distance between fastener rows (Fr) was 70.5” (1791 mm). Fasteners were 5” (127 mm) long with metal plates of 238” (60 mm) diameter. A typical one-side weld (OSW) seam was used for membrane overlaps. Each seam had an overlap of 5.5” (140 mm), with fasteners placed 1.5” (38 mm) from the edge of the under sheet, and 278” (73 mm)from the edge of the overlapping sheet. The portion of the seam beyond the fastener row was welded with hot air such that a waterproof top surface was obtained. The width of the welded portion varied between 1.5” and 1.75” (38 mm and 45 mm).
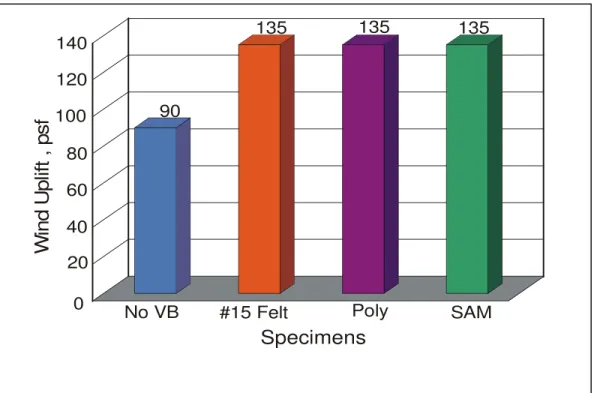
When subjected to dynamic wind loading cycles the NOVB system, system 1, sustained 90 psf (4.3 kPa) of wind uplift rating where as VB system sustained a higher wind uplift rating of 135 psf (6.5 kPa). In other words, VB systems performed about 50% better than NOVB systems. This was found to be true regardless of the vapour barrier type used. Similar observations were also reported by Smith (1995) under static testing.
90
135
135
135
No VB
#15 Felt
Poly
SAM
Specimens
W
in
d
U
p
lift , p
s
f
0
20
40
60
80
100
120
140
Figure 3: Wind uplift ratings of thermoplastic systems with and without vapour barrier (retarders)
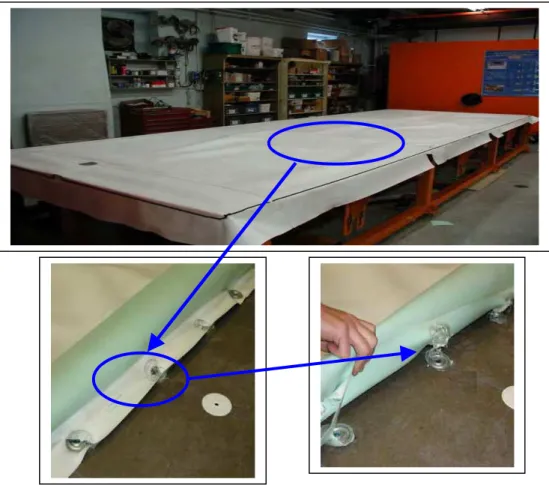
After the wind test, failed systems were examined for the weakest resistance link. Figure 4 shows a typical example of a failure mode. Both systems failed due to membrane tear around the fastener plates. Closer examination of the failure showed that the membrane had been stretched around the plates, and then was torn completely away from the plate, while the fasteners remained engaged with the deck. There was also an instance of delamination failure, as the membrane peeled slightly at one fastener location.
Examination of the system’s seams after the test revealed that the membrane had experienced some stretching, and bore teeth marks from the metal fastener plates. The clamping force of the membrane fastener plate is higher than the tear resistance of the membrane, and this resulted in the ‘cookie cut’ on the membrane at the membrane center fastener location. This might have resulted in tearing along the machine direction of the membrane at the adjacent fastener plate locations. In all of the scenarios, the fasteners were engaged well with the deck, and there was no bending of the plates. These conditions areas lead to the conclusion that TPO membrane resistance was the weakest link in the assembly.
Figure 4: Failure mode investigation identifies membrane as the weakest link
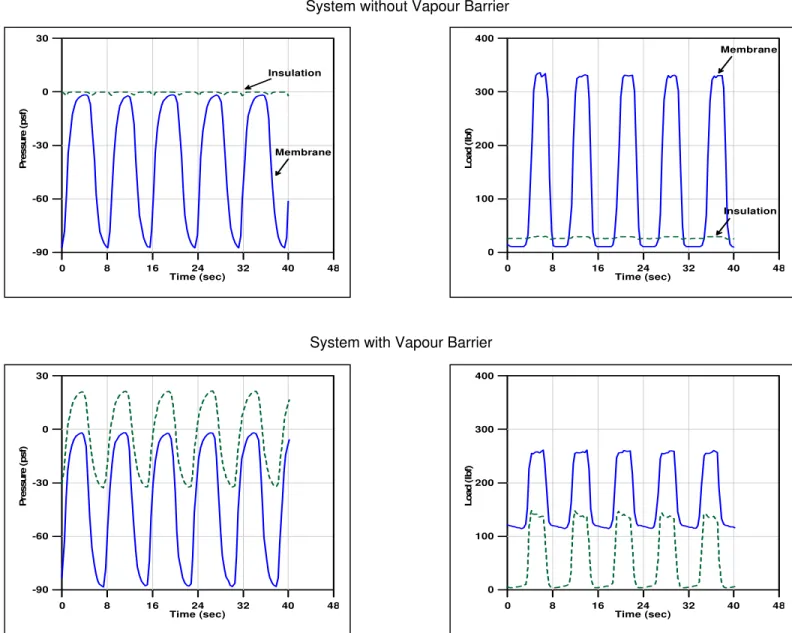
If there is no change in the installation process and the weakest link, then how can the wind resistance of a VB system be better than that of a NOVB system? To understand this further, partial time history data analysis, shown in Figure 5, was collected and analyzed. The partial time history data analysis represents a segment from the measured pressure and load time history, that respectively represents the loading sequence 4 of Level A (90 psf 4.3 kPa) of the SIGDERS load cycle. In the case of the NOVB system, the membrane fastener force varies from 0 to 350 Ibf (0 to 1557N) with 90 psf (4.3 kPa) wind gusts. For the same 90 psf (4.3 kPa) wind gusts, on the VB system, the membrane fastener force ranges between 100 and 250 lbf (445 to 1112 N). Measured loads on the insulation fasteners were about 150 lbf (667 N).
System without Vapour Barrier 0 8 16 24 32 40 48 -90 -60 -30 0 30 Time (sec) P ress u re ( p sf ) Insulation Membrane 0 8 16 24 32 40 48 0 100 200 300 400 Time (sec) Lo a d ( Ib f) Membrane Insulation
System with Vapour Barrier
0 8 16 24 32 40 48 -90 -60 -30 0 30 Time (sec) P ress u re ( p sf ) 0 8 16 24 32 40 48 0 100 200 300 400 Time (sec) Lo a d ( Ib f)
Figure 5: System load sharing performance with and without vapour barrier (retarder)
In other words, the insulation shares about 40% of the tensile forces of the membrane fasteners. It is interesting to note that in case of NOVB systems, there is no pressure building up across the insulation, and the insulation acts as a simple spacer between the membrane and the deck. The membrane is the only component resisting the wind uplift. However, in the case of the VB system, the insulation boards share about 40% of the applied suction. This is due to the fact that these vapour barrier types offer a certain resistance to airflow in addition to their preliminary function of limiting vapour diffusion. A research paper by Cook (1992) made the following conclusion about the presence of a vapour barrier in a roof system. “The vapour barrier shows a single-sided respond, resisting suctions by pressing up against the underside of the insulation boards, but falling slack into the deck troughs under pressure. The deck takes the remainder of the loads, since the sum of all three components exactly balances the applied suctions“.
Effect of Seaming Technique on Wind Uplift
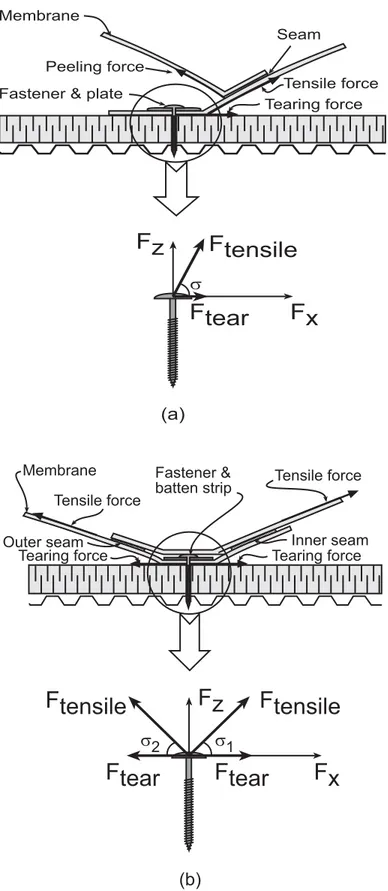
The systems failure modes with and without vapour barriers were membrane related. This means the weakest link for this roof system assembly is the TPO membrane. Failure mode investigation identified developments of asymmetrical forces at the membrane attachment location assembly as the cause of failure. This asymmetrical force led to pulling of membranes below the fastener plate and the metal plates profile configuration cutting the membrane. In order to improve the systems resistance, a double side weld (DSW) technique was used to replace the one side weld (OSW) method. Figure 6 compares a force diagram of OSW systems with DSW systems. In OSW systems (Fig. 6a), tensile forces cause tear forces along the direction of the weld. With a weld on each side of the fastener, tensile forces causes tear forces that are developed along the two opposite directions of the welds.
During wind gusting, at a given time these forces can be expressed as follows: System with one side weld:
cos
σ
tensile x
F
F
=
(1)
F
z=
F
tensilesin
σ
(2)System with double side weld:
F
x=
F
tensilecos
σ
1−
F
tensilecos
σ
2 (3)
F
z=
F
tensilesin
σ
1+
F
tensilesin
σ
2 (4) WhereF
x andF
z are the respective horizontal and vertical forces andσ
,σ
1 andσ
2are the membrane orientation angles due to wind uplift.It is evident from Equation 3 above that part of the forces developed on the fasteners in the horizontal direction for DSW systems (Fig. 6b) can cancel each other because of their opposing equal symmetrical stress distribution pattern. On the other hand, the stress distribution is asymmetrical in the OSW system. This means that the induced force along the horizontal direction would be higher for the OSW system than for the DSW system. Consequently, the degree to which the fasteners are rocked sideways and cause membrane tear, would be reduced by the DSW technology.
(a)
Seam
Tensile force Fastener & plate
Peeling force Membrane Tearing force
Fz
Ftensile
Fx
Ftear
s(b)
Inner seam Tensile force Fastener & batten strip Tensile force Membrane Outer seamFz
Fx
Ftensile
Ftensile
Ftear
Ftear
s
1s
2 Tearing force Tearing forceFigure 6: Force diagram of OSW vs. DSW systems
A new system mock up, System 5 was constructed and the DSW technique was used for seaming. Polymer batten strips 1” (25 mm) wide and 57 mil (1.5 mm) thick was used instead of round metal plates. The DSW seam width was 4 3/8” (111 mm) and the hot air process was used to form the seams with 1.5” (38 mm) wide welds on each side of the batten strip. System 5 also had a 6-mil poly vapour barrier similar to that of System 3.
System 5 with DSW sustained a maximum pressure of 158 psf (7.56 kPa). Comparing it to a similar system with one side weld, the double side weld system had higher wind uplift resistance even though both systems have the same layout and components. After the wind test failed, the system was examined to identify the weakest link. Figure 7 shows the failure mode of the DSW system. Instead of the membrane tearing around the fastener plate, as in the one side weld system; the membrane center fastener was pulled out of the seam in the double side weld system. This indicates, that the weakest link of this system was fastener engagement with the deck. Not only was this mode of failure very abrupt the examination of the deck condition shows extensive deck cracking at the engagement location. There was noticeable damage neither at either the polymer battens nor at the membrane seams.
Figure 7: Failure mode identifies deck as the weakest link
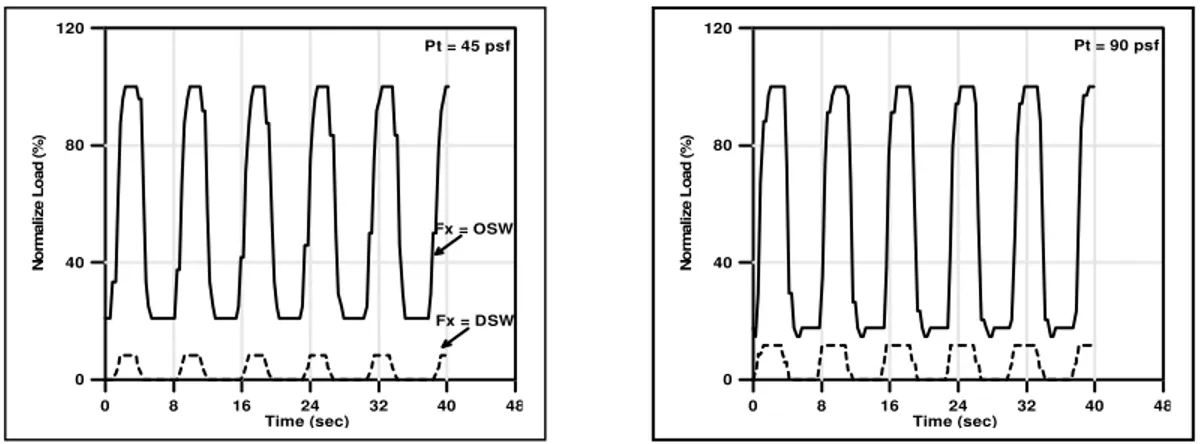
To understand the symmetrical force transfer behaviour of the DSW system, time history data was further analyzed for induced membrane fastener force in the horizontal direction (Fx). As shown in Figure 8, the presented partial time history data analysis, which is from loading sequence 2 of Level A (45 psf/ 2.15 kPa) and 4 of Level A (90 psf/ 4.3 kPa) of the SIGDERS load cycle. To quantify the relative performance of the DSW with respect to OSW, the Y-axis presents the normalized data. This was obtained by divining the DSW’s Fx with that of the OSW. Both pressure levels and the horizontal forces of the DSW were significantly reduced to less than 10% of the relative value. The partial time history data analysis supports the DSW theory in reducing the asymmetrical forces.
0 8 16 24 32 40 48 Time (sec) 0 40 80 120 N o rm al iz e L o ad ( % ) Pt = 45 psf Fx = OSW Fx = DSW 0 8 16 24 32 40 48 Time (sec) 0 40 80 120 N o rm al iz e L o ad ( % ) Pt = 90 psf
Figure 8: Reduction in asymmetrical forces in DSW systems
Effect of Deck Enhancement on Wind Uplift
In a mechanically attached roof system, the wind-induced load is transmitted through the membrane fasteners to the structural deck. A thicker deck should have a higher wind uplift resistance as compared to a thinner deck. This is due to the fact that the pullout resistance of a given fastener is higher in a 20 Ga deck as compared to 22 Ga deck. For example, the pullout resistance of a number 15 fastener was 700 lbf (3114 N) and 900 lbf (4003 N) with 22 Ga and 20 Ga decks respectively. In addition, tensile tests on deck coupons revealed that the tensile strength of 22 Ga deck was 101 ksi (696 Mpa), had whereas 20 Ga, had tensile strength of 107 ksi (738 Mpa). System 5, with double side weld, failed due to fastener pull out. An attempt was made to find out how much the deck thickness would affect wind uplift forces on the roof system by using a thicker (20 Ga) deck on System 5. A new mock up, System 6, was constructed with the same components used in System 5 with the exception of the deck. The new work-up was subjected to the SIGDERS load cycle with a test pressure of 90 psf (4.3 kPa), similar to the other systems.
System 6 passed the maximum pressure 180 psf (8.62 kPa) of the load cycle. It should be noted that when testing under the SIGDERS load cycle, one can incrementally run the test up to a maximum pressure level equal to two times the selected test pressure (Baskaran, 1999). In other words, for System
6, there was no failure observed when the system passed Level E (180 psf). This proved that thicker steel deck could resist higher wind uplift resistance.
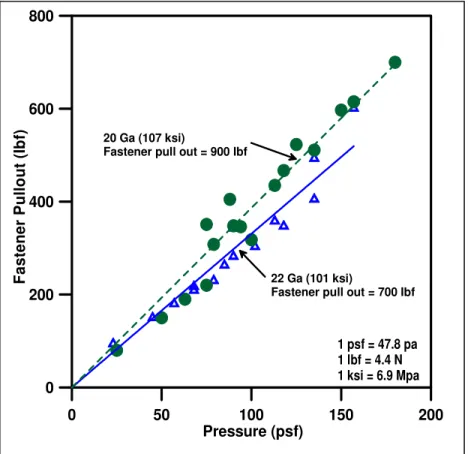
Figure 9 compares the measured fastener force at various pressure levels for System 5 and System 6. Only data corresponding to the Group one of the SIGDERS load sequences was used. The graph indicates that the thicker deck had higher membrane sustained loads, as compared to a thinner steel deck. Other observations that are evident from Fig. 9 are as follows:
• For both deck types, the maximum measured fastener load is less than the fastener pullout resistance. For the 22 Ga deck, the pull out was 700 lbf (3114 N), whereas the measured fastener force was about 600 lbf (2669 N). This indicated that the common practice of static testing, i.e., dividing the fastener pullout value by the tributary area (fastener spacing x fastener row spacing) to obtain the system resistance is not valid under dynamic testing.
• An increase in the tensile strength from 101 ksi (696 Mpa) to 107 ksi (738 Mpa) increases the deck stiffness. As such, the responses to wind uplift are different between the two deck types. This is more evident at pressure levels above 90 psf (4.3 kPa) when the measured fasteners loads are higher for decks thicker deck compared to 22 Ga.
0 50 100 150 200 0 200 400 600 800 Pressure (psf) F a ste n er P u ll o u t (I b f) 20 Ga (107 ksi)
Fastener pull out = 900 Ibf
22 Ga (101 ksi)
Fastener pull out = 700 Ibf
1 psf = 47.8 pa 1 lbf = 4.4 N 1 ksi = 6.9 Mpa
Figure 9: Measured fastener resistance force with variation in deck thickness
System Optimization
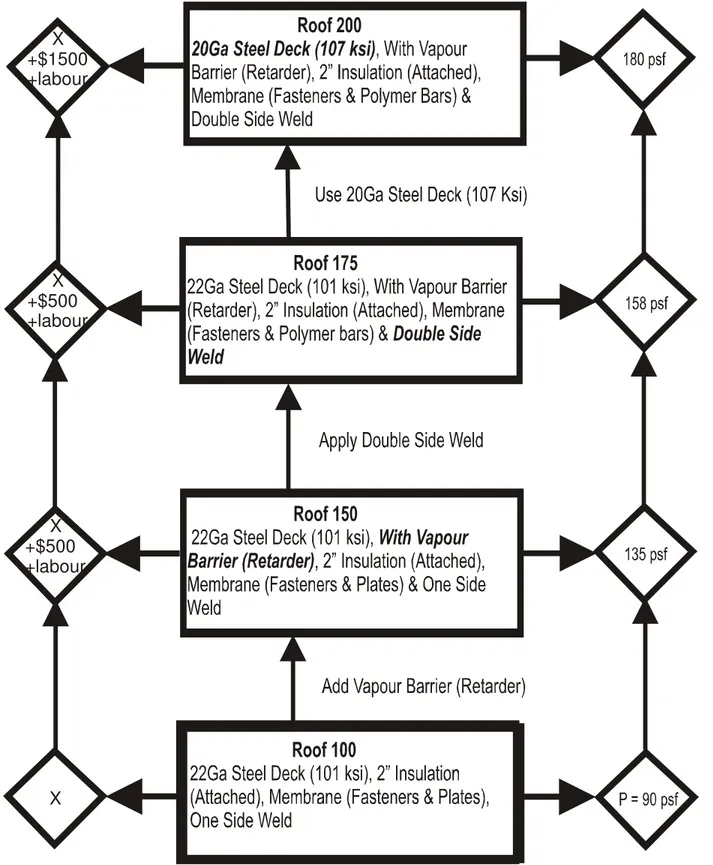
There is a myth that an increase in the wind uplift rating can significantly increase the overall roof system cost. Figure 10 shows a flow chart of the system optimization process. The basic system with deck, insulation and membrane can sustain a design pressure of 90 psf and is labelled as Roof 100. The cost of Roof 100 over 10,000 square feet is assumed as $ X. By applying a VB to Roof 100, the wind rating increased by 50% and it sustained a pressure of 135 psf (labelled as Roof 150 i.e. 90 x 1.5 = 135). The additional VB material cost for 10,000 square feet can be $500 plus labour cost. By applying the double side weld technique, the Roof 100 increased it’s rating to 158 psf as Roof 175 (90 x 1.75). The only additional cost is labour cost to apply the DSW technique instead of the OSW technique. By enhancing Roof 175 with a thicker steel deck, the Roof 200 sustained a pressure of more than 180 psf (2 x 90). For Roof 200, the additional material cost of replacing 10,000 square feet of 22 Ga steel decks with 20 Ga is estimated as $1000. By improving the weakest links of the Roof 100 systematically, Roof 200 achieved double the wind uplift resistance. However, the additional material cost is only $1500 plus labour cost. In other words, for an increase of only 15 cent per square feet, the wind uplift rating can be doubled. Although, a thermoplastic system was used in this study; the concept of weakest link identification and the cost benefit comparison can be equally valid for other mechanically attached systems.
CONCLUSION
This paper presented ways and means to improve the wind uplift performance of mechanically attached systems. It also demonstrated that experimental data together with failure modes investigation should be systematically used to identify the weakest links. This diagnostic practice can offer design alternatives for system enhancement. Through a case study, this paper presented arguments for ways to double the wind uplift rating with minimum increase in the cost, as along as the weakest links were identified appropriately.
REFERENCES
Good, C. National Roofing Contractors Association (NRCA) Professional Roofing Magazine, “Surveying the Roofing Market,” April 2005.
CSA (2004), “Standard Test Method for the Dynamic Wind Uplift Resistance of Mechanically Attached Membrane Roofing Systems- CSA A123.21-04”. Canadian Standards Association, Toronto.
Baskaran, A., (2002) “Dynamic Wind Uplift Performance of Thermoplastic Roofing System with New Seam Technology”, ASCE, Journal of Architectural Engineering, Vol. 8, No. 4, December 1, 2002
Baskaran, A., Chen, Y. and Vilaipornsawai, U. (1999) “A new Dynamic Wind Load Cycle to Evaluate Flexible Membrane Roofs”, ASTM, Journal of Testing and Evaluation 27(4), pp. 249 -265
Baskaran, A. and Lei, W. (1997), “A New Facility for Dynamic Wind Performance Evaluation of Roofing Systems”, Proceedings of the Fourth International Symposium on Roofing Technology, NRCA/NIST, Washington, D.C., U.S.A., pp. 168 -179
Thomas, Smith (1995) “Air Retarders Improve Wind Performance”, Professional Roofing, March 1995, pp. 66.
X
X
+$500
+labour
X
+$500
+labour
X
+$1500
+labour
Figure 10: System optimization by weakest link identification
ACKNOWLEDGEMENTS
The presented research is being carried out for a consortium - Special Interest Group for Dynamic Evaluation of Roofing Systems (SIGDERS). SIGDERS was formed from a group of partners who were interested in roofing design. These partners included:
Manufacturers: Atlas Roofing Corporation, Canadian General Tower Ltd., GAF Materials Corporation, Genflex Roofing Systems, Firestone Building Products Co., IKO Industries Canada, Johns Manville Corporation, Stevens Roofing systems and Soprema Canada
Building Owners: Canada Post Corporation, Department of National Defence, Public Works and Government Services Canada.
Industry Associations: Canadian Roofing Contractors' Association, Canadian Sheet Steel Building institute, National Roofing Contractors' Association and Roof Consultants Institute.