Publisher’s version / Version de l'éditeur:
Surface Science, 604, 11-12, pp. 996-1001, 2010-06-15
READ THESE TERMS AND CONDITIONS CAREFULLY BEFORE USING THIS WEBSITE. https://nrc-publications.canada.ca/eng/copyright
Vous avez des questions? Nous pouvons vous aider. Pour communiquer directement avec un auteur, consultez la
première page de la revue dans laquelle son article a été publié afin de trouver ses coordonnées. Si vous n’arrivez pas à les repérer, communiquez avec nous à PublicationsArchive-ArchivesPublications@nrc-cnrc.gc.ca.
Questions? Contact the NRC Publications Archive team at
PublicationsArchive-ArchivesPublications@nrc-cnrc.gc.ca. If you wish to email the authors directly, please see the first page of the publication for their contact information.
NRC Publications Archive
Archives des publications du CNRC
This publication could be one of several versions: author’s original, accepted manuscript or the publisher’s version. / La version de cette publication peut être l’une des suivantes : la version prépublication de l’auteur, la version acceptée du manuscrit ou la version de l’éditeur.
For the publisher’s version, please access the DOI link below./ Pour consulter la version de l’éditeur, utilisez le lien DOI ci-dessous.
https://doi.org/10.1016/j.susc.2010.03.003
Access and use of this website and the material on it are subject to the Terms and Conditions set forth at
STM and HREELS investigation of gas phase silanization on
hydroxylated Si(100)
Fan, C.; Lopinski, G. P.
https://publications-cnrc.canada.ca/fra/droits
L’accès à ce site Web et l’utilisation de son contenu sont assujettis aux conditions présentées dans le site LISEZ CES CONDITIONS ATTENTIVEMENT AVANT D’UTILISER CE SITE WEB.
NRC Publications Record / Notice d'Archives des publications de CNRC:
https://nrc-publications.canada.ca/eng/view/object/?id=57cafeb4-43a3-4485-9815-bcf3d8e8fd2e
https://publications-cnrc.canada.ca/fra/voir/objet/?id=57cafeb4-43a3-4485-9815-bcf3d8e8fd2e
STM and HREELS investigation of gas phase silanization on hydroxylated Si(100)
C. Fan, G.P. Lopinski
⁎
Steacie Institute for Molecular Sciences, National Research Council Canada, 100 Sussex Dr., Ottawa, Ontario, Canada K1A 0R6
a b s t r a c t
a r t i c l e
i n f o
Article history:
Received 28 July 2009 Accepted 1 March 2010 Available online 20 March 2010
Keywords: Silane HREELS STM Gas phase Silicon Functionalization
The gas phase anhydrous reaction of glycidoxypropyldimethylethoxysilane (GPDMES) with a model hydroxylated surface has been investigated using high-resolution electron energy loss spectroscopy (HREELS) and scanning tunneling microscopy (STM). Water dissociation on the clean reconstructed (2×1)-Si(100) surface was used to create an atomically flat surface with ~0.5 ML of hydroxyl groups. Exposure of this surface to GPDMES at room temperature under vacuum was found to lead to formation of covalent Si–O–Si bonds although high exposures (6×10⁸L) were required for saturation. STM images at the early stages of reaction indicate that the
reaction occurs randomly on the surface with no apparent clustering. The STM images together with semi-empirical (AM1) calculations provide evidence for hydrogen bonding interactions between the oxygen atoms in the molecule and surface hydroxyl groups at low coverage.
Crown Copyright © 2010 Published by Elsevier B.V. All rights reserved.
1. Introduction
Silane coupling agents have the ability to form a durable bond between organic and inorganic materials, and thus have been used extensively for modifying the surface physical and chemical properties of oxide surfaces. Silanization usually takes place via reaction of hydrolyzable substituents (alkoxy or choloro groups) with surface hydroxyl groups resulting in formation of a covalent linkage. There are two basic paths for the silanization reaction. The simplest path is via a direct elimination reaction between the reactive alkoxy or choloro groups with surface hydroxyls. The more common reaction path involves the participation of water. In this two step process, the silane groups first hydrolyze to form silanols followed by a condensation reaction with the surface hydroxyl groups resulting in formation of a covalent bond. The latter reaction pathway is considerably more facile than the anhydrous route. However, the condensation reaction can also lead to cross-linking between silanes and polymer growth, complicating the surface structure[1,2].
Earlier studies of silanization focused on the silanization of silica in aqueous solution, aimed at understanding and optimizing the adhesive properties of silanes[3–5]. Due to the competition between reactions with surface hydroxyl groups and intermolecular coupling reactions leading to polymerization, the film quality was found to be very sensitive to deposition conditions resulting in limited reproducibility. In order to improve reproducibility of the film quality, silanization under non-aqueous solution was widely studied[6–8]. The quality of the thin film was improved by controlling the quantity of the trace water in the
solution as well as on the substrates[6]. Substrates used in these studies were typically silica powders or native SiO2on silicon wafer. Under
well-controlled conditions, silanization in anhydrous solution occurs via direct reaction with surface hydroxyl groups, but is usually relatively slower than the two step hydrolyzation–condensation pathway. An alternative method to control the water content is to carry out the reaction in the vapor phase. In this case the main source of water is from the substrate, which can be easily controlled or eliminated by annealing to appropriate temperature in vacuum. Comparison of monolayer films produced by vapor and solution phase processes have indicated that improved film quality can be achieved via the former approach[9–14]. To better understand the silanization reactions and the morphology of the resulting films, a well-defined model hydroxylated surface is desired. Water has been observed to dissociate on a clean reconstructed (2×1)-Si(100) surface to form covalent Si–OH and Si–H bonds, resulting in a surface with ~0.5 ML of surface hydroxyl groups [15–22]. The flatness of this surface and the absence of an insulating oxide layer enable the use of scanning tunneling microscopy (STM) to observe the atomic scale morphology of the surface after silanization. In our UHV system, the model surface can be exposed to organosilanes at the load lock chamber and transferred back to the UHV system without exposure to the air. As a result the entire investigations were carried out in the vacuum environment, eliminating uncertainties and contamination associated with removing the samples to air.
In this paper, we employ the model hydroxlated Si(100) surface to investigate the silanization reaction of 3-glycidoxypropyldimethyl-ethoxysilane (GPDMES) using STM and high-resolution electron energy loss spectroscopy (HREELS). HREELS is used to identify the attached species after the exposure of GPDMES to the surface. Compared to similar surface vibrational spectroscopies, such as FTIR, HREELS is much more sensitive at the low frequencies suitable for studying the Si–O–Si bond
⁎ Corresponding author. Tel.: +1 613 990 4155.
E-mail address:Gregory.Lopinski@nrc-cnrc.gc.ca(G.P. Lopinski).
0039-6028/$ – see front matter. Crown Copyright © 2010 Published by Elsevier B.V. All rights reserved. doi:10.1016/j.susc.2010.03.003
Contents lists available atScienceDirect
Surface Science
formation. The choice of GPDMES was motivated by the extensive use of epoxy silanes to immobilize probe molecules (oligonucleotides or proteins) for biosensor applications[23–25]. Compared with the more commonly used epoxysilane, (3-glycidoxypropyl)trimethoxysilane (GPTMS), GPDMES has a higher vapor pressure. The presence of a single alkoxy group ensures that cross-linking and polymerization reactions are fully prevented.
2. Experimental
The studies were carried out entirely in a UHV chamber equipped with both STM and HREELS. An LK3000 spectrometer (LK Technol-ogies, Bloomington, IN) was employed for the HREELS measurements. Spectra were acquired in the specular geometry (60° with respect to the surface normal) at an incident beam-energy of 6 eV and the spectrometer resolution of 6 meV (56 cm− 1). The STM used for the
experiments was a UHV1 from Omicron. STM images were rendered into grey scale and flattened using in-house software developed by Doug Moffatt of SIMS-NRC.
Samples were cut from Si(100) wafers (Virginia Semiconductor, n-type 1–10Ω cm) and cleaned by rinsing with ethanol, prior to transfer into the UHV chamber. The sample was degassed at ~580 °C overnight followed by cooling to room temperature and flashing to 1100 °C to obtain a clean (2 × 1) Si(100) surface. This surface was then exposed to 100 L H2O at room temperature to obtain the hydroxylated Si(100)
surface. The surface quality was monitored by HREELS and STM, as shown inFigs. 1 and 2in the next section. The 100 L exposure used here is well in excess of the 10 L H2O reported to be sufficient to
saturate the surface[15]in order to attempt to minimize the density of residual dangling bonds.
GPDMES (Aldrich, N97%) was placed into a glass vessel, connected to the gas manifold of the UHV system and purified by several freeze– pump–thaw cycles. Prior to each exposure, the solution was purified using a single freeze–pump–thaw cycle. Due to the high exposure pressures (up to 10 mTorr) required in the current studies, reactions were carried out in the turbo pumped loadlock of the UHV system (base pressure ~1×10− 7Torr). Higher exposure pressures were monitored
using a convectron gauge while pressures below 0.1 mTorr were measured using a cold cathode gauge. Due to a concern with the cold cathode gauge stimulating reactions or contaminating the sample, the gauge was turned off during the actual reactions. The pressure of
GPDMES was estimated by measuring the pressure at the same valve position used for the exposures.
3. Results and discussion
The model hydroxylated Si(100) surface formed via dissociation of water was characterized by HREELS and STM.Fig. 1shows the HREEL spectrum of the surface obtained after exposing the clean Si(100) surface to 100 L H2O. The elastic peak is considerably broader (FWHM
of 140 cm− 1) than the spectrometer resolution, which can be
attributed to the excitation of the free carrier plasmon mode arising from the substrate dopants. The spectrum is dominated by a strong peak at 820 cm− 1, which can be attributed to the stretch mode of Si–
OH[15]. The O–H bending vibration also falls into this range and cannot be distinguished from the Si–OH stretch mode. Exchange of the O–H groups with O–D resulted in the appearance of two loss modes in this region of the spectrum (not shown) at 650 and 810 cm− 1, which
are assigned to O–D bending and the Si–OD stretching modes respectively. The loss peak around 3670 cm− 1is from the O–H stretch,
while the peak around 2090 cm− 1is from the Si–H stretch. The weak
peak at around 1665 cm− 1 is from the overtone of the Si–OH
stretching mode. In addition to these peaks which are expected from the dissociation of water to form Si–OH and Si–H groups a weak peak at ~2940 cm− 1can be assigned to the C–H stretch arising from a small
degree of hydrocarbon contamination introduced during sample flashing and water dosing.
A typical STM image of the hydroxylated Si(100) surface is shown in Fig. 2. The dimer rows of the (2 × 1) Si(100) are clearly seen, indicating that the dimer structure is maintained after water exposure, consistent with previous studies[18,26,27]. A number of small (1–2 Å) protrusions are observed, most of which are asymmet-rically positioned with respect to the dimer row. These protrusions can be assigned to isolated dangling bonds arising from the presence of both inter and intradimer dissociation pathways. From this image the dangling bond density is observed to be ~2.4% ML in agreement with previous work[27]. In addition to the dangling bond features a considerably smaller density of larger (3–4 Å) protrusions are observed and are likely due to contamination arising in the cleaning or water dosing steps.
Fig. 3shows the evolution of the spectra upon exposing the hydrox-ylated surface to GPDMES at various pressures and times followed by annealing at ~200 °C for 5 min. The annealing is used to remove physisorbed silanes and is also used for the STM measurements
Fig. 1. HREEL spectrum of hydroxylated surface prepared by exposure of 100 L H2O on
the clean Si(100) surface.
Fig. 2. Constant current STM image (− 2.5 V, 30 pA, 25 × 25 nm2) of the hydroxylated Si(100) surface. Examples of residual dangling bond features are indicated by white circles.
discussed below. Annealing the bare hydroxylated Si(100) surface under these conditions was found to leave the surface largely unchanged with only a very small fraction of the hydroxyl groups dissociating, in agreement with previous work[27]. After exposure of 0.01 mTorr of GPDMES for 10 min (6×10³L) there is clear evidence of a reaction in the
HREEL spectra (Fig. 3a). Both the 820 cm− 1and 3670 cm− 1 peaks
characteristic of the hydroxylated surface are seen to decrease signif-icantly and are accompanied by the growth of a mode at 2940 cm− 1
which can be attributed to the C–H stretch of the four methylenes and two methyl groups on the reacted molecule. The small shoulder appearing near 1400 cm− 1can be attributed to the methylene bending
modes as well as the CH3 umbrella deformation mode. Another
important change in the spectra upon reaction is the shoulder on the high energy side of the intense 820 cm− 1mode. The position of this
shoulder at ~1020 cm− 1is characteristic of Si–O–Si modes[19,28]and
can be attributed to the formation of a siloxane bond. The formation of the siloxane bond is expected because the surface was annealed to 200 °C, higher than the typical temperature of vapor phase silanization
[10,29]. In fact, the spectra are very similar before and after annealing, supporting the formation of Si–O–Si bond at RT. This is surprising in view of the observation that most silanes do not react with surface silanols on SiO2at room temperature under anhydrous conditions[30]. Differences
between the reactivity of the hydroxylated Si(100) and silicon oxide surfaces are discussed in more detail later in this section.
Upon further exposure of the surface to GPDMES the spectra continue to evolve in a manner consistent with the changes observed at the early stages of reaction. The O–H related peaks are observed to decrease while the C–H related peaks increase in intensity. After exposure at 0.09 mTorr for 1100 min (Fig. 3c) the shoulder at 1020 cm− 1becomes a clear peak,
indicating the formation of substantial Si–O–Si linkages formed by the reaction between GPDMES and the surface hydroxyl groups. At this exposure the C–H stretch mode intensity is significantly higher than that of the O–H or Si–H stretches although both of these are still clearly visible. Finally exposure of 10 mTorr for 1000 min (6×10⁸L) leads to
almost complete disappearance of the O–H stretching peak as seen in
Fig. 3d. However, a clear shoulder is still visible at 820 cm− 1suggesting
that reaction of the hydroxyl groups is not complete. Additional exposure of the surface to GPDMES does not result in further changes to the spectrum indicating that steric factors block complete reaction of the hydroxyl groups. The frequency of the loss peak due to the Si–O–Si
mode is seen to shift up to ~1050 cm− 1at high coverage, likely due to
coupling between adjacent molecules. Similar shifts to higher frequency upon increased coupling between Si–O–Si modes have been observed in the case of oxidation of H-terminated silicon surfaces[31].
The Si–H peak is also seen to decrease upon exposure to GPDMES, becoming substantially reduced at the high exposures inFig. 3d. Since no reaction is expected between the Si–H groups and the GPDMES, the decrease of the intensity of the Si–H vibration is attributed to the attenuation of the impact scattering contribution to the mode intensity due to the adsorbed molecules as observed in the case of alkyl monolayer formation on H-terminated surfaces[32]. HREELS studies of H-terminated Si(100) surfaces have indicated significant impact scattering contributions to the Si–H stretch intensity even in the specular scattering geometry[33,34].
Use of the atomically flat hydroxylated Si(100) surface made it possible to follow the silanization reactions at the molecular scale with scanning tunneling microcopy. STM images corresponding to each of the HREEL spectra were acquired and are shown inFigs. 4 and 5. As for the spectra, the STM images were acquired after annealing. Unannealed samples did not give stable images, likely due to physisorbed molecules that could freely transfer between the tip and sample. For both of the images inFig. 4 (i.e b5×104L exposure) the 2×1 dimer rows are
observed clearly in the STM images. Compared with the hydroxylated Si (100) image, dangling bond features are no longer clearly identified. In
Fig. 4A, a very small density (0.003 ML) of bright features (2–3 Å in apparent height, examples highlighted by circles) is observed on the surface. In addition a larger number (~0.08 ML) of smaller features (~0.5–1 Å in height, examples denoted by squares) are observed along the dimer rows. Based on the corresponding HREELS spectrum (Fig. 3a) which indicates a significant reaction of silanes with the hydroxylated surface at this exposure, it appears reasonable to assign both of these types of features to adsorbed silane molecules. Significant portions of the dimer rows remain unreacted, consistent with the strong Si–H and and Si–O–H features in the spectrum. After further exposure of GPDMES at 0.09 mTorr for 10 min and annealing, the STM image inFig. 4B shows a higher density of the brighter features but the coverage remains low, consistent with the HREELS results (Fig. 3b). The images inFig. 4indicate that at low coverages the reaction of GPDMES with the surface proceeds randomly with no evidence of clustering or molecular island formation. The STM images at higher exposures (Fig. 5) are quite different from those inFig. 4. The dimer rows of the (2 × 1) surface are no longer resolved. Molecular features are found to cover most of the surface with comparatively fewer depressions indicating parts of the surface that remain unreacted. From the representative height profile taken fromFig. 5A the apparent height difference between the depressions and protrusions is seen to be ~4–6 Å. Finally, an exposure of the surface to GPDMES for 1000 min. at 10 mTorr yields a surface that is almost completely covered with molecular features with only a low density of unreacted pinholes remaining as seen inFig. 5B. The height profile is similar to that forFig. 5A, with the height of the protrusions slightly increased and some of the depressions filled in. As a result the average “height” (measured relative to the depressions) is seen to increase from 3 to 4 Å. The observation that the surface is almost completely covered by silanes inFig. 5B is consistent with the fact that no O–H stretch mode is observed in the spectrum corresponding to this surface (Fig. 3d).
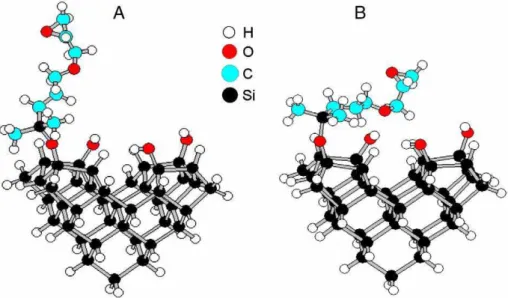
In order to gain further insight into the structures formed when GPDMES reacts with the hydroxylated Si(100) surface we have per-formed semi-empirical (AM1) calculations[35]using a cluster model of the surface. Two optimized structures are shown inFig. 6. The total energies of these structures have been calculated relative to the unreacted system (i.e. an isolated GPDMES molecules plus unreacted cluster). Upon reaction, the H from a hydroxyl group combines with the ethoxy leaving group to form an ethanol molecule (not shown) along with the depicted reacted structures. The reaction to form the vertical bonding geometry (Fig. 6A) is calculated to be exothermic by 9.8 kcal/mol. The more
Fig. 3. HREEL spectra upon exposure of the hydroxlated Si(100) surface to various exposures of GPDMES and annealing to 200 °C for 5 min.
horizontal geometry depicted inFig. 6B is found to be slightly lower in energy (13.1 kcal/mol). Examination of this structure shows that the ether oxygen is oriented directly over an adjacent hydroxyl group in the
cluster at a distance of 2.2 Å. Thus it is reasonable to attribute the additional stability of this configuration to a hydrogen bonding interaction. Another horizontal geometry (not shown), involving an
Fig. 5. Constant current STM images (−3.7 V, 30 pA, 25 × 20 nm2) after exposure to GPDMES; A) 0.09 mTorr for 1100 min., B) 10 mTorr for 1000 min. Representative height profiles are shown under the images.
Fig. 4. Constant current STM images (−3.7 V, 30 pA, 25 × 25 nm2) after exposure to GPDMES; A) 0.01 mTorr for 10 min., B) 0.09 mTorr for 10 min. Representative height profiles are
shown under the images. Examples of two types of observed features attributed to adsorbed silane molecules (in A) are highlighted by circles and squares.
H-bonding interaction of the oxygen in the epoxy ring with a hydroxyl group was found to have a binding energy of 11.8 kcal/mol, more stable than the vertical geometry but less than for the configuration inFig. 6B. The conclusion from the AM1 calculations is that the reacted GPDMES can be further stabilized by adopting horizontal configurations allowing H-bonding interactions with hydroxyl groups.
A comparison of the STM data inFigs. 4 and 5indicates that the apparent height of the molecular features increases with coverage. In the initial stages of adsorption many of the molecular features exhibit small apparent heights, consistent with the horizontal H-bonded geometry depicted inFig. 6B. As the coverage is increased more molecular features with larger apparent heights are observed, consistent with more of the molecules adopting the vertical bonding geometry. The small energy cost associated with breaking the hydrogen bond is compensated for by the ability of this configuration to accommodate a greater number of adsorbed species.
It is apparent from the HREELS and STM data that high exposures are required in order to obtain substantial coverage of reacted silanes on the surface. This observation of a low probability of reaction at room temperature is consistent with the reaction being activated. The presence of an activation barrier for this reaction is expected as it requires breaking of the Si–O bond between the ethoxy group and the molecule along with breaking of the O–H bond in the surface hydroxyl group in order to form a covalent link between the silane molecule and the substrate and evolve ethanol. In fact, we have observed that, in contrast to the behavior on hydroxylated Si(100), gas phase exposure of GPDMES to chemically oxidized silicon surfaces at room temperature does not result in covalent bond formation. The higher reactivity of the hydroxylated Si(100) surface towards silanes is likely related to the different local environments of the hydroxyl group on the two surfaces. Compared with the oxide surface, the oxygen atom in the silanol of hydroxylated surface is more nucleophilic. This high nucleophilicity can favorite the nucleophilic attack of the oxygen atom on silicon and thus increase the reactivity, similar to the mechanism of amine catalyzed silanization[8]. The slightly lower frequency of the O–H stretch mode on the hydroxylated surface (3670 cm− 1 as
compared with 3720 cm− 1on SiO
2) suggests that the O–H bond is
slightly weakened on hydroxylated silicon and may be more reactive. 4. Summary
The adsorption and reaction of GPDMES on hydroxylated Si(100) was investigated by using HREELS and STM. The atomic scale flatness as
well as the absence of an insulating oxide layer enabled the reacted surface to be imaged at the molecular scale using STM. The HREELS spectra suggest that the GPDMES reacts with surface hydroxyl group at room temperature in the absence of water, resulting in the formation of Si–O–Si bonds. The rate of reaction is found to be quite low with exposures ~103L necessary to achieve even small (~0.05 ML)
cov-erages. At low coverages, the GPDMES molecules appear to adopt a horizontal bonding geometry driven by the formation of hydrogen bonds between the ether group in the molecule and surface hydroxyl groups. At high exposure (3×10⁸L), the surface was almost completely
covered with only small pinholes visible in the STM images. STM height profiles suggest that the molecules stand more vertical at higher coverages. Investigations of the reactivity of various silanes, varying the number of alkoxy silanes as well as the nature of the terminal group, with the hydroxylated Si(100) surface are currently in progress and are expected to contribute further insight into the nature of gas phase silanization reactions.
References
[1] A.Y. Fadeev, T.J. McCarthy, Langmuir 16 (2000) 7268.
[2] E.T. Vandenberg, L. Bertilsson, B. Liedberg, K. Uvdal, R. Erlandsson, H. Elwing, I. Lundstrom, J. Colloid Interface Sci. 147 (1991) 103.
[3] R.L. Kaas, J.L. Kardos, Polym. Eng. Sci. 11 (1971) 11.
[4] J.W. De Haan, H.M. van den Bogaert, J.J. Ponjee, L.J.M. Van De Ven, J. Colloid Interface Sci. 119 (1986) 591.
[5] F.D. Osterholtz, E.R. Pohl, J. Adhesion Sci. Technol. 6 (1992) 127. [6] W. Yoshida, R.P. Castro, J.-D. Jou, Y. Cohen, Langmuir 17 (2001) 5882. [7] J.P. Blitz, R.S.S. Murthy, D.E. Leyden, J. Am. Chem. Soc. 109 (1987) 7141. [8] J.P. Blitz, R.S.S. Murthy, D.E. Leyden, J. Colloid Interface Sci. 126 (1988) 387. [9] I. Haller, J. Am. Chem Soc. 100 (1978) 8050.
[10] U. Jonsson, G. Olofsson, M. Malmqvist, I. Ronnberg, Thin Solid Films 124 (1985) 117. [11] A. Hozumi, Y. Yokogawa, T. Kameyama, H. Sugimura, K. Hayashi, H. Shirayama, O.
Takai, J. Vac. Sci. Technol. A19 (2001) 1812.
[12] H. Sugimura, A. Hozumi, T. Kameyama, O. Takai, Surf. Interface Anal. 34 (2002) 550. [13] J. Dong, A. Wang, K.Y. Simon Ng, G. Mao, Thin Solid Films 515 (2006) 2116. [14] A.S. Anderson, A.M. Dattelbaum, G.A. Montano, D.N. Price, J.G. Schmidt, J.S.
Martinez, W.K. Grace, K.M. Grace, I. Swanson, Langmuir 24 (2008) 2240. [15] H. Ibach, H. Wagner, D. Bruchmann, Solid State Commun. 42 (1982) 457. [16] Y.J. Chabal, S.B. Christman, Phys. Rev. B 29 (1984) 6974.
[17] X.-L. Zhou, C.R. Flores, J.M. White, Appl. Surf. Sci. 62 (1992) 223. [18] M. Chander, Y.Z. Li, J.C. Patrin, J.H. Weaver, Phys. Rev. B48 (1993) 2493. [19] M.K. Weldon, B.B. Stefanov, K. Raghavachari, Y.J. Chabal, Phys. Rev. Lett. 79 (1997) 2851. [20] S. Okano, A. Oshiyama, Surf. Sci. 554 (2004) 272.
[21] A. Bilic, J.R. Reimers, N.S. Hush, Surf. Rev. Lett. 2 (2004) 185.
[22] B.R. Trenhaile, A. Agrawal, J.H. Weaver, Appl. Phys. Lett. 89 (2006) 151917. [23] U. Maskos, E.M. Southern, Nucleic Acids Res. 20 (1992) 1679.
[24] J.P. Cloarec, N. Deligianis, J.R. Martin, I. Lawrence, E. Souteyrand, C. Polychronakos, M.F. Lawrence, Biosens. Bioelectron. 17 (2002) 405.
[25] R. GhoshMoulick, X.T. Vu, S. Gilles, D. Mayer, A. Offenhausser, S. Ingebrandt, Phys. Status Solidi A 206 (2009) 417.
[26] L. Andersohn, U. Kohler, Surf. Sci. 284 (1993) 77. [27] D.B. Skliar, B.G. Willis, J. Phys. Chem. C 112 (2008) 9434.
[28] C.J. Pouchert, the Aldrich Library of Infrared Spectra, second ed., Milwaukee, Wisconsin, pp. 1313.
[29] F. Buzek, J. Rathousky, J. Colloid Interface Sci. 79 (1981) 47. [30] L.D. White, C.P. Tripp, J. Colloid Interface Sci. 232 (2000) 400.
[31] H. Ikeda, Y. Nakagwaw, M. Toshima, S. Furuta, S. Zaima, Y. Yasuda, Appl. Surf. Sci. 117/118 (1997) 109.
[32] B.J. Eves, Q.Y. Sun, G.P. Lopinski, H. Zuilhof, J. Am. Chem. Soc. 126 (2004) 14318. [33] J. Eggeling, G.R. Bell, T.S. Jones, J. Phys. Chem. B 103 (1999) 9683.
[34] A. Lafosse, D. Caceres, M. Bertin, B.P. Marinkovic, R. Azria, Surf. Sci. 578 (2005) 102. [35] M.J.S. Dewar, E.G. Zoebisch, E.F. Healy, J.J.P. Stewart, J. Am. Chem. Soc. 107 (1985)
3902.