Bridging the "Valley of Death" in stratified medicine: Commercializing molecular diagnostics in oncology
MASSACHUSETTS INSTITUTE
By OF TECHNOLOGY
Joshua Copp
JUN
14
2012
A.B. Applied Mathematics
LIBRARIES
Harvard University, 2007
ACH
SUBMITTED TO THE MIT SLOAN SCHOOL OF MANAGEMENT IN PARTIAL FUFILLMENT OF THE REQUIREMENTS FOR THE DEGREE OF
MASTER OF BUSINESS ADMINISTRATION
AT THE
MASSACHUSETTS INSTITUTE OF TECHNOLOGY
JUNE 2012
@ 2012 Joshua Copp. All Rights Reserved.
The author hereby grants to MIT permission to reproduce and to distribute publicly paper and electronic copies of this thesis document
in whole or in part in any medium now known or hereafter created.
Signature of Author:
MIT Sloan School of Management
May 11, 2012
Certified By:
Ernst R. Berndt Louis E. Seley Professor in Applied Economics, MIT Sloan School of Management Thesis Supervisor Read By:
Mark Trusheim Visiting Scientist, MIT Sloan School of Management Thesis Reader
Accepted By:
Maura Herson Director, MBA Program MIT Sloan School of Management
Bridging the "Valley of Death" in stratified medicine: Commercializing molecular diagnostics in oncology
By
Joshua Copp
Submitted to the MIT Sloan School of Management on May 11, 2012 in partial fulfillment of the requirements for the degree of Master of
Business Administration
Abstract
Historically, the development of molecular companion diagnostics in oncology has underwhelmed the expectation of the medical field since the successful mapping of the human genome a decade ago. There have been several highly successful developments (Her2-neu, Genomic Health, etc.), but not the widespread revolution in clinical practice expected at the turn of the century. The primary goal of this document is to investigate the economics driving molecular diagnostics and its relationship with strategic decisions in developing a diagnostic technology.
The document begins with a broad analysis of the funding environment for molecular and esoteric diagnostics in oncology. Following a discussion of funding sources and current trends, the second section reviews the nature of the projects that funding supports. This is accomplished through a set of detailed case studies of Genomic Health and Immunicon to compare and contrast the strategic decisions that led to value creation events for both companies. Finally, the third section abstracts away from specific cases to develop a strategic analytic framework for evaluating the potential risk-adjusted NPV for a new diagnostic technology. Sensitivity analyses are conducted in addition to a discussion of current events that may change the structure of the underlying decision tree.
The conclusion revisits the topics discussed in the first three sections, connecting the implications of funding on different strategic decisions and chances of success. Areas for further investigation both for inputs to the current model proposed, as well as for more refined versions of the development model are discussed.
Thesis Supervisor: Ernst R. Berndt
Title: Louis E. Seley Professor in Applied Economics Thesis Reader: Mark Trusheim
Acknowledgements
My two years at MIT Sloan have been extremely rewarding, both for the educational value and the diversity and caliber of my classmates. I am indebted to those who have shaped this experience, both professionally and personally.
This thesis would not have happened without the guidance and support of my two thesis advisors, Ernie Berndt and Mark Trusheim. Their experience, rigor and passion for the topic were invaluable in addressing and tackling a growing issue in the field of diagnostics. It has been a pleasure to work with them and learn a tremendous amount through the course of this thesis. They are both extremely valuable assets to MIT and the public debate on personalized medicine, and I hope to continue our relationship beyond the walls of MIT.
Thank you again to those who have helped shape this thesis at one stage or another. Laura Furstenthal, your leap of faith during the summer to introduce a newly hired intern to the fascinating world of diagnostics provided the spark that would become this thesis. Heather Vital, Jerel Davis, and Katie Bach, your critical thoughts, red ink reviews and time are all cherished contributions to this thesis.
Finally, I thank my wife, Aline, for her patience and encouragement over the past two years and throughout the thesis-writing process. Her steady support was invaluable to both the completion of this thesis, and my sanity over the past several months.
Contents
A b stra ct...3
Acknowledgements...5
1 . Intro d u ctio n ... 9
2. Funding for Oncology in Stratified Medicine ... 11
2.1 Venture Capital ... 11
2.2 Strategic Partners: Pharmaceutical and Biotechnology Firms... 16
2.3 National Cancer Institute: SBIR and STTR Grant Programs... 18
2.4 Foundations and Non-Profits...19
2.5 Private payers and insurers... 20
2.6 Conclusion and considerations for funding sources ... 21
3. Value drivers for independent development of a diagnostic ... 22
3.1 The case of Genomic Health ... 22
3.2 The case of Immunicon/Veridex LLC... 27
3.3 Genomic Health and Immunicon: Success or Failure?... 33
3.4 Additional activity in the high value molecular diagnostic space ... 36
4. Decision analytic model to evaluate strategic options in oncology diagnostics... 39
4.1 Decision tree model formulation and structure ... 40
4.2 M odel parameters and values ... 44
4.3 Base case summary... 55
4.4 Sensitivity analysis of strategic outcomes ... 55
4.5 Market events and strategic pathway effects ... 61
4.6 Final note on decision tree analysis: perspective matters... 65
5. Discussion and Conclusion...67
R efe re n ce s ... 69
Appendix I - 2010 Venture Capital Investment Summary... 82
Appendix lI - Thomson VentureXpert Industry Codes and Key W ords ... 83
Appendix Ill - Simplified example of clinical utility ... 84
Appendix IV - Genomic Health fundamental com parable data ... 85
Appendix V - Immunicon-Veridex License Agreement Summary ... 86
Appendix VI - Reproduced press releases... 88
1. Introduction
Stratified medicine, defined as using specific patient population characteristics to guide clinical decisions, has the potential to revolutionize the delivery of oncology therapeutics through enhanced response rates, superior risk stratification, and elimination of trial-and-error delivery of therapym'. However, for the past decade, development and adoption of clinically validated molecular diagnostics that enable patient stratification for oncology has been slow 9. A lack of molecular pathway knowledge, delayed regulatory guidance, misaligned economics and an opaque reimbursement landscape have all contributed to the slow development of targeted therapies . Recent increases in investment and partnership activity by pharmaceutical and diagnostic manufacturers suggest that clinical adoption of molecular diagnostics may accelerate in the future, but many diagnostic technologies are still multiple years away from regulatory approval and clinical adoption9-.
With such a promising technological progress, one must ask why there has not been significant disruption of clinical practice by molecular diagnostics, particularly in a space so scrutinized as oncology. The research sector has not been inactive, with nearly 270,000 articles related to biomarkers published in PubMed over the period 2000-200999. Additionally, while 146 therapies are actively marketed as of 2011, only 30 have a pharmacogenomic biomarker in their label m,. It is clear that only a few diagnostic companies have managed to bridge the 'valley of death' - the period between company formation and commercial adoption. It is rare to see an industry so poised for significant innovation and yet not seeing significant venture and entrepreneurial activity rapidly pushing the boundaries of industry practice.
The uncertainty over reimbursement and the associated economic risk have been leading factors of this slow development of clinically validated molecular diagnostic technologies1 9' 11. Development of a diagnostic test will only occur if the potential economic gains are in-line with the clinical benefit and the risk inherent in the development of the new technology. For this thesis, I examine the economic dynamics of stratified medicine from the perspective of the diagnostic manufacturer, specifically in the context of 'high-value' molecular diagnostics. For the purpose of this discussion, 'high-value' indicates a list price that is on the order of several thousand dollars, and a technology often involving complex, multivariate algorithms to interpret molecular data.
Specifically, this thesis analyzes the following:
(1) Funding environment for a 'high-value' diagnostic: This section examines a fundamental question: for the new project, what resources are already available to bridge the gap from academic spin-out or newly issued patent to commercial viability? In this section I review the major sources of funding specific to oncology diagnostic development, activity in recent years, and the benefits and downsides of
using any one source of capital. Rather than restricting sources of capital to a traditional discussion of venture capital versus strategic partners, I examine alternative sources not often discussed and the potential advantages each source may provide.
(2) Value drivers for an esoteric molecular diagnostic: The second section examines the strategic decisions that ultimately determine whether or not a diagnostic manufacturer can achieve commercial adoption. Specific case examples for Genomic Health and Veridex/Immunicon are used to compare and contrast strategic differences in diagnostic development. Key decision variables in diagnostic development are identified, including factors such as development timeline, clinical validity, clinical trial requirements and commercial utility. Additional vignettes are discussed at the close of the chapter to highlight different strategic elements that can influence the development of a diagnostic.
(3) Decision analytic model of strategic options: Based on the discussion of where the money comes from (chapter 1) and the projects it has funded (chapter 2), I develop a decision analytic model to evaluate the sensitivity of key strategic decision points and diagnostic economic value to elements of diagnostic development. In the context of the model, I consider how value inflection points develop at different stages, and how this can impact value. Following an analysis of the sensitivities in the model, I provide a discussion of current trends to highlight where opportunities
may be developing.
Note for the reader: For the purpose of the analysis contained in this thesis, the perspective largely pertains to the United States. Furthermore, the discussion is largely focused on commercialization of diagnostics within oncology. However, I would expect one would be able to translate some of the strategic factors highlighted by this analysis to environments outside the United States, and/or across different disease classes.
2. Funding for Oncology in Stratified Medicine
Always at the top of mind for the entrepreneur or new project manager is how to both gain access to, and efficiently use, funding. This is particularly relevant for new ventures in life sciences, where development costs to commercialization can be a significant investment. While technical development of a molecular diagnostic is significantly less than a therapeutic at $5-50 million and only takes about 3-5 years , funding a venture of this nature will still require resources beyond the means of many entrepreneurs. To evaluate the market for funding these types of ventures, I review major sources of funding and activity over recent years.
Each funding source carries its own advantages and disadvantage, and no one source of capital will likely be sufficient to bridge the gap to commercialization. For example, while venture capital is the most traditional source of capital, trends in funding indicate investors are more receptive to providing capital at later stages of development. Thus, funding from grants, strategic partners, or foundations will likely be necessary to get a new technology to commercialization. Furthermore, grant and foundation funding is typically non-dilutive, providing an extra incentive for securing capital from these sources. This section focuses on current trends and relative advantages of sources of capital, beginning with the most traditional funding before moving into less traditional avenues of funding.
2.1 Venture Capital
Venture capital is almost always a viable funding source in life sciences. Of $21.8 billion invested during 2010, biotechnology and medical devices received the second and fourth largest amount of investment, respectively (Appendix 1) 83. While some researchers have
investigated the interest in and success of venture financing for life science firms7, in this
section of the analysis I focus on the activity specifically from the perspective of oncology diagnostics. My intent is to characterize the trends in venture capital investment for a new venture developing a new diagnostic technology.
Discussion of data and methods
Using Thomson VentureXpert, I initially screened for companies in the life sciences, based on the industry codes outlined in Appendix II. Additionally, the initial screen required that a company have received an investment during the period 01/01/1999 to 12/31/2010. This first screen yielded a list of 1,557 US-based companies. This list was further refined with key words, noted in Appendix II, to identify companies in the oncology diagnostics sector. Finally, a review of each company was conducted to ensure it met the category of interest. Filtering in this way yielded a final list of 131 companies involved in diagnostics for oncology. Where possible, data was supplemented from other sources, however it must be noted that not all deals are necessarily made public and even if announced, the details for any one deal may not be released.
Generally speaking, a diagnostic needs to have a platform on which to run, the kit or set of reagents for this test, and a lab in which to perform the test. In order to further characterize investment trends, the companies were divided into three separate groups:
" Platforms: Companies manufacturing platforms on which targeted diagnostics could be developed fall into this category. These can be in several technology applications, such as sequencers or high-throughput immunohistochemistry machines. Examples include Illumina, Falcon Genomics, and Celerus Diagnostics.
* Services: This category primarily comprises companies that provide tests and testing services through CLIA-certified laboratories. Even if it provides an innovative test, a company using their own CLIA lab as the commercialization channel is included in this category as it is not strictly a manufacturer of a test kit. Examples include Myriad Genetics, Genomic Health, and Clarient.
* Kits: These are companies focused on the manufacturing of testing kits with FDA approval, then purchased by clinical testing laboratories. They are differentiated from the Services category primarily in that they are not vertically integrated with the lab, instead serving as a primary supplier to the reference laboratory. Examples include Allegro Diagnostics, Saladax Biomedical, and Onconome.
Different business models have been evolving in the space, and this stratification is undertaken to give an indication of where venture investors have historically shown interest.
Results and conclusions on investment trends
Based on the 131 oncology diagnostic companies identified for the analysis, a total of 385 investments were analyzed over the period 01/01/1999 to 12/31/2010 totaling approximately $3.8 billion dollars, adjusted for inflation and measured in 2010 dollarsa. Figure 1 shows aggregate deal activity (number of deals) and deal volume (in dollars) from 1999 to 2010. Overall deal activity increased from an average of 24 deals per year for the period 1999 through 2004 to over 40 deals per year from 2004 through 2010, a 73% increase from the first period to the next. Additionally, it is interesting to note that while the technology boom and bust of the early 2000's affected both deal activity and volume quite dramatically, there was only a slight dip to both deal activity and volume in the most recent cycle from 2006-2008, with activity recovering above 2006-2007 levels by 2010.
Figures 2 and 3 capture the breakdown of deal activity by the three groups of companies described above. Overall, Platforms have received the largest aggregate amount of investment, as well as the highest number of investments. Services, however, have seen an increasing level
of investment activity, both in aggregate dollar amount invested and number of investments per year. Kits have attracted the least investment activity over the period.
Figure 1: Aggregate Deal Activity and Volume
Total Deal Activity Total Deal Volume
$700 $600 $~500 $400 $300 $200 $100 $- - 2 2 2 0 0 0 0 0 1999 2000 2001 2002 2003 2004 2005 2006 2007 2008 2009 2010
Source: Author's calculations, based on data from Thomson VentureXpert
Figure 2: Deal Activity by Company Business Model
35 30 25
20 15
Deal Activity by Company Focus
- Platform
- Services
-Kits
1999 2000 2001 2002 2003 2004 2005 2006 2007 2008 2009 2010
Source: Author's calculations, based on data from Thomson VentureXpert
70 60 s0 40 30 E Z 20 10 0 1999 2000 2001 2002 2003 2004 2005 2006 2007 2008 2009 2010 0 C 2 43
Figure 3: Deal Volume ($MM) by Company Business Model
Deal Volume by Company Focus $500 $450 $400 $350 $300 -- Platform $250 -- Services C $200 Kits $150 2 $100 $50 1999 2000 2001 2002 2003 2004 2005 2006 2007 2008 2009 2010
Source: Author's calculations, based on data from Thomson VentureXpert
While it is useful to analyze the historical trend of any one of the three categories, care must be taken when drawing comparisons between the different categories shown in the graphs. This is due to the fact that each has a fundamentally distinct investment hypothesis and business model. For example, platforms deliver value to laboratories by providing a large menu of tests that can be run on their technology, representing a recurring set of revenues that pay back the investment in the platform. Furthermore, a large proportion of companies focused on platform technologies cater only to the Research Use Only market (academic labs and pharmaceutical research divisions), and have yet to pursue FDA approval or clinical adoption. Services, by contrast, typically focus on the clinical space, and must prove the clinical utility of their test(s) to both payers and physicians. Both the regulatory requirements for catering to the clinical space and a larger sales and marketing to 'detail' the end customers and promote test adoption constitute a different investment hypothesis when compared to platforms.
Returning to the historical trends for platforms, there are several hypotheses that could describe this investment pattern. For one, the successful mapping of the human genome at the turn of the century certainly helped spur investor interest in the frontier of diagnostic and therapy development platforms. Furthermore, continued scientific discoveries linking genetics to disease have kept genomics a hot topic in biotechnology. Finally, platforms are not restricted to any one indication. It is possible to run tests for oncology, infectious diseases, cardiology, etc. on one platform. For the purpose of this analysis, I have restricted the base set of platform companies to those with specific mention of or applications for oncology.
The growth in deal activity and annual investment in services is particularly striking. Both the number of deals and average aggregate amount invested has more than doubled, going from
an average of 7 to 15 deals per year and an average amount invested of $48 to $106 million, respectively. Venture investment has certainly increased as more assays have gained clinical adoption (e.g. Genomic Health's Onco type Dx), and the FDA has signaled they are open to the introduction of these tests (e.g. Agendia's Mammaprint).
In addition to the analysis by company type, I also stratified companies by the stage at which they receive investment. The goal of this analysis is to determine if there is any indication of investor preference for investment at a particular stage of company development. This is particularly relevant given the launch of the NCI Phase Il Bridge grant program in 200958. Intended to serve as a 'bridge' to outside investment, the program is designed to provide up to $3 million over 3 years to support the next stage for existing Phase 11 projects that aren't quite yet ready for outside investment12. This would provide a preliminary indication that investor appetite may be shifting towards those companies that are in a later stage of development.
Figures 4 and 5 show deal activity and volume, similar to Figures 2 and 3, but broken down by investment stage. The stages are determined by definitions from Thomson VentureXpert. While early stage investment activity has remained relatively constant over the past 5 years at 10 average deals per year (2006-2010) later stage and expansion investment activity has significantly increased from seven expansion and eight later stage in 2006, to 14 expansion and 24 later stage in 2010. Multiple factors may have driven this increase, from a shift in investor appetite to the general maturing of companies in the space.
Figure 4: Deal Activity by Company Stage
Deal Activity by Company Stage
30 25 .n 20 - Startup/Seed .- Early Stage S152 -Expansion z 10 -Later Stage 5 1999 2000 2001 2002 2003 2004 2005 2006 2007 2008 2009 2010
Figure 5: Deal Volume ($MM) by Company Stage Deal Volume by Company Stage
$450 -$400 -$350 $300 - - Startup/Seed $250 -Early Stage $200 -ai ~ $200 -Expansion $150 --Later Stage $1 1999 2000 2001 2002 2003 2004 2005 2006 2007 2008 2009 2010
Source: Author's calculations, based on data from Thomson VentureXpert
Overall, the 73% increase in deal activity and 44% increase in funding volume from 1999-2004 to 2005-2010 represent a strong interest from investors in the sector. Venture capital may present a viable avenue for the entrepreneur attempting to commercialize a diagnostic targeting personalized cancer treatment, and will most likely be needed to fully bridge the gap from research laboratory to clinical adoption.
2.2 Strategic Partners: Pharmaceutical and Biotechnology Firms
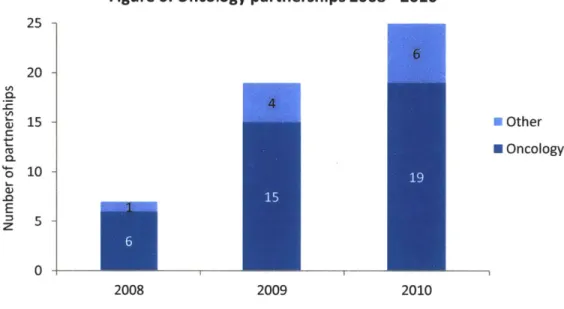
A strategic partnership with a pharmaceutical or biotechnology firm is the most commonly discussed route to date for the commercialization of a diagnostic in stratified medicine. The landmark development of HercepTest TM by Dako in partnership with Genentech for the administration of trastuzumab (Herceptin) has served as an example of the initial development efforts for companion diagnostics. More recently, the approval of Zelboraf for the treatment of metastatic melanoma patients with active BRAF V600E mutations highlights the increasing partnership activity between therapeutics and manufacturers of molecular diagnostics8 7'95. From the perspective of the diagnostic entrepreneur, how is it possible to compete with an established diagnostics manufacturer such as Roche or Dako for funding from a large pharmaceutical or biotechnology firm? The historical trend in activity, as described by PriceWaterhouseCoopers in their Diagnostics 2011 report, points to a strong case for specialized knowledge. As shown in Figure 6, there has been a significant increase in the partnership activity between therapeutic manufacturers and diagnostics companies for the development of companion diagnostics, with oncology maintaining the lion's share of these partnerships. Additionally, the partnerships being formed in recent years are not only with
dominant diagnostics manufactures, but also with medium sized firms or niche specialists such as Qiagen or MDxHealth9s
Figure 6: Oncology partnerships 2008 - 2010
25 -20 -0 15 -U Other C H Oncology 10 -E 0 2008 2009 2010 Source: PWC Diagnostics 2011
While the increased partnership activity with medium and smaller companies is a positive indicator for a new venture with unique topic expertise, this activity has been completely concentrated in the development of companion diagnostics. Companion diagnostics, strictly speaking, typically involve the co-development of a diagnostic and therapeutic for a newly discovered cohort of patients based on the biomarker. This means that there is an economic advantage of patent protection for the therapeutic, in addition to the novelty of the diagnostic test.
From the perspective of the entrepreneur, this may not present the most attractive path forward, as the value split between the drug and diagnostic is still heavily tilted in favor of the pharmaceutical company. The marginalization of value captured by the diagnostic test kit is a strong disincentive for development, and historically it seems diagnostic manufacturers have had a difficult time capturing the economic equivalent of the clinical value they deliver by dictating treatment decisions. For example, a Her2-neu test will be reimbursed for $400-800, constituting a market of approximately $250 million in testing every year, while Herceptin has now become a multi-billion dollar drug.
However, from the perspective of the pharmaceutical firm, this arrangement presents the potential for a 'niche-blockbuster' - i.e. a drug that, while restricted to a fraction of the cancer population, commands a significant price premium due to higher response rates and/or better treatment options. As noted by multiple authors to date95
attractive model for drug developers going forward, but the value equation between diagnostic and therapeutic will have to shift to encourage innovation on both sides of companion treatment.
2.3 National Cancer Institute: SBIR and STTR Grant Programs
In 1982, the Small Business Innovation Development Act established the Small Business Innovation Research (SBIR) and Small Business Technology Transfer (STTR) grant programs. This act stipulated that for federal agencies with research budgets greater than $100 million, 2.5% and 0.3% of their funding is to be set aside to fund SBIR and STTR grants, respectively128. The SBIR grant program is designed to provide funding for small business concerns with the explicit intent to create viable commercial entities from federal R&D dollars. The STTR program is similar to the SBIR program, but differs in that the principal investigator for the research project does not have to be primarily employed by the business concern, and the business concern must have a formal agreement for collaboration with the research partners at associated universities and/or non-profits128.
As of 2010, the NC SBIR and STTR programs had allocated budgets of $100 million, ranking them among the top five SBIR and STTR grant programs administered under the National Institutes of Health128. The funds are administered through the grant process in one of three phases, and are focused on bridging the gap between research lab and commercial viability. Specifically, they include:
Table 1: Funding Details for NCI SBIR and STTR Programs
Objective SBIR Funds SBIR Time STTR Funds STTR Time Phase I Feasibility study $150,000 6 months $100,000 1 year Phase Il R&D investment $1,000,000 2 years $750,000 2 years Phase II Bridge R&D gap funding $1-3,000,000 1-3 years n/a n/a
Source: NC SBIR website http://sbir.cancer.gov/about/structure/
The SBIR/STTR grant programs at the NCI are attractive first and foremost because they are non-dilutive. Unlike standard private venture financing, no equity stake is awarded for the funding provided. This is significant not only because it improves the entrepreneur's economics, but also because the funding can be used as leverage to secure additional venture financing from more standard sources. According to the NCI, on average funds provided through the STTR and SBIR programs have been leveraged for 2.3 times the amount of the grant in additional forms of financing128.
However, the program is not without drawbacks. First, there are only select dates on which one can apply for the grant, and the review process can take several months. Second, the process is rather competitive, and if the grant does not score well with reviewers, this could
cost many more months in rewrite, wait and resubmission time. From initial grant submission, a year or two could easily pass before funding is awarded - and there is no guarantee that will be. For many in the field of stratified medicine, the industry is moving too fast to lose a year or two in the grant writing and approval process.
Third, the above phases are not independent: Phase 11 depends on successful completion of Phase 1. Fourth, the grant writer and entrepreneur must realize that the NCI identifies areas of particular interest for investment, including companion diagnostics, and in 2010 committed 24% of grants to those programs128 . This additional signal from the NCI can potentially reduce the utility of the program to potential applicants if they don't fit within the 24% and reduce the overall applicability of the grants to the field.
Finally, though the grants are generous, it is highly unlikely that a new venture can get to clinical adoption solely on NCI SBIR/STTR grant funding. It may provide enough funds to conduct a retrospective validation study for an assay or biomarker, but a prospective clinical trial will cost significantly more. For example, Genomic Health, which I will discuss in more detail below, spent $42 million in R&D before their IPO and commercial launch of their breast cancer assay. Additionally, there can be a lag between the award date, and the delivery of funds, either because of process delays or because the grant awarded is staged over multiple periods. As such, additional sources of funding will be needed to get an assay to commercial adoption.
2.4 Foundations and Non-Profits
To date, no significant investigation has been made as to the impact of foundation and non-profit funding for the promotion of new technologies in oncology, despite the increasing involvement of these institutions in funding research and venture development. Foundations are particularly relevant to several disease types (cancers, neurological disorders, etc.) as the major organizations often have significant resources at their disposal. For example, the Michael J. Fox Foundation supported $25.9 million in research for Parkinson's disease in 2008 in the US, and the Susan G. Komen Foundation offered $48.5 million in grants supporting breast cancer research in 201 106
Case examples demonstrate definitive interest from many foundations in targeted therapeutics, though diagnostics have yet to gain significant interest. For example, in 2011 the Susan G. Komen Foundation awarded two promise grants worth $6.5 million, their largest award. Both focused on personalized medicine and targeted therapies in breast cancer. Furthermore, many of Komen's smaller research grants awarded in 2011 are focused on biomarker discovery. It is likely that grant awards will be largely focused on the development of targeted therapies, more than the development of diagnostics for existing therapies.
2.5 Private payers and insurers
Over the past several decades the funding and development of healthcare innovation has lacked one participant with a large vested interest: the payer. Initially, insurers demonstrated an interest in managing the risk of their patients, as with the Health Insurance Plan (HIP) of Greater New York. In 1963, the HIP sponsored one of the first extensive investigations into the clinical benefit of breast cancer screening82. Since that time, however, payer activity in the space has declined significantly.
One hypothesis for this relative lack of interest is that health insurers moved from managing risk to pricing risk. They have essentially adopted an actuary's approach to controlling health costs: the inherent risk of an adverse event is exogenous to their control, and therefore they must pool a large enough number of patients whose premiums will offset the cost of adverse events. In reality, most individuals understand this is untrue, as health risk is affected by exercise level, diet, and a multitude of other factors. As the movement for better management of health by the individual takes root, one may see the reemergence of the payer as a funder for health innovations that reduce the health risk for patients through behavior and habit modifications.
Reimbursement and coverage decisions at private and public payers are increasingly driven by the ability of a new technology to reduce health risk and system cost. Specifically, the decision to reimburse or not for many payers is fundamentally driven by a pharmacoeconomic analysis of the benefit derived from a drug or device. In its simplest form, this entails an analysis demonstrating how the combination of downstream cost reduction and improvement in quality of life combine such that the price charged is less than (and more often significantly less than) the health-economic value delivered through the intervention. These negotiations can often be difficult in a system with privatized health insurance like the United States. Private payer populations will vary from one insurer to another, potentially presenting different health economic arguments based on the insured populations. This, along with other factors, can affect the extent to which a private payer can appropriate the benefits derived from the new technology, given their insured population.
Given the importance of pricing and the increasing uncertainty over reimbursement, a private insurer as an investor could present multiple advantages. For one, the insurer could provide expert knowledge of pharmacoeconomics and more accurate data on treatment costs and productivity losses for health economic arguments. In an era where diagnostics manufacturers are lobbying for a value-based rather than cost-based approach to reimbursement having an insider's perspective on how to prove and capture that value may greatly enhance the likelihood of securing favorable reimbursement rates. Second, there would be an implicit signal to the market that at least one payer considers the product valuable, and this signal would
come before the technology became available commercially. However, one must keep in mind that this value may only be useful in the later stages of development, and so a payer may not be the most advantageous partner at the earliest stages of development. Finally, one would have to address the perceived risk of freeloading by other private insurance providers. Free-riding describes the instance where one insurance provider is taking on development risk by providing funding for a new technology that will benefit all private insurers should it reach the market. While the exact calculation of this risk is beyond the scope of the thesis, I will note that at first pass, provided a widely adopted technology, this risk is likely offset by the investment gains the investor would have from investing. If value is captured effectively through pricing and market adoption is favorable, then the value of the investment made by the insurance provider should offset some of the risk from freeloading.
2.6 Conclusion and considerations for funding sources
In the sections above, I have identified multiple sources of funding for a new venture, each with its own advantages. However, it is unlikely that any one source of funding will be sufficient to take a new venture all the way to commercial adoption. More often, a mix of different sources will provide the necessary funds to launch a new molecular diagnostic.
From the perspective of the entrepreneur, this is important as it goes against the "standard" funding model. Historically, the assumption was that once one has the idea or preliminary laboratory data that indicates that a biomarker might work, one goes through several rounds of angel and venture capital funding as the product moves through different stages of clinical development. In reality, while a new venture's development path will likely include venture capitalists at some point, it is highly likely that other sources such as government grants, foundations or strategic partners will at some point be necessary sources.
This is particularly relevant given the trend toward later stage financings for venture capital investments. This means that initial development will have to be funded through grants and foundations, and to the extent those are secured, possibly venture capital money. In the absence of grant funding, venture capital funding early in a diagnostic's development is unlikely, if not impossible. Effectively, the power of grant funding is it may help 'de-risk' the company for the investor, leveraging the initial grants into venture investment at an earlier stage of product development. Further work will be needed in policy to effectively characterize the appropriate timing and magnitude of grant programs.
3. Value drivers for independent development of a diagnostic
Key to any entrepreneur's decisions is a comprehensive understanding of the factors that will unlock value for a new innovation. For this discussion, value will largely refer to the risk-adjusted NPV of future cash flows that a diagnostic could generate. Note that there are two fundamental ways value can be 'unlocked': reducing risk associated with the technology and generating cash flows. Ultimately, multiple factors affect these two value drivers clinical, from R&D expenses needed to develop an assay to successfully completing a clinical trial. In this section, I examine in depth the cases of Genomic Health and Veridex LLC, briefly discuss the activities of other companies emerging in the space of esoteric molecular diagnostics, and conclude with a generalized model for value drivers of an independent diagnostics manufacturer.
3.1 The case of Genomic Health
Brief History
Genomic Health was founded in August of 2000 by Randy Scott. Scott got the idea for the company while working at Incyte, a drug discovery and development company focused on oncology and inflammation. At the time, the academic community was pouring immense amounts of effort into genetic research, but with little yield for clinical applications. Furthermore, treatment decisions and risk stratification for cancer patients were informed by many subjective factors, as well as by a physician's experience. Scott decided to start Genomic Health with the goal of delivering high value molecular diagnostics that drive personalized treatment decisions based on a patient's genetic profile30
Following its founding, Genomic Health secured five rounds of venture financing before its IPO in September 2005. Table 2 shows a summary of its funding history. In total, Genomic Health raised just over $103 million - a significant sum for a diagnostic service provider - from the venture capital community from 2000 through 2004.
Table 2: Genomic Health Venture Funding History
Genomic Health Venture Investing Summary Amount
Year ($000's) Stage Series 2000 $ 7,935 Early Stage A 2001 $ 29,000 Expansion B 2001 $ 5,000 Later Stage C 2002 $' 9,400 Later Stage D 2004 $ 52,294 Later Stage E Total: $ 103,629
Source: Thomson SDC VentureXpert; Genomic Health S-1 filed September 2005
The company filed for a public offering in July 2005, with the offering taking place in September 2005. Ultimately, its shares were priced at $12.00, with Genomic Health registering 5.02 million shares for net proceeds of $55.8 million. The company had 24.3 million shares of common stock outstanding after the offering, for a total market value of $292 million in September 2005.
Genomic Health's technology
The technology underlying Genomic Health's diagnostic is one of the first successful clinical applications of the Human Genome Project in oncology. Its first commercially developed test in breast cancer, Onco type DXTM, relies on a technology known as reverse transcriptase-polymerase chain reaction (RT-PCR for short). RNA is formed when a specific enzyme, RNA polymerase, attaches to DNA and moves along the strand adding matching RNA nucleotides to complementary DNA bases. With RT-PCR, an analysis is done by Genomic Health on frozen paraffin-embedded solid tumor samples to extract and purify these RNA strands. Then, a rapid reverse transcription of the RNA to the complementary DNA takes place to effectively reverse engineer the original segments of DNA (genes) that created the RNA.
This technique is attractive for two reasons. First, the reverse transcription process is reproducible and allows for the synthesis of a large amount of DNA complements in a relatively short period of time. Second, the transcription of RNA described above is the first step in gene expression. Therefore, if one can reverse engineer the RNA to DNA, one is able to determine not only if a specific gene is in a person's genome, but also whether or not the gene is expressed. Using RT-PCR, Genomic Health then studied a set of 250 candidate genes to identify the 21 they now use in their diagnostic. Compared to a standard of care that relied on a physician's best judgment, Genomic Health's test offers a clinically validated, quantifiable assessment of a breast cancer patient's risk for recurrence and likelihood for chemotherapy response. To give some sense of the impact of this shift, consider a study comparing NCCN guidelines to Genomic Health's classification of patients by risk of 10year distant recurrence
-Genomic Health's Recurrence Score reclassified 6% of low-risk patients as high-risk, and 49% of high-risk patients as low-risk3 7. This represents a significant change as patients that are
high-risk by NCCN would typically receive some form of chemotherapy to treat their breast cancer.
Genomic Health and competition
Genomic Health presents an interesting case because, from the time of the company's founding through IPO, the company did not have any significant direct competition. While research organizations had adopted RT-PCR technology, the clinic had yet to see any diagnostics gain traction. The standard of care they had to supplant was the oncologist's best judgment of risk based on risk factors such as age, tumor grade, and family history. Though changing provider decision-making is still a non-trivial hurdle, lack of competition can lead to more rapid adoption, given clinical validity and utility. For the new venture, Genomic Health provides one template that illustrates an opportunity to dominate a market (cancer prognosis) with a new technology
(gene sequencing), where the standard of care was constrained to an oncologist's best judgment based on non-quantitative factors.
Proving clinical utility
In the case of Genomic Health, a significant amount of resources was spent to prove clinical utility and provide justification for premium pricing for its Onco type DX test in breast cancer. From its founding through 2005 Genomic Health spent $47 million on R&D, consuming almost half of the funds it raised to finance the venture to its IPO. From 2006 through 2010, Genomic Health spent another $132 million developing its pipeline of products, with only one additional test for colon cancer launched in 2010. Additionally, in order to ensure adoption of Onco type
DX in breast cancer, 13 independent studies have been conducted to prove both clinical validity and utility of the assay31. Table 3 presents a summary of Genomic Health's results for the past
10 years.
Table 3: Summary of Genomic Health Financial Results 2000-2010
Product Selling & Cumulative An0l
Revenues COGS R&D Spend Marketing G&A List Price Tests
Year ($000-s) ($0O0-s) ($OOO's) ($000's) ($000's) ($/test) Ordered
2000 - - 169 - 566 - -2001 - - 11,080 117 2,844 - -2002 - - 7,053 754 3,753 - -2003 - - 9,069 2,805 3,686 - -2004 227 1,828 10,040 9,856 3,869 3,460 500 2005 4,823 6,249 9,465 15,348 6,485 3,460 7,500 2006 27,006 9,908 12,841 24,625 12,765 3,460 21,500 2007 62,745 17,331 22,053 36,456 17,849 3,650 46,500 2008 108,658 27,185 28,624 46,668 25,617 3,820 85,000 2009 146,581 32,562 35,691 61,132 29,564 3,975 135,000 -2010 174,870 34,634 33,225 71,405 34,913 4,075 190,000 Source: Genomic Health S-1, Annual 10-k filings, author's analysis (shaded columns)
What Genomic Health recognized early-on is that one of the biggest hurdles facing the introduction of 'high-value' diagnostics is proving clinical utility. Here I distinguish between clinical validity, defined as gaining regulatory approval to sell a test or drug, and clinical utility, defined as proving there is a health economic benefit to one's drug or test compared to standard practice in order to promote adoption by payers. For most diagnostics introduced over the past several decades, reimbursement and pricing captured so little value relative to drugs that payers paid little attention to the use of the diagnostic for clinical decision making. If a couple hundred dollars were spent on testing, how could that compare to several tens to hundreds of thousands spent on administering treatment to a patient? In this context, for most
diagnostics proving clinical validity was equivalent to proving clinical utility, as scrutiny fell to the drug manufacturers to prove clinical utility of their treatments.
However, with the introduction of tests like Onco type Dx in the past five years, payers have refocused on diagnostics and are now requiring proof of clinical utility. This stems from the fact that for every five or ten people tested, only one will have a clinical decision changed based on the result of the test. Whether this is to avoid treatment that would be ineffective, or to identify the appropriate treatment, the incremental health economic benefit becomes harder to prove as the price of the test increases ten times. Appendix Ill presents a simple example to illustrate the health economic considerations for showing clinical utility.
Commercialization strategy and reimbursement
Clearing the clinical utility hurdle was important for Genomic Health because the company approached the clinical diagnostic field with the specific intent to develop 'high-value' diagnostics. Examining Genomic Health's pricing history for Onco type DXTM for breast cancer in
Figure 7 one can observe that it was able to enter the market at a price an order of magnitude greater than traditional diagnostic pricing levels. When the test was introduced in 2004, the list price was $3,460 and has since been increased to $4,075 at year end 2010. Furthermore, given the significant investment the company made to prove clinical utility, clinical adoption has been rapid over the six years from 2004-2010, totaling approximately 55,000 tests ordered in 2010.
Figure 7: Onco type DX breast cancer test list price and unit sales
inTests Delivered Onco type DX' Price and Demand - Ust Price
80,000 $4,200 70,0001 ,00 0 $3,80 0 40,000$ 30,000 -I $3,400 % 20,000 10,000$3,200 $3,000 2004 2005 2006 2007 2008 2009 2010
However, critical to Genomic Health's pricing decision was not just proving clinical utility, but also the ability to control pricing for its test. Typically when a new device or test enters the clinical market, there already exists some similar reimbursement code that can be used in place of developing a new code for the test. For example, if a new blood-based biomarker test were introduced, there are already several dozen tests on the market that use a code for blood-based biomarker detection, and set the price point for reimbursement.
In the case of Genomic Health, however, this technological precedent didn't exist. Molecular tests on the market were primarily single gene identification (e.g. Her2), not for multi-gene assays that relied on RT-PCR technology. At one point, the company faced the decision of whether to develop a kit that would be sold to reference laboratories across the nation, or whether to market its test through its own clinically approved (CLIA-certified) laboratory. Pursuing the first option, they would avoid the capital and operating investment needed for a laboratory, but likely would need FDA approval through either 510(k) or PMA approval in order for the test to reach the clinic. Pursuing the second option would allow the company to control how the test was marketed and reimbursed, but would require an additional investment in laboratory space. Genomic Health decided to commercialize the test through a CLIA-certified laboratory it owned and not to develop a commercial kit.
As soon as this decision was made, however, another challenge presented itself. One advantage of selling a commercial kit to reference laboratories is that as the manufacturer, one has mitigated some exposure to reimbursement risk and regulatory change. When a manufacturer commercializes through a CLIA-certified laboratory owned by the company, the company then bears the burden of ensuring that it is being paid for its tests. In the case of Genomic Health, this has been compounded by the fact that their asking price is 10x any other test in the market, and without strong precedent in the clinical market. As such, Genomic Health effectively had to go payer by payer to make the case for the clinical utility of its test, achieving reimbursement from plans covering 90% of covered lives in February 2009, five years after introducing the test3.
A final point must be noted when considering strategic elements for diagnostic development. A test's list price will not be equivalent to the actual reimbursement paid. Three primary factors contribute to this. First, the largest payer for lab services in the US, Medicare, has federal policies in place that protect against high reimbursement. Currently, reimbursement rates for Medicare are typically 70-80% of the established list price for a testing service. Second, negotiated rates with private payers are undisclosed, allowing for multiple different contracted rates that could be equal to or lower than the list price disclosed by Genomic Health. Third, at times reimbursement must come through the provider (hospital) based on Medicare reimbursement regulations that bundle the total care provided to the patient into one
reimbursed value. Putting the hospital in between Genomic Health and the payer increases the possibility that Genomic Health will perform the test, send the results to a physician, and receive only nominal payment compared to their list price, because whatever is paid to Genomic Health comes out of the lump sum paid to the hospital, directly impacting the hospital's margin on the payment. Examining the list price compared to the implied average reimbursement in Table 3 (product revenues divided by number of tests ordered), I observe that Genomic health has averaged 75% reimbursement rates from 2008 to 2010, indicative of the disconnect between list price and the actual reimbursement obtained.
3.2 The case of Immunicon/Veridex LLC
Thus far I have examined in detail the case for Genomic Health and its RT-PCR assay developed for solid tumor samples. In addition to some of the strategic choices outlined above, a diagnostic developer also has to choose what kind of platform and corresponding tissue type will be best for its test. To date, solid tumor samples and associated tests have garnered the most attention, but there are other options for a developer. I now examine Immunicon/Veridex LLC, a division of Johnson & Johnson that has developed a system comprising a blood-based assay and platform that measures circulating tumor cells (CTCs). The Veridex case provides insight into some key strategic variables in diagnostic development, such as technology platform and sample type, advantages and disadvantages of partnerships, and channel choice for clinical adoption.
Brief History
The original manufacturer of the systems sold by Veridex LLC was founded under the name Immunicon in 1983. In 1999, its business model evolved to focus on the commercialization of circulating tumor cell technology for use in cancer diagnostic tests. Similar to Genomic Health, Immunicon viewed cancer as a field fraught with subjective and inefficient measures used for diagnosis and risk assessment. Central to the company's technology was the ability to predict survival in metastatic breast cancer, providing the potential for early detection, more accurate staging and monitoring of cancer and the ability to influence therapy selectionso. In order to promote both diagnostic test development and CTC platform adoption, Immunicon entered into a commercial partnership with Veridex, a Johnson & Johnson company, in August of 2000. Under this agreement, Veridex would carry out the marketing and sales functions for the CTC technology in the field of cancer, in return providing Immunicon with a portion of its net sales
of any reagents, test kits, or other consumables incorporating Immunicon's CTC technology.
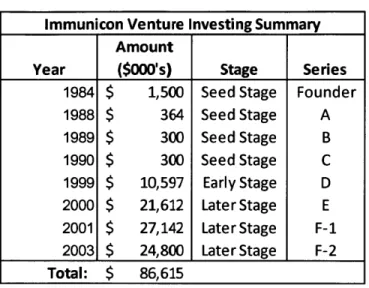
Following Immunicon's shift to focus on CTCs in 1999, it went on to raise seven rounds of venture financing before its IPO in April of 2004 (Table 4). In total, Immunicon raise just over $86 million in venture financing before accessing the public markets, 97% of which was raised over the four years 1999 through 2003.
Table 4: Immunicon Venture Funding History
Immunicon Venture Investing Summary Amount
Year ($000's) Stage Series
1984 $ 1,500 Seed Stage Founder 1988 $ 364 Seed Stage A 1989 $ 300 Seed Stage B 1990 $ 300 Seed Stage C 1999 $ 10,597 Early Stage D 2000 $ 21,612 Later Stage E 2001 $ 27,142 Later Stage F-1 2003 $ 24,800 Later Stage F-2 Total: $ 86,615
Source: Thomson VentureXpert; Immunicon S-1 filed April 2004
Note: The $86.6 million raised by Immunicon is approximately $107.3 million in 2010 dollars.
The company filed for a public offering in December 2003, with the offering taking place in April 2004. Ultimately, its shares were priced at $8.00, with Immunicon registering six million shares for net proceeds of $42.9 million. The company had 21.9 million shares of common stock outstanding after the offering, for a total value of approximately $175 million in April 2004.
Following its public offering, the company experienced some success growing the sales of its CTC platform to laboratories. However, by 2007, growth was far short of expectations, and Immunicon executed their right to audit Veridex's effort promoting and selling the kits and products developed for Immunicon's CTC platform. This led to a costly legal battle between Veridex and Immunicon, ultimately pushing Immunicon to file for Chapter 11 protection a year later. Shortly after filing, Veridex acquired the assets of Immunicon for $31 million in cash, ensuring the technology would continue to be developed, but no longer under Immunicon's stewardship.
Immunicon's technology
As mentioned, Immunicon's technology is fundamentally different from that of Genomic Health. Circulating tumor cells are cells found in the bloodstream of patients with metastatic cancer, and are found on the order of 1-10 CTCs per mL of whole blood. By comparison, there would normally be a few million white blood cells, and a few billion red blood cells in a mL of whole blood. The breakthrough for Immunicon was its methodology for imaging the CTC's when so few are available in a sample. In order to measure CTCs, first a binding agent is introduced to a blood sample that will enrich the tumor cells immunomagnetically. Then a stain is introduced with fluorescent antibody conjugates to highlight specific markers when the
sample is scanned. This way, the technology is able to rapidly and accurately image the presence of CTC's for researchers and clinicians.
Circulating tumor cells are an attractive platform for diagnostic development for three key reasons. First, blood samples are much easier to obtain compared to solid tumor samples. Solid tumors can require invasive biopsies to acquire samples, though recent efforts to bank tissues may help reduce patient burden and sample acquisition. Drawing blood, by comparison, is a quick procedure that causes minimal discomfort for the patient. Second, solid tumor samples often suffer from poor sample preparation and heterogeneity in both sample preparation and tumor expression. Blood, on the other hand, has an established sampling and preparation process that reduces much of the variability in sampling found in solid tumors. Third, the test for CTCs provided potentially a much cheaper option to some of the imaging tests needed to
detect metastasis of cancer from primary tissues.
Competition
Unlike the case of Genomic Health, competition in circulating tumor cells was already quite heated. Knowledge of CTCs had been around for almost a century, and the fundamental technology underlying the identification of circulating tumor cells, flow cytometry, was already widely adopted into clinical and research laboratories. Flow cytometry is, at its core, a technique for counting and examining microscopic particles and for oncology is most widely used in blood cancers. The difficulty with CTCs in solid tumors, as discussed above, is that there are so few in the blood. The unique aspect of Immunicon's technology was the application to solid tumors, with the intent to use the number of circulating tumor cells as an indicator of tumor aggressiveness and progression.
In this context, it means that Immunicon had to convince laboratories and clinicians of two things. First, that the technology was better than any existing techniques for analyzing blood cell counts, particularly in the context of circulating tumor cells. Second, that the tests Immunicon was going to provide on top of their platform would be better than anything the labs could develop themselves. Essentially, Immunicon faced competition with its own customer base. One can see how the CTC approach to the market faced more friction for clinical adoption relative to a technology like Genomic Health.
Partnership with Veridex and commercialization strategy
A significant decision point for many diagnostic manufacturers is whether or not to form a commercial partnership. These agreements can take many forms, ranging from companion diagnostic development where a diagnostic is explicitly tied to the label for a therapeutic, to commercial arrangements where the development, sales and marketing engines of a larger company promote the adoption of a fledgling start-up's product. In the case of Immunicon, it formed a development and sales license agreement with Veridex, a company backed by the
resources of Johnson & Johnson, that required Immunicon focus on the R&D backing new products, and Veridex handle the sales and marketing efforts for the CellTracks and CellSearch products. In this way, Veridex would not have to bear the large expenses with "detailing" doctors and laboratories, allowing for more effort and resources for R&D as they developed their CTC test and platform technology.
The license agreement is a model example of a commercial license agreement, where the contract is put in place to leverage the expertise of each party. Appendix IV contains the detailed discussion of the license agreement from Immunicon's S-1 filed December 2003. Immunicon, as the technical expert for the product, would manage all new product development and clinical trials associated with the cell analysis systems. For the cost of clinical trials, Immunicon would bear the first $5 million, Veridex the next $5 million, and any costs above $10 million would be negotiated in good faith. Veridex, on the other hand, would handle all sales and marketing related costs, as well as field service for the systems installed. Immunicon would be responsible for the manufacturing of all reagent and consumables, which would be reimbursed by Veridex. Upon the sale of a product, Veridex would pay 30% of net
sales to Immunicon as a license fee, after deducting the bulk reagent costs. In this way, the agreement was structured such that Immunicon would gain the sales and marketing horsepower of Johnson & Johnson, and Johnson & Johnson would acquire a new product for which it didn't have to maintain the manufacturing or development expertise.
However, careful consideration of the arrangement highlights a couple of key risks for Immunicon that, in the context of events several years later, may have led to the unraveling of the partnership. First, the agreement was made in 2000, four years before Immunicon would gain clinical validity for its test. This means that, for four years, Immunicon would bear a large portion of the up-front costs associated with developing the product, with no control over the ultimate commercial success of its system. Second, from the details provided in the S-1, it is unclear how Immunicon can obtain any validation that the sales and marketing efforts of Veridex are being conducted to the best of their ability to drive sales volume. Clearly the volume of sales would be one indicator, but it is hard to determine ex-ante whether this would be due to the quality of the product, or the effort expended by Veridex. As such, it may have been more efficient to establish some measure of co-promotion, such that Immunicon could fairly gauge the effort expended by Veridex in the promotion and sale of the CTC systems. Third, while there was an explicit discussion of clinical trials, meant to establish clinical validity, there was no discussion about establishing clinical utility to ensure a laboratory offering the test would actually be paid for running a CellSearch test.
While a different monitoring approach for Immunicon may have helped, a more nuanced appreciation for Veridex's role would also have promoted a better relationship between the