HAL Id: hal-01259227
https://hal-univ-rennes1.archives-ouvertes.fr/hal-01259227
Submitted on 14 Apr 2016
HAL is a multi-disciplinary open access
archive for the deposit and dissemination of
sci-entific research documents, whether they are
pub-lished or not. The documents may come from
teaching and research institutions in France or
abroad, or from public or private research centers.
L’archive ouverte pluridisciplinaire HAL, est
destinée au dépôt et à la diffusion de documents
scientifiques de niveau recherche, publiés ou non,
émanant des établissements d’enseignement et de
recherche français ou étrangers, des laboratoires
publics ou privés.
Distributed under a Creative Commons Attribution - NonCommercial - NoDerivatives| 4.0
International License
Gene expression profiling of the tumor
microenvironment in human intrahepatic
cholangiocarcinoma
Laurent Sulpice, Mireille Desille, Bruno Turlin, Alain Fautrel, Karim
Boudjema, Bruno Clément, Cédric Coulouarn
To cite this version:
Laurent Sulpice, Mireille Desille, Bruno Turlin, Alain Fautrel, Karim Boudjema, et al.. Gene
expres-sion profiling of the tumor microenvironment in human intrahepatic cholangiocarcinoma. Genomics
Data, Elsevier, 2016, 7, pp.229-232. �10.1016/j.gdata.2016.01.012�. �hal-01259227�
Data in Brief
Gene expression pro
filing of the tumor microenvironment in human
intrahepatic cholangiocarcinoma
Laurent Sulpice
a,b,c, Mireille Desille
a,b,d, Bruno Turlin
a,b,d,e, Alain Fautrel
a,b, Karim Boudjema
a,b,c,
Bruno Clément
a,b, Cédric Coulouarn
a,b,⁎
a
Inserm, UMR991, Liver Metabolisms and Cancer, F-35033 Rennes, France
b
Université de Rennes 1, F-35043 Rennes, France
c
CHU Rennes, F-35033 Rennes, France
d
CHU Rennes, Centre de Ressources Biologiques Santé, F-35033 Rennes, France
eCHU Rennes, Service d'Anatomie et Cytologie Pathologiques, F-35033 Rennes, France
a b s t r a c t
a r t i c l e i n f o
Article history: Received 8 January 2016 Accepted 14 January 2016 Available online 15 January 2016
Intrahepatic cholangiocarcinoma (ICC) is the second most common type of malignant primary tumors in the liver. ICC is an aggressive cancer with a poor survival and limited therapeutic options. At the histological level, ICC is characterized by an abundant stroma (i.e. the tumor microenvironment that notably includes components of the extracellular matrix, stromal cells and soluble factors). Tumor microenvironment is known to play a key role in tumor onset and progression but it is poorly characterized at the molecular level. Thus, this study was specifically designed to identify genes that are significantly deregulated in the tumor microenvironment of human ICC. Here we provide a detailed description of the experimental design and methods used to acquire the genomic data deposited into Gene Expression Omnibus (GEO) under the accession numberGSE45001. Our genomic dataset provides insights on the molecular pathways altered in the microenvironment of ICC and allows the identification of novel ICC biomarkers, as exemplified previously in Hepatology (PMID:23775819).
© 2016 The Authors. Published by Elsevier Inc. This is an open access article under the CC BY-NC-ND license (http://creativecommons.org/licenses/by-nc-nd/4.0/). Keywords: Liver Cancer Cholangiocarcinoma Microenvironment Profiling
1. Direct link to deposited data
http://www.ncbi.nlm.nih.gov/geo/query/acc.cgi?acc=GSE45001
⁎ Corresponding author at: Inserm, UMR991, Liver Metabolisms and Cancer, F-35033 Rennes, France.
E-mail address:cedric.coulouarn@inserm.fr(C. Coulouarn). Specifications
Organism/cell line/tissue Homo sapiens/liver
Sex Male
Sequencer or array type Agilent-028004 SurePrint G3 Human GE 8x60K Microarray (GPL14550)
Data format Raw and analyzed Experimental factors Tumoral vs. non tumoral
Experimental features Tissue samples were subjected to laser capture microdissection (LCM) to profile gene alterations in tumoral vs. non tumoral stroma from 10 patients with ICC
Consent Written informed consent was obtained from all patients. The study protocol fulfilled national laws and regulations and was approved by the local ethical committees.
Sample source location Rennes, France
2. Experimental design, materials and methods 2.1. General objective and experimental design
The aim of the study was to identify genes significantly deregulated in the microenvironment of human ICC. For this purpose, we applied a gene expression profiling approach using Agilent pangenomic microarrays and total RNA isolated from human ICC samples after laser capture microdissection (LCM) of the normal vs. tumoral microenvironment, as previously reported[1].
2.2. Patients
Gene expression profiling was performed from fresh frozen tissues of 10 patients with ICC[1]. Fresh frozen tissues and formalin-fixed paraffin-embedded (FFPE) tissues were provided by the biobank of the hospital-university (Centre de Ressources Biologiques [CRB] Santé de Rennes; BB-0033-00056). Patients underwent liver resection at Rennes university hospital between Jan. 1997 and Aug. 2011. Only mass-forming types ICC were included, as defined by the Liver Cancer Study Group of Japan. Written informed consent was obtained from all patients. The study protocol fulfilled national laws and regulations and was approved by the local ethics committee and the Institutional Review Board (IRB00003888) of Inserm (IORG0003254).
http://dx.doi.org/10.1016/j.gdata.2016.01.012
2213-5960/© 2016 The Authors. Published by Elsevier Inc. This is an open access article under the CC BY-NC-ND license (http://creativecommons.org/licenses/by-nc-nd/4.0/). Contents lists available atScienceDirect
Genomics Data
2.3. Laser capture microdissection (LCM) and RNA extraction
The integrity and the quality of all tissue sections werefirst validated at the histological level after hematoxylin and eosin (H&E) staining by
an experienced liver pathologist (Fig. 1A–B). LCM was then performed to isolate thefibrous tissue from tumoral and non-tumoral ICC samples. LCM was performed using the Arcturus Veritas™ microdissection system (Applied Biosystems, Carlsbad, CA). From frozen tissues,
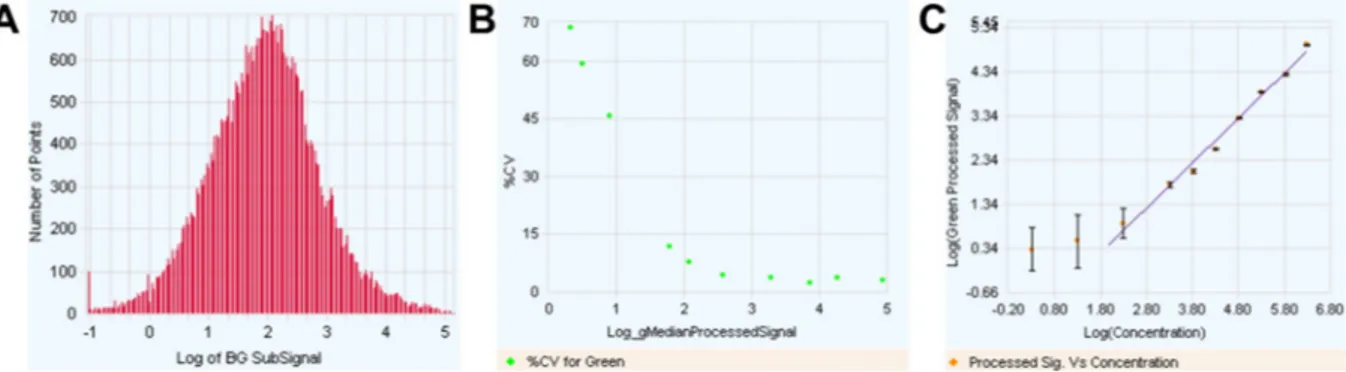
Fig. 2. Quality control of microarray images using Feature Extraction algorithm. (A) Histogram of background subtracted signals showing a broad signal distribution (5 Log). (B) Percentage of variation as a function of signal intensity. (C) Signal intensity of Agilent spike-In RNA features as a function of their relative concentration demonstration a linearity of the signal over a large spectrum of RNA abundance.
Fig. 1. Quality control of tissue samples before and after laser capture microdissection (LCM). H&E staining of representative non-tumoral (A) and tumoral (B) ICC samples. (C) From left to right, LCM of the stroma from a tumoral ICC sample. (D) Tissue sample after LCM highlighting various regions of microdissected stroma that were collected on a cap before RNA extraction (E).
serial sections of 10μm were prepared using a Leica 3050 S cryostat (Leica Microsystems, Wetzlar, Germany) and mounted onto a PEN membrane glass slide (Applied Biosystems). Tissue sections were dehydrated by successive immersions (30 s. twice) in 70%, 90% and 100% ethanol solutions. Enzymatic activity was locked by the immersion in a xylene solution (1 min. Twice) before performing LCM (Fig. 1C). LCM was performed within 1 h to limit RNA degradation. The average microdissected area was 5.07 ± 1.42 mm2 (6.01 ±
1.02 mm2and 4.13 ± 1.13 mm2for tumor stroma andfibrous tissue in the adjacent non-tumor tissue, respectively) (Fig. 1D-E). Total RNA from laser capture microdissected tissues (Fig. 1E) was extracted and purified using an Arcturus Picopure RNA isolation kit according to the manufacturer's instructions (Applied Biosystems, Carlsbad, CA). RNA was qualified using a Nanodrop 2000 spectrophotometer (Thermo Fischer Scientific, Waltham, MA). The average RNA concentration was 6.18 ± 3.05 ng/μL and the 260/280 ratio was above 2.
2.4. Gene expression analysis
Genome-wide expression profiling was performed using a low-input QuickAmp labeling kit and human SurePrint G3 8x60K pangenomic microarrays (Agilent Technologies, Santa Clara, CA) as previously described[2]. Total RNA, in presence of an external spike-in RNA mixture, were amplified and labeled with Cy3 fluorescent dye using Agilent one color low-input QuickAmp labeling kit following the manufacturer's instructions. Starting from 50 ng total RNA purified from LCM tissue samples, amplification yield was 1.8 ± 0.7 μg cRNA and specific activity was 5.8 ± 3.4 pmol Cy3 per μg cRNA.
The same amount of Cy3-labeled cRNA (600 ng) was fragmented at 60 °C for 30 min in a reaction volume of 25μl containing 1× Agilent fragmentation buffer and 2 × Agilent blocking agent following the manufacturer's instructions. Following the fragmentation reaction, 25μ of 2× Agilent hybridization buffer (HI-RPM) was added to the fragmentation mixture. FortyμL of the mixture were hybridized to Agilent SurePrint G3 Human GE 8x60K for 17 h at 65 °C in a rotating Agilent hybridization oven. After hybridization, microarrays were washed 1 min at room temperature with GE Wash Buffer 1 (Agilent) and 1 min with GE Wash buffer 2 at 37 °C (Agilent).
Microarray were scanned immediately after washing with the Agilent DNA Microarray C Scanner (G2565) using one color scan
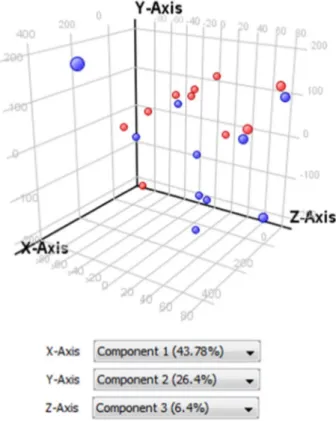
setting for 8x60k array slides. The scanned images were analyzed with Feature Extraction Software 10.7.3.1 (Agilent Technologies) using default parameters (protocol GE1_107_Sep09_ssSurrogates and Grid: 028004_D_F_20101102). Quality control showed a broad distribution of background subtracted signals, suggesting that RNA with various abundances (from low to high) could be analyzed from the genomic dataset (Fig. 2A). The analysis also demonstrated Fig. 4. Principal Component Analysis (PCA) analysis of tumor (blue) and non tumoral (red) microdissected ICC samples. PCA scores are visually represented in a 3D scatter plot.
an expected correlation between the coefficient of variation and sig-nal intensity (Fig. 2B). The use of Agilent spike-In RNA demonstrated a linear relation between signal intensity and the relative abundance or concentration of the RNA (Fig. 2C). All 20 microarrays from the genomic dataset were qualified and further analyzed using GeneSpring software (Agilent Technologies).
Microarray data werefirst normalized by using the quantile normalization algorithm. As shown in Fig. 3this normalization method corrected putative technical variations between samples. Without initial genefiltration, Principal Component Analysis (PCA) using expression values of all genes in all 20 samples mostly separat-ed tumor from non-tumor samples (Fig. 4). Then, afiltration by “flag” and“signal intensity” was applied. Were retained only the entities in which at least 50% of the values in any of the two conditions (Non Tumoral vs. Tumoral) had a“detected flag” (i.e. a positive and significant feature as defined by GeneSpring). For the filtration by signal intensity, were retained the entities in which at least 50% of the values in any of the two conditions (non tumoral, NT vs. tumoral, T) were within the range of interest (i.e. 20–100th percentile). Differentially expressed genes were identified by a two-sample univariate t-test and a random variance model as described[1]. Permutation P-values for significant genes were computed based on 10,000 random permutations.
In conclusion, our genomic dataset is relevant to provide insights on the molecular pathways altered in the microenvironment of ICC and to identify novel ICC biomarkers[1,3].
Acknowledgments
The authors thank Biosit and Biogenouest for access to Plateforme Génomique Santé, Centre de Ressources Biologiques Santé, and H2P2 histopathological platform. This work was supported by Grants from Inserm, Université de Rennes 1, Institut National du Cancer (Cancéropoles IDF & GO), Ligue contre le cancer and Novartis Oncology. References
[1]L. Sulpice, M. Rayar, M. Desille, B. Turlin, A. Fautrel, E. Boucher, F. Llamas-Gutierrez, B. Meunier, K. Boudjema, B. Clément, C. Coulouarn, Molecular profiling of stroma identifies osteopontin as an independent predictor of poor prognosis in intrahepatic cholangiocarcinoma. Hepatology 58 (6) (2013) 1992–2000.
[2] C. Coulouarn, A. Corlu, D. Glaise, I. Guénon, S.S. Thorgeirsson, B. Clément, Hepatocyte-stellate cell cross-talk in the liver engenders a permissive inflamma-tory microenvironment that drives progression in hepatocellular carcinoma. Cancer Res. 72 (10) (2012) 2533–2542.
[3] L. Sulpice, M. Rayar, B. Turlin, E. Boucher, P. Bellaud, M. Desille, B. Meunier, B. Clément, K. Boudjema, C. Coulouarn, Epithelial cell adhesion molecule is a prognosis marker for intrahepatic cholangiocarcinoma. J. Surg. Res. 192 (1) (2014) 117–123.