EUROPEAN ORGANISATION FOR NUCLEAR RESEARCH (CERN)
Phys. Lett. B 789 (2019) 167
DOI:10.1016/j.physletb.2018.12.023
CERN-EP-2018-196 17th January 2019
Measurement of photon–jet transverse momentum
correlations in 5.02 TeV Pb+Pb and p p collisions
with ATLAS
The ATLAS Collaboration
Jets created in association with a photon can be used as a calibrated probe to study energy loss in the medium created in nuclear collisions. Measurements of the transverse momentum balance between isolated photons and inclusive jets are presented using integrated luminosities of 0.49 nb−1of Pb+Pb collision data at
√
sNN = 5.02 TeV and 25 pb−1of pp collision data at
√
s = 5.02 TeV recorded with the ATLAS detector at the LHC. Photons with transverse momentum 63.1 < pγT < 200 GeV and |ηγ| < 2.37 are paired with all jets in the event that have pjetT > 31.6 GeV and pseudorapidity ηjet
< 2.8. The transverse momentum balance given by the jet-to-photon pT ratio, xJγ, is measured for pairs with azimuthal opening angle ∆φ > 7π/8. Distributions of the per-photon jet yield as a function of xJγ, (1/Nγ)(dN/dxJγ), are corrected for detector effects via a two-dimensional unfolding procedure and reported at the particle level. In pp collisions, the distributions are well described by Monte Carlo event generators. In Pb+Pb collisions, the xJγ distribution is modified from that observed in pp collisions with increasing centrality, consistent with the picture of parton energy loss in the hot nuclear medium. The data are compared with a suite of energy-loss models and calculations.
1 Introduction
The energy loss of fast partons traversing the hot, deconfined medium created in nucleus–nucleus collisions can be studied in a controlled and systematic way through the analysis of jets produced in association with a high transverse momentum (pT) prompt photon [1–7]. At leading order in quantum chromodynamics, the photon and leading jet are produced back-to-back in the azimuthal plane, with equal transverse momenta. Measurements of prompt photon production in Au+Au collisions at the Relativistic Heavy Ion Collider (RHIC) [8] and Pb+Pb collisions at the Large Hadron Collider (LHC) [9] have confirmed that, since photons do not participate in the strong interaction, their production rates are not modified by the medium [10]. Thus, photons provide an estimate of the pT and direction of the parton produced in the initial hard-scattering before it has lost energy through interactions with the medium. Measurements of jet production with different requirements on the photon kinematics can therefore shed light on how the absolute amount of parton energy loss depends on the initial parton pT.
Furthermore, photon–jet events offer a particularly useful way to probe the distribution of energy lost by jets in individual events, and are complementary to measurements such as the dijet pT balance [11–13]. Whereas those measurements report the ratio of the transverse momenta of two final-state jets, both of which may have lost energy, photon–jet events provide an alternative system in which one high-pT object is certain to remain unaffected by the hot nuclear medium. Finally, jets produced in association with a photon are more likely to originate from quarks than those produced in dijet events at the same pT. Thus, when considered together with measurements of dijets or of inclusive jet [14–16] and hadron [17–19] production rates in Pb+Pb collisions, analysis of photon–jet events can help to further constrain the flavour (i.e. quark versus gluon) dependence of parton energy loss.
Studies of photon–hadron correlations, in which high-pT hadrons are used as a proxy for the jet, were first performed at RHIC [20–22], and measurements using fully reconstructed jets have since begun at the LHC [23,24]. In the LHC studies, the distribution of the photon–jet azimuthal separation, ∆φ, was found to be consistent with that in simulated photon–jet events embedded into a heavy-ion background, and the jet-to-photon transverse momentum ratio, xJγ = p
jet T /p
γ
T, was studied for inclusive photon–jet pairs. The per-photon jet yield (1/Nγ)(dN/dxJγ) distribution was shifted to significantly smaller values in Pb+Pb data.
In these previous measurements, the xJγ distributions in Pb+Pb events were not corrected for detector resolution effects, which led to a substantial broadening of the reported distributions in data. As a result, qualitative comparisons with models or even with the analogous distributions in proton–proton (pp) data could only be accomplished by applying an additional smearing to the comparison distributions to introduce detector effects. Recent measurements of dijet pT correlations [12] and inclusive jet fragmentation functions at large longitudinal momentum fraction [25] in Pb+Pb collisions used unfolding procedures to correct for bin-migration effects and return the distributions to the particle level, i.e. free from detector effects.
This Letter reports a study of photon–jet correlations in Pb+Pb collisions at a nucleon–nucleon centre-of-mass energy
√
sNN = 5.02 TeV and pp collisions at the same centre-of-mass energy√s = 5.02 TeV. The data were recorded in 2015 with the ATLAS detector at the LHC and correspond to integrated luminosities of 0.49 nb−1and 25 pb−1, respectively. Events containing a prompt photon with 63.1 < pγT < 200 GeV and pseudorapidity |ηγ| < 2.37 (excluding the region 1.37 < |ηγ| < 1.52) are studied. The pT balance of photon–jet pairs for jets with pjetT > 31.6 GeV and ηjet < 2.8 which are approximately back-to-back with the photon in the transverse plane, ∆φ > 7π/8, is analysed through the per-photon yield of jets as
a function of xJγ, with all jets that meet this selection requirement counted separately. In Monte Carlo simulations, the fraction of photons paired with more than one jet rises from 1% to ≈ 15% over the reported photon pTranges. The particular photon and jet pT ranges used in the measurement are chosen to be evenly spaced on logarithmic scales to facilitate the unfolding procedure described below.
The yields are corrected via data-driven techniques for background arising from combinatoric pairings of each photon with unrelated jets in Pb+Pb events and from the contamination by neutral mesons in the photon sample. The resulting xJγdistributions are corrected for the effects of the experimental resolution on the photon and jet pTvia a two-dimensional unfolding procedure similar to that used in Ref. [12]. Due to higher-order effects, photon–jet events do not generally have the back-to-back leading order topology mentioned above. Thus the pp data, which includes these effects, provides the reference distributions against which to interpret the results in Pb+Pb events. This Letter directly compares photon–jet data in Pb+Pb and pp events, and with Monte Carlo event generators and analytic calculations [26–29].
2 Experimental set-up
The ATLAS experiment [30] is a multipurpose particle detector with a forward–backward symmetric cylindrical geometry and nearly 4π coverage.1 This analysis relies on the inner detector, the calorimeter and the data acquisition and trigger system.
The inner detector comprises three major subsystems: the pixel detector and the silicon microstrip tracker, which extend out to |η| = 2.5, and the transition radiation tracker which extends to |η| = 2.0. The inner detector covers the full azimuth and is immersed in a 2 T axial magnetic field. The pixel detector consists of four cylindrical layers in the barrel region and three disks in each endcap region. The silicon microstrip tracker comprises four cylindrical layers (nine disks) of silicon strip detectors in the barrel (endcap) region.
The calorimeter is a large-acceptance, longitudinally-segmented sampling detector covering |η| < 4.9 with electromagnetic (EM) and hadronic sections. The EM calorimeter is a lead/liquid-argon sampling calorimeter with an accordion-shaped geometry. It is divided into a barrel region, covering |η| < 1.475, and two endcap regions, covering 1.375 < |η| < 3.2. The EM calorimeter has three primary sections, longitudinal in shower depth, called “layers”, in the barrel region and up to |η| = 2.5 in the end cap regions. In the barrel and first part of the end cap (|η| < 2.4), with the exception of the regions 1.4 < |η| < 1.5, the first layer has a fine segmentation in η (∆η = 0.003–0.006) to allow the discrimination of photons from the two-photon decays of π0and η mesons. Over most of the acceptance, the total material upstream of the EM calorimeter ranges from 2.5 to 6 radiation lengths. In the transition region between the barrel and endcap regions (1.37 < |η| < 1.52), the amount of material rises to 11.5 radiation lengths, and thus this region is not used for the detection of photons. The hadronic calorimeter is located outside the EM calorimeter. It consists of a steel/scintillator-tile sampling calorimeter covering |η| < 1.7 and a liquid-argon calorimeter with copper absorber covering 1.5 < |η| < 3.2.
1ATLAS uses a right-handed coordinate system with its origin at the nominal interaction point (IP) in the centre of the detector
and the z-axis along the beam pipe. The x-axis points from the IP to the centre of the LHC ring, and the y-axis points upward. Cylindrical coordinates (r, φ) are used in the transverse plane, φ being the azimuthal angle around the z-axis. The pseudorapidity is defined in terms of the polar angle θ as η = − ln tan(θ/2). Transverse momentum and transverse energy are defined as pT= p sin θ and ET= E sin θ, respectively. ∆R is defined as
p
The forward calorimeter (FCal) is a liquid-argon sampling calorimeter located on either side of the interaction point. It covers 3.1 < |η| < 4.9 and each half is composed of one EM and two hadronic sections, with copper and tungsten serving as the absorber material, respectively. The FCal is used to characterise the centrality of Pb+Pb collisions as described below. Finally, zero-degree calorimeters (ZDC) are situated at large pseudorapidity, |η| > 8.3, and are primarily sensitive to spectator neutrons. A two-level trigger system is used to select events, with a first-level trigger implemented in hardware followed by a software-based (high-level) trigger. Data for this measurement were acquired using a high-level photon trigger [31] covering the central region (|η| < 2.5). At the first-level trigger stage, the transverse energy of EM showers is computed within regions of ∆φ × ∆η = 0.1 × 0.1, and those showers which satisfy an ET threshold are used to seed the high-level trigger stage. At this next stage, reconstruction algorithms similar to those applied in the offline analysis use the full detector granularity to form the final trigger decision. The trigger was configured with an online photon-pT threshold of 30 GeV (20 GeV) in the pp (Pb+Pb) running period and required the candidate photon to satisfy a set of loose criteria for the electromagnetic shower shape [31]. For the Pb+Pb data-taking, the high-level trigger included a procedure to estimate and subtract the underlying event (UE) contribution to the ETmeasured in the calorimeter [9], ensuring high efficiency in high-activity Pb+Pb events.
In addition to the photon trigger, Pb+Pb data were recorded with minimum-bias triggers; these events are used to characterise the centrality of Pb+Pb collisions as described in Section3. The minimum-bias triggers are based on the presence of a minimum amount of approximately 50 GeV of transverse energy in all sections of the calorimeter system (|η| < 3.2) or, for events that do not meet this condition, on substantial energy deposits in both ZDC modules and an inner-detector track identified by the high-level trigger system.
3 Data selection and Monte Carlo samples
Photon–jet events in pp and Pb+Pb collisions are initially selected for analysis by the high-level triggers described above. The typical number of interactions per bunch crossing in the pp and Pb+Pb data-taking were one and smaller than 10−4, respectively. Events are required to satisfy detector and data-quality requirements, and to contain a vertex reconstructed from tracks in the inner detector. An additional requirement in Pb+Pb collisions, based on the correlation of the signals in the ZDC and the FCal, is used to reject a small number of recorded events consistent with two Pb+Pb interactions in the same bunch crossing (pile-up) [32]. The pile-up rate is largest in the most central events, where it is at most 0.1% and rejected with an efficiency greater than 98%. No pile-up rejection is applied in pp collisions.
The centrality of Pb+Pb events is defined using the total transverse energy measured in the FCal, evaluated at the electromagnetic scale and denoted byÍET. The same observable was used to characterise 2010 and 2011 Pb+Pb data at
√
sNN = 2.76 TeV [33] and a similar procedure, based on Monte Carlo Glauber modeling [34], is followed in 2015 data [35]. In this analysis, Pb+Pb events within five centrality ranges are considered that represent 0–10% (largestÍET values and degree of nuclear overlap), 10–20%, 20– 30%, 30–50% and 50–80% (smallestÍETvalues and degree of nuclear overlap) of the population. The mean number of participating nucleons in minimum-bias Pb+Pb collisions, Npart, ranges from 33.3 ± 1.5 in 50–80% events to 358.8 ± 2.3 in 0–10% events.
Monte Carlo simulations of √
s = 5.02 TeV pp photon–jet events are used to correct the data for bin migration and inefficiency effects, and for comparison with distributions measured in pp collision data. For
all the samples described below, the generated events were passed through a full Geant 4 simulation [36, 37] of the ATLAS detector under the same conditions present during data-taking and were digitised and reconstructed in the same way as the data.
For the primary simulation samples, the Pythia 8.186 [38] generator was used with the NNPDF23LO parton distribution function (PDF) set [39], and generator parameters which were tuned to reproduce a set of minimum-bias data (the “A14” tune) [40]. Both the direct and fragmentation photon contributions are included in the simulation. Six million pp events were generated with a generator-level photon in the pTrange 50 GeV to 280 GeV. Additionally, a sample of 18 million events were produced with the same generator, tune and PDF, and were overlaid at the detector-hit level with minimum-bias Pb+Pb events recorded during the 2015 run. The relative contribution of events in this “data-overlay” sample were reweighted on an event-by-event basis to match theÍ ETdistribution observed in the photon–jet events in Pb+Pb data selected for analysis. Thus the Pb+Pb simulation samples contain underlying-event activity levels and kinematic distributions of jets (used in the combinatoric photon–jet background estimation) identical to those in data.
Additional samples of 0.3 million pp events and 6 million events overlaid with Pb+Pb data were produced with the Sherpa 2.1.1 [41] generator using the CT10 PDF set [42], as were 0.6 million pp Herwig 7 [43] events with the MMHT UE tune and PDF set [44]. The Sherpa samples were generated with leading-order matrix elements for photon–jet final states with up to three additional partons, which were merged with the Sherpa parton shower. The Herwig events were generated in a way that includes the direct and fragmentation photon contributions. Both the Sherpa and Herwig samples were filtered for the presence of a photon in the required kinematic region, and are used because they contain different photon+multijet topological distributions and jet-flavour compositions.
At generator level, photons are required to be isolated by requiring the sum of the transverse energy carried by primary particles2in a cone of size ∆R = 0.3 around the photon, ETiso, to be smaller than 3 GeV. In the analysis, the background subtraction, described below, removes photons which pass the isolation cut in data but fail this isolation requirement at the particle level. Jets are defined by applying the anti-kt algorithm [45,46] with radius parameter R = 0.4 to primary particles within |η| < 4.9. In simulation, the jet flavour, i.e. whether it is quark- or gluon-initiated, is defined as the flavour of the highest-pT parton that points to the generator-level jet [47].
4 Event reconstruction
4.1 Photon reconstructionPhoton candidates are reconstructed from clusters of energy deposited in EM calorimeter cells, following a procedure used for previous measurements of isolated prompt photon production in Pb+Pb collisions [9]. The procedure is similar to that used extensively in pp collisions [48,49], but is applied to the calorimeter cells after an event-by-event estimation and subtraction of the pile-up and UE contribution to the deposited energy in each cell [14]. In Pb+Pb collisions, all photon candidates are treated as if they were unconverted photons. Photon identification is based primarily on shower shapes in the calorimeter [50], selecting those candidates which are compatible with originating from a single photon impacting the calorimeter.
2Primary particles are defined as those with a proper mean lifetime, τ, exceeding cτ = 10 mm. For the jet and isolation E T
The measurement of the photon energy is based on the energy collected in a small region of calorimeter cells centred on the photon (∆η × ∆φ = 0.075 × 0.175 in the barrel and ∆η × ∆φ = 0.125 × 0.125 in the endcaps), and is corrected via a dedicated calibration [51], which accounts for upstream losses and both lateral and longitudinal leakage. The sum of transverse energy in calorimeter cells inside a cone size of ∆R= 0.3 centred on the photon candidate, excluding a small central area of size ∆η ×∆φ = 0.125×0.175, is used to compute the isolation energy ETiso. It is corrected for the expected leakage of the photon energy into the isolation cone.
Reconstructed photon candidates are required to satisfy identification and isolation criteria. The identific-ation working point (called “tight”) includes requirements on each of several shower-shape variables [50]. These criteria reject two-photon decays of neutral mesons using information in the finely segmented first calorimeter layers, and reject hadrons which began showering in the EM section using information from the hadronic calorimeter. The isolation energy is required to be ETiso < 3 GeV in pp collisions. In Pb+Pb collisions, where UE fluctuations significantly broaden the distribution of ETisovalues, this requirement is set to approximately one standard deviation of the Gaussian-like part of the distribution centred at zero, Eiso
T < 8 GeV.
In simulation, prompt photons in pp collisions have a total reconstruction and selection efficiency greater than 90%. At low pT ≈ 60 GeV in the most central Pb+Pb collisions, this efficiency is ≈ 60%, rising with increasing pT and in less central collisions. In all events, the pT scale, defined as the mean ratio of measured photon pT to the generator-level pT, for photons which satisfy these criteria is within 0.5% (1%) of unity in the barrel (endcap). The pT resolution decreases from 3% to 2% over the measured pT range.
4.2 Jet reconstruction
Jets are reconstructed following the procedure previously used in 2.76 TeV and 5.02 TeV pp and Pb+Pb collisions [14, 15, 52], which is briefly summarised here. The anti-kt algorithm [46] with R = 0.4 is applied to energy deposits in the calorimeter grouped into towers of size ∆η × ∆φ = 0.1 × 0.1. An iterative procedure, based entirely on data, is used to obtain an event-by-event estimate of the average η-dependent UE energy density, including that from pile-up, while excluding from the estimate the contribution from jets arising from a hard scattering. An updated estimate of the jet four-momentum is obtained by subtracting the UE energy from the constituent towers of the jet. This procedure is also applied to pp data. The pTvalues of the resulting jets are corrected for the average calorimeter response using an η- and pT-dependent calibration derived from simulation. An additional correction, derived from in situ studies of events with a jet recoiling against a photon or Z boson and from the differences between the heavy-ion reconstruction algorithm and that normally used in the 13 TeV pp data [53], is applied. A final correction at the analysis level is applied to correct for a deficiency in jet calibration due to it being derived from an event sample with a different jet flavour composition.
The distribution of reconstructed jet pT values was studied in simulation as a function of generator-level jet pT. In pp and Pb+Pb collisions, the jet pT scale is within 1% of unity. In pp collisions, the jet pT resolution decreases from 15% at pT ≈ 30 GeV to 10% at pT ≈ 200 GeV. In Pb+Pb collisions, the resolution at fixed jet pTbecomes worse in more central collisions in a way consistent with the increasing magnitude of UE fluctuations in the jet cone. In the most central events and at the lowest jet-pTvalues, the resolution reaches 50%. At high pT, the resolution asymptotically becomes centrality-independent and,
at 200 GeV, consistent with that in pp collisions. More information about the jet reconstruction and jet performance in this dataset may be found in Ref. [54].
5 Data analysis
5.1 Photon purity and yield
After applying the identification and isolation selection criteria in pp collisions, approximately 19 500, 7800, 4100 and 400 photons are selected with pγT = 63.1–79.6 GeV, 79.6–100 GeV, 100–158 GeV and 158–200 GeV, respectively. In Pb+Pb collisions, the analogous yields are 15 400, 6300, 3500 and 300. These raw yields are determined as a function of pγT and are then corrected for background and for the effects of pTbin migration.
First, the selected photon sample is corrected for the background contribution, primarily from misidentified neutral hadrons. For each pγT and centrality range, the purity of prompt photons within this range is estimated with a double-sideband approach [9,48,49], which is summarised in the following.
In addition to the nominal selection, background-enhanced samples of photon candidates are defined by selecting photons failing at least one of four specific shower-shape requirements (referred to as the “non-tight” selection), or by requiring that they are not isolated such that ETiso > 5 GeV in pp collisions or Eiso
T > 10 GeV in Pb+Pb collisions. Regions A and B are defined as those containing tight photons which are isolated and non-isolated, respectively, with region A corresponding to the signal photon selection. Regions C and D contain non-tight photons which are isolated and non-isolated, respectively. The number of photon candidates in each region is generally a mixture of signal and background photons, i.e. those arising from neutral mesons inside jets. The ETisodistribution for background photons is expected to be the same for the tight and non-tight selections such that the distribution of background photons “factorises” along isolation and identification axes. Separately, the probability that a prompt photon is found in regions B, C or D is determined from simulation. This information and the background factorisation assumption is then applied to the data to determine the purity of photons in region A, defined as the ratio of the number of signal photons to all selected photons. The purity increases systematically with pγTover the measured pTrange. In pp collisions, it rises from ≈ 85% at pγ
T = 80 GeV to more than 95% at 100 GeV, while in Pb+Pb collisions it is typically ≈ 75–90% over the same kinematic range.
The background-corrected prompt photon yields are then corrected for the resolution of the pγT measure-ment. This is performed by comparing the yields, evaluated separately as a function of reconstructed and generator-level pT, in simulation. Given the good pTresolution, these differ by 2% at most, and this small resulting correction is applied to the yields in data.
5.2 Jet background subtraction
The raw jet yields, measured as a function of xJγ, are corrected for two background components using data-driven methods. The corrections are performed separately for each pγTinterval and separately in pp collisions and Pb+Pb collisions of different centrality ranges.
The first background arises from the combination of a high-pT photon with jets unrelated to the photon-producing hard scattering. These include jets from separate hard parton–parton scatterings and UE
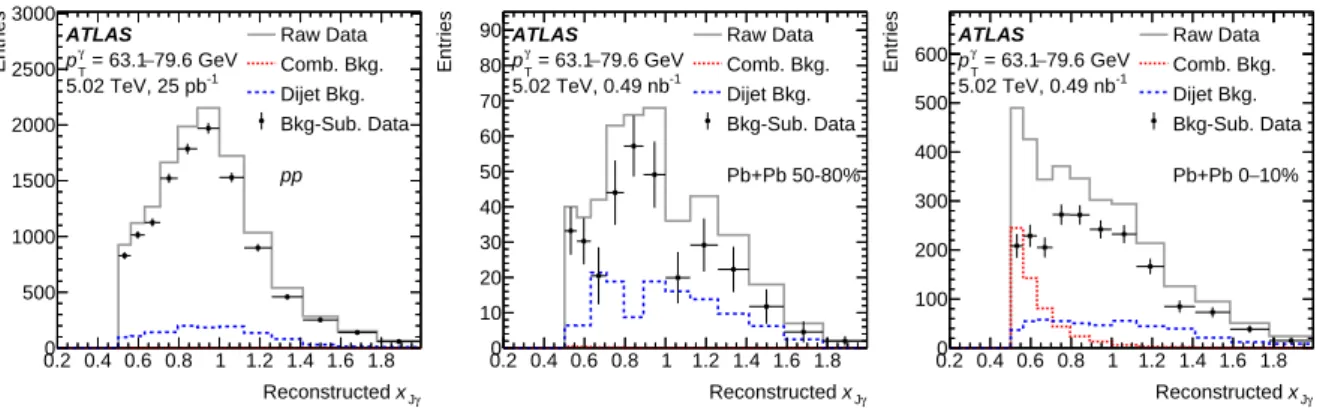
0.2 0.4 0.6 0.8 1 1.2 1.4 1.6 1.8 γ J x Reconstructed 0 500 1000 1500 2000 2500 3000 Entries ATLAS 79.6 GeV − = 63.1 γ T p -1 5.02 TeV, 25 pb Raw Data Comb. Bkg. Dijet Bkg. Bkg-Sub. Data pp 0.2 0.4 0.6 0.8 1 1.2 1.4 1.6 1.8 γ J x Reconstructed 0 10 20 30 40 50 60 70 80 90 Entries ATLAS 79.6 GeV − = 63.1 γ T p -1 5.02 TeV, 0.49 nb Raw Data Comb. Bkg. Dijet Bkg. Bkg-Sub. Data Pb+Pb 50-80% 0.2 0.4 0.6 0.8 1 1.2 1.4 1.6 1.8 γ J x Reconstructed 0 100 200 300 400 500 600 Entries ATLAS 79.6 GeV − = 63.1 γ T p -1 5.02 TeV, 0.49 nb Raw Data Comb. Bkg. Dijet Bkg. Bkg-Sub. Data 10% − Pb+Pb 0
Figure 1: Distributions of the photon–jet pT-balance xJγfor the photon transverse momentum interval p γ
T= 63.1–
79.6 GeV for (left) pp, (centre) 50–80% centrality and (right) 0–10% centrality Pb+Pb events. Solid grey, dotted red, and dashed blue histograms show the raw jet yields, the estimate of the combinatoric background (non-existent for pp events), and the dijet background, respectively. Black points show the background-subtracted data before unfolding, with the vertical bars representing the combined statistical uncertainty from the data and background subtraction procedure.
fluctuations reconstructed as jets. This background is negligible in pp collisions. Because of the inclusive jet selection in the analysis, the combinatoric background is purely additive and can be statistically subtracted after scaling to the total photon yield. The combinatoric jet yields are determined in the data-overlay simulation, by examining the yield of reconstructed jets separated from a generator-level photon by ∆φ > 7π/8. Reconstructed jets that are not consistent with a generator-level jet, i.e. no generator-level jet with pT > 20 GeV within ∆R < 0.4, are deemed to arise from the original Pb+Pb data event and are thus labelled as “combinatoric” jets. The combinatoric jet yields are subtracted from the measured xJγ distributions in data.
The second background is related to the estimated purity of the selected photons. The xJγyields for photon candidates in region A contain an admixture of dijets, specifically jets correlated with misidentified neutral mesons. Since these hadrons pass experimental isolation requirements, they may be, for example, the leading fragment inside a jet. The shape of this background in the xJγ distribution is determined by repeating the analysis for photon candidates in region C, since this region contains mostly neutral mesons that remain isolated at the detector level. The resulting per-photon xJγ distributions are scaled to match the number of background photons, as determined above in Section5.1, and their yields are statistically subtracted from the jet yields for photons in region A.
Figure1shows the size of these backgrounds in the lowest-pγT interval, where they are the largest. The combinatoric jet background for Pb+Pb collisions contributes primarily to kinematic regions populated by pjetT < 50 GeV. It also depends strongly on centrality, being largest in 0–10% collisions but nearly negligible already in 30–50% collisions. The dijet background contributes to a broad range of pjetT values including the region xJγ > 1, since the pT ratio of a jet to one of the hadrons in the balancing jet can generally be above unity. This background has a similar shape in all event types. However, since the photon purity is lower in Pb+Pb events than in pp events, this correction is larger in the former.
5.3 Unfolding
The background-subtracted xJγ yields are corrected for bin-migration effects due to detector resolution via a Bayesian unfolding procedure [55,56]. To accomplish this, the reconstructed yields are arranged in a two-dimensional (pγT, xJγ) matrix with bin edges that are evenly spaced on logarithmic scales (and with values matching those used in previous jet measurements), and a two-dimensional unfolding is performed similar to that for dijet pTcorrelations in Ref. [12]. The unfolding is performed in xJγdirectly to preserve the fine correlation between pjetT and pγT which would be washed out if the unfolding were performed in (pγ
T, p jet
T ). Although the migration along the p γ
Taxis is small, it is necessary to include it since the degree of bin migration in xJγdepends on the pT of the jets.
To fully account for the effects of bin migration across the analysis selection, the axes of the matrix are extended over a larger range of pγT and xJγ than the fiducial region in which the results are reported. A response matrix is determined by matching each pair of (pγT, xJγ) values at the generator level to their counterparts at the reconstruction level, separately for pp events and for each Pb+Pb centrality.
The Bayesian unfolding method requires a choice for the number of iterations, niter, and an assumption for the prior for the initial particle-level distribution. The Pythia simulation does not include the effects of jet energy loss, and thus the underlying particle-level distribution in data is expected to have a shape different from the default prior in the simulation. An initial unfolding using the default Pythia prior is performed for each centrality selection, and the ratios of the unfolded distributions to the generator-level priors in Pythia are fitted with a smooth function in xJγ in each p
γ
T interval. This function is evaluated to give a weight w = w(xJγ, p
γ
T) that is used to reweight the generator-level distribution in simulation and thus construct a nominal prior. Alternative reweightings, used in evaluating the sensitivity to the choice of prior, are determined by applying
√
w (the geometric mean of the nominal reweighting and no reweighting) and w3/2 to the sample. The reconstruction-level xJγ distributions in simulation after each of these reweightings were examined to ensure that they span a reasonable range of values compared to that observed at the reconstruction level in data.
Before applying the unfolding procedure to data, it was tested on simulation. After the nominal reweighting, the Monte Carlo samples were split into two statistically independent subsamples. One subsample was used to populate the response matrix, which was then used to unfold the reconstruction-level distribution in the other subsample. The unfolded result was compared with the original generator-level distribution in the latter sample, which were found to be recovered within the limits of the statistical precision of the samples.
The values of niterused for the nominal results are chosen following the same procedure as in Ref. [12]. For each centrality selection, the unfolded distributions are examined as a function of niter. For each value of niter, a total uncertainty is formed by adding two components in quadrature: (1) the statistical uncertainty of the unfolded data, which grows slowly with niter, and (2) the sum of square differences between the results and those obtained with an alternative prior, which decreases quickly with niter. The final values of niterare chosen to minimise the total uncertainty, and are between two and four.
The unfolded xJγ results are corrected for the jet reconstruction efficiency, evaluated in simulation as the pγT-dependent probability that a generated jet at the given xJγ is successfully reconstructed within the total (pγT, xJγ) range used in the unfolding. This efficiency is typically > 99% for all events in the kinematic regions populated by jets with pT > 50 GeV. In pp collisions, this efficiency falls to ≈ 96% in the lowest-xJγ region for each p
γ
monotonically in increasingly central events, reaching a minimum of ≈ 75% in the lowest-xJγ region in 0–10% centrality events.
6 Systematic uncertainties
The primary sources of systematic uncertainty can be grouped into three major categories: the measure-ment of pjetT; the selection of the photon and measurement of pγT; the modelling and subtraction of the combinatoric background; and the unfolding procedure. For each variation described below, the entire analysis is repeated including the background correction steps and unfolding. The differences between the resulting xJγvalues and the nominal ones are taken as an estimate of the uncertainty from each source. A standard set of uncertainties in the jet pT scale and resolution, following the strategy described in Ref. [57] and commonly used for measurements in 2015 Pb+Pb and pp data [54, 58], are used in this analysis. The impact of the uncertainties is evaluated by modifying the response matrix according to the given variations in the reconstructed jet pT. These include uncertainties in the pT scale derived from
in situ studies of the calorimeter response [47,59], an uncertainty in the resolution derived using data-driven techniques [60], and uncertainties in both which result from a small relative energy-scale difference between the heavy-ion jet reconstruction procedure and that used in
√
s = 13 TeV pp collisions [53]. All of the above uncertainties apply equally to jets in pp and Pb+Pb events. A separate, centrality-dependent uncertainty is included in 0–60% Pb+Pb collisions. This uncertainty accounts for a possible modification of the jet response after energy loss and is evaluated through in situ comparisons of the charged-particle track-jet and calorimeter-jet pTvalues in data and simulation. More details are provided in Refs. [54,57]. No additional uncertainty is included for 60–80% centrality events.
Uncertainties in the photon purity estimate are determined by varying the non-tight identification and isol-ation criteria used to select hadron background candidates and by considering a possible non-factorisisol-ation of the hadron background along the axes used in the double-sideband procedure. The sensitivity to the modelling of photon shower shapes in simulation is evaluated by removing the data-driven corrections to these quantities [50]. Finally, the photon pT scale and resolution uncertainties are described in detail in Ref. [51], and their impact is evaluated by applying them as variations to the response matrices used in unfolding.
Modelling- or unfolding-related systematic uncertainties arise from several sources. The estimate of the combinatoric photon–jet rate in the data-overlay simulation is sensitive to the requirement on the minimum pTof a generator-level jet in the classification of a given reconstructed jet as a combinatoric jet, as opposed to a photon-correlated jet. To provide one estimate of the sensitivity to this threshold, it is varied in the range 20 ± 10 GeV. To assess the sensitivity to the choice of prior, the unfolding is repeated using the alternative priors which are systematically closer to and farther from the original Pythia prior. The sensitivity to statistical limitations of the simulation samples is determined through pseudo-experiments, resampling entries in the response matrices according to their uncertainty. Finally, the analysis is repeated using the Sherpa simulation to perform the corrections and unfolding, since this generator provides a different description of photon–jet production topologies.
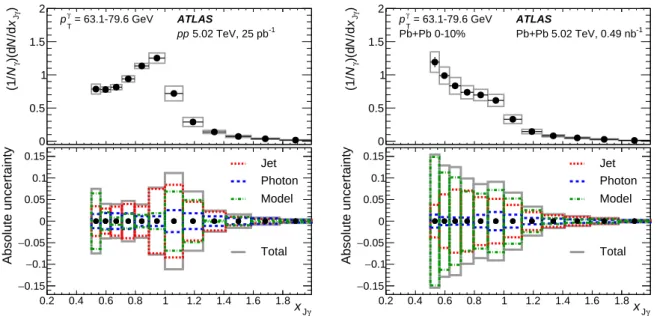
Figure 2summarises the systematic uncertainties in each category, as well as the total uncertainty, for the lowest-pγT interval in pp and 0–10% Pb+Pb events. The jet-related uncertainties are generally the dominant ones, except in more central events and lower-pγTintervals, where the unfolding and modelling uncertainties become co-dominant.
γ J x 0 0.5 1 1.5 2 )γ J x /d N )(dγ N (1/ ATLAS -1 5.02 TeV, 25 pb pp = 63.1-79.6 GeV γ T p 0.2 0.4 0.6 0.8 1 1.2 1.4 1.6 1.8 γ J x 0.15 − 0.1 − 0.05 − 0 0.05 0.1 0.15 Absolute uncertainty Jet Photon Model Total γ J x 0 0.5 1 1.5 2 )γ J x /d N )(dγ N (1/ ATLAS -1 Pb+Pb 5.02 TeV, 0.49 nb Pb+Pb 0-10% = 63.1-79.6 GeV γ T p 0.2 0.4 0.6 0.8 1 1.2 1.4 1.6 1.8 γ J x 0.15 − 0.1 − 0.05 − 0 0.05 0.1 0.15 Absolute uncertainty Jet Photon Model Total
Figure 2: Unfolded distributions and summary of systematic uncertainties in the per-photon jet-yield measurement for pγT= 63.1–79.6 GeV in (left) pp events and (right) 0–10% centrality Pb+Pb events. Top panels show the photon– jet pT-balance xJγdistributions and total uncertainties, while the bottom panels show the absolute uncertainties from
jet-related, photon-related, and modelling or unfolding sources, as well as the total uncertainty.
As an additional check on the features in the unfolded xJγdistributions observed in data, the analysis was repeated with two modifications which change the signal photon–jet definition. First, the photon–jet ∆φ requirement was changed from > 7π/8 to > 3π/4. With this alteration, the correlated jet yield changes only by a small amount, while the combinatoric background, which is constant in ∆φ, doubles. Second, the analysis was repeated, but selecting only the leading (highest-pT) jet in the event if it fell within the ∆φ window. In this case, the combinatoric background contribution is no longer purely additive and the inefficiency when a higher-pT uncorrelated jet is selected instead of the photon-correlated jet must be accounted for, similar to Ref. [12]. In both cases, the distributions in Pb+Pb exhibit a qualitatively similar modification pattern compared to the main results as a function of xJγ.
7 Results
The unfolded (1/Nγ)(dN/dxJγ) distributions in pp collisions are shown for each p γ
Tinterval in Figure3. The distributions are reported for all xJγ bins where the jet minimum pT requirement is fully efficient. Also shown are the corresponding generator-level distributions from the Pythia, Sherpa and Herwig samples. Each generator describes the data fairly well, with Herwig generally overpredicting the yield at large-xJγand Sherpa showing the best agreement over the full xJγrange.
The unfolded (1/Nγ)(dN/dxJγ) distributions in Pb+Pb collisions are presented in Figures 4 through7, with each figure representing a different pγT interval. Since the results are fully corrected, they may be directly compared with the analogous xJγ distributions in pp collisions, which are reproduced in each panel for convenience.
For all pγT intervals, the xJγ distributions in Pb+Pb collisions evolve smoothly with centrality. For peripheral collisions with centrality 50–80%, they are similar to those measured in pp collisions. However, in increasingly more central collisions, the distributions become progressively more modified. For the pγ
T < 100 GeV intervals shown in Figures4and5, the xJγdistributions in the most central 0–10% events are so strongly modified that they decrease monotonically over the measured xJγ range and no peak is observed. For the pγT > 100 GeV region shown in Figure6, the xJγdistributions retain a peak at or near xJγ≈ 0.9 even in the most central collisions. However, the magnitude of the peak is lower and significantly wider than the sharp peak in pp events. In both cases, the jet yield at small xJγ is systematically higher than that in pp collisions, by up to a factor of two. In less central events, a peak-like structure develops at the same position as the maximum in pp events, near xJγ ≈ 0.9. For the lowest-p
γ
T interval, this occurs only for 50–80% centrality events, while in the highest two pγT intervals the distribution in 0–10% events is consistent with a local peak.
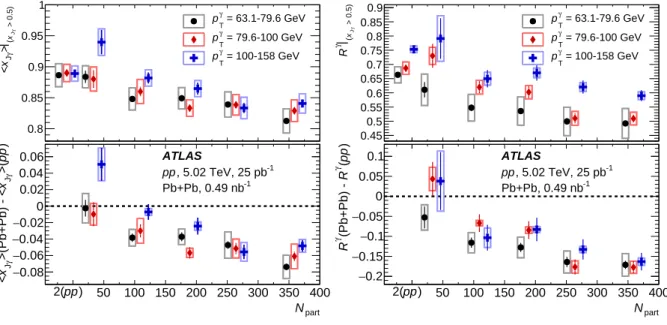
As another way of characterising how the modified xJγdistributions depend on centrality and p γ
T, Figure8 presents their mean value, xJγ
, and integral, Rγ, with both values calculated in the region xJγ > 0.5. These quantities are shown as a function of the mean number of participating nucleons Npart in the corresponding centrality selection, and are plotted for the first three pγT intervals where they have small statistical uncertainties. When measured in the region xJγ > 0.5, the value of xJγ
in pp collisions is observed to be ≈ 0.89 for all pγTintervals. Simulation studies show that, at generator level, the jet yield at xJγ > 0.5 corresponds to only the leading (highest-pT) photon-correlated jet in each event. Thus, xJγ
can be interpreted as a conditional per-jet fractional energy loss, and Rγcan be interpreted as the fraction of photons with a leading jet above xJγ = 0.5. In pp collisions, Rγ ranges from 0.65 to 0.75 in the three pγ
Tintervals shown, which is below unity due to the jet selection criteria (∆φ > 7π/8, |η| < 2.8). In Pb+Pb events, xJγ
decreases monotonically from the value in pp collisions as the collisions become more central. In the most central collisions, it is below the pp value by 0.04–0.06, depending on the pγT interval, while in peripheral collisions it reaches a value which is statistically compatible with that in pp events. The Rγ value also decreases monotonically as the collisions become more central, reflecting the overall shift of the xJγ value of leading jets below xJγ = 0.5. At low p
γ
T in central Pb+Pb collisions, R γ reaches the value of 0.5, which is only ≈ 75% of its value in pp collisions.
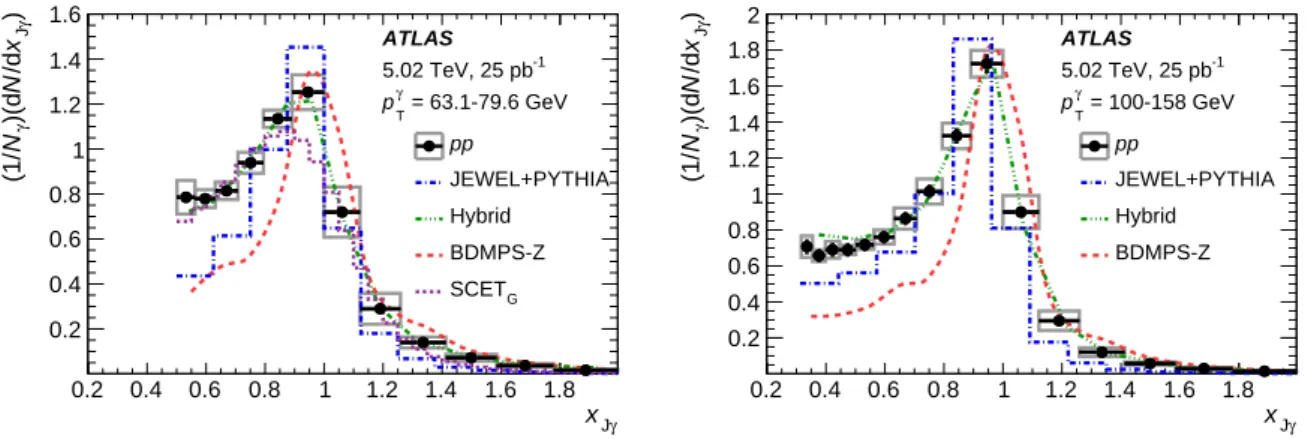
The results are compared with the following theoretical predictions which include Monte Carlo generators and analytical calculations of jet energy loss: (1) a pQCD calculation which includes Sudakov resummation to describe the vacuum distributions and energy loss in Pb+Pb collisions as described in the BDMPS-Z formalism [26], (2) a perturbative calculation within the framework of soft-collinear effective field theory with Glauber gluons (SCETG) in the soft gluon emission (energy-loss) limit [27], (3) the JEWEL Monte Carlo event generator which simulates QCD jet evolution in heavy-ion collisions and includes energy-loss effects from radiative and elastic scattering processes [28], and (4) the Hybrid Strong/Weak Coupling model [29] which combines initial production using Pythia with a parameterisation of energy loss derived from holographic methods, and includes back-reaction effects.
Figures9and10compare a selection of the measured xJγdistributions with the results of these theoretical predictions, where possible. Before testing the description of energy-loss effects in Pb+Pb events, the predicted xJγ distributions are compared with pp data in Figure 9. The Hybrid model and JEWEL, which use Pythia for the photon–jet production in vacuum, give a good description of pp events over the measured xJγrange in both p
γ
Tintervals shown. The BDMPS-Z and SCETGperturbative calculations capture the general features but predict distributions that are more and less peaked, respectively, than those in data.
γ J x 0 0.2 0.4 0.6 0.8 1 1.2 1.4 1.6 1.8 2 )γ J x /d N )(dγ N (1/ ATLAS -1 5.02 TeV, 25 pb pp Data Pythia8 Sherpa Herwig A14 NNPDF23LO CT10 H7UE MMHT2014lo = 63.1-79.6 GeV γ T p 0.2 0.4 0.6 0.8 1 1.2 1.4 1.6 1.8 γ J x 0.6 0.7 0.8 0.9 1 1.1 1.2 1.3 1.4 )γ J x /d N )(dγ N Ratio of (1/ γ J x 0 0.2 0.4 0.6 0.8 1 1.2 1.4 1.6 1.8 2 )γ J x /d N )(dγ N (1/ ATLAS -1 5.02 TeV, 25 pb pp Data Pythia8 Sherpa Herwig A14 NNPDF23LO CT10 H7UE MMHT2014lo = 79.6-100 GeV γ T p 0.2 0.4 0.6 0.8 1 1.2 1.4 1.6 1.8 γ J x 0.6 0.7 0.8 0.9 1 1.1 1.2 1.3 1.4 )γ J x /d N )(dγ N Ratio of (1/ γ J x 0.2 0.4 0.6 0.8 1 1.2 1.4 1.6 1.8 2 2.2 )γ J x /d N )(dγ N (1/ ATLAS -1 5.02 TeV, 25 pb pp Data Pythia8 Sherpa Herwig A14 NNPDF23LO CT10 H7UE MMHT2014lo = 100-158 GeV γ T p 0.2 0.4 0.6 0.8 1 1.2 1.4 1.6 1.8 γ J x 0.6 0.7 0.8 0.9 1 1.1 1.2 1.3 1.4 )γ J x /d N )(dγ N Ratio of (1/ γ J x 0.2 0.4 0.6 0.8 1 1.2 1.4 1.6 1.8 2 2.2 )γ J x /d N )(dγ N (1/ ATLAS -1 5.02 TeV, 25 pb pp Data Pythia8 Sherpa Herwig A14 NNPDF23LO CT10 H7UE MMHT2014lo = 158-200 GeV γ T p 0.2 0.4 0.6 0.8 1 1.2 1.4 1.6 1.8 γ J x 0.6 0.7 0.8 0.9 1 1.1 1.2 1.3 1.4 )γ J x /d N )(dγ N Ratio of (1/
Figure 3: Photon–jet pT-balance distributions (1/Nγ)(dN/dxJγ) in pp collisions, each panel showing a different
photon-pTinterval. The unfolded results are compared with the particle-level distributions from three Monte Carlo
event generators. Bottom panels show the ratios of the generators to the pp data. Total systematic uncertainties are shown as boxes, while statistical uncertainties are shown as vertical bars.
0.2 0.4 0.6 0.8 1 1.2 1.4 1.6 1.8 γ J x 0.2 0.4 0.6 0.8 1 1.2 1.4 1.6 1.8 2 )γ J x /d N )(dγ N (1/ 0.2 0.4 0.6 0.8 1 1.2 1.4 1.6 1.8 0.2 0.4 0.6 0.8 1 1.2 1.4 1.6 1.8 γ J x 0.2 0.4 0.6 0.81 1.2 1.4 1.6 1.82 )γ J x /d N )(dγ N (1/ 0.2 0.4 0.6 0.8 1 1.2 1.4 1.6 1.8 γ J x 0.2 0.4 0.6 0.8 1 1.2 1.4 1.6 1.8xJγ
50-80%
30-50%
20-30%
10-20%
0-10%
ATLAS -1 5.02 TeV, 25 pb pp -1 Pb+Pb 5.02 TeV, 0.49 nb = 63.1-79.6 GeV γ T p(same each panel)
pp
Pb+Pb
Figure 4: Photon–jet pT-balance distributions (1/Nγ)(dN/dxJγ) in Pb+Pb events (red circles) with each panel
showing a different centrality selection compared to that in pp events (blue squares). These panels show results for pγ
T= 63.1–79.6 GeV. Total systematic uncertainties are shown as boxes, while statistical uncertainties are shown
as vertical bars. 0.2 0.4 0.6 0.8 1 1.2 1.4 1.6 1.8 γ J x 0.2 0.4 0.6 0.8 1 1.2 1.4 1.6 1.8 2 )γ J x /d N )(dγ N (1/ 0.2 0.4 0.6 0.8 1 1.2 1.4 1.6 1.8 0.2 0.4 0.6 0.8 1 1.2 1.4 1.6 1.8 γ J x 0.2 0.4 0.6 0.81 1.2 1.4 1.6 1.82 )γ J x /d N )(dγ N (1/ 0.2 0.4 0.6 0.8 1 1.2 1.4 1.6 1.8 γ J x 0.2 0.4 0.6 0.8 1 1.2 1.4 1.6 1.8xJγ
50-80%
30-50%
20-30%
10-20%
0-10%
ATLAS -1 5.02 TeV, 25 pb pp -1 Pb+Pb 5.02 TeV, 0.49 nb = 79.6-100 GeV γ T p(same each panel)
pp
Pb+Pb
Figure 5: Photon–jet pT-balance distributions (1/Nγ)(dN/dxJγ) in Pb+Pb events (red circles) with each panel
showing a different centrality selection compared to that in pp events (blue squares). These panels show results for pγ
T= 79.6–100 GeV. Total systematic uncertainties are shown as boxes, while statistical uncertainties are shown as
0.2 0.4 0.6 0.8 1 1.2 1.4 1.6 1.8 γ J x 0.2 0.4 0.6 0.81 1.2 1.4 1.6 1.82 2.2 )γ J x /d N )(dγ N (1/ 0.2 0.4 0.6 0.8 1 1.2 1.4 1.6 1.8 0.2 0.4 0.6 0.8 1 1.2 1.4 1.6 1.8 γ J x 0.2 0.4 0.6 0.81 1.2 1.4 1.6 1.82 2.2 )γ J x /d N )(dγ N (1/ 0.2 0.4 0.6 0.8 1 1.2 1.4 1.6 1.8 γ J x 0.2 0.4 0.6 0.8 1 1.2 1.4 1.6 1.8xJγ
50-80%
30-50%
20-30%
10-20%
0-10%
ATLAS -1 5.02 TeV, 25 pb pp -1 Pb+Pb 5.02 TeV, 0.49 nb = 100-158 GeV γ T p(same each panel)
pp
Pb+Pb
Figure 6: Photon–jet pT-balance distributions (1/Nγ)(dN/dxJγ) in Pb+Pb events (red circles) with each panel
showing a different centrality selection compared to that in pp events (blue squares). These panels show results for pγ
T= 100–158 GeV. Total systematic uncertainties are shown as boxes, while statistical uncertainties are shown as
vertical bars. 0.2 0.4 0.6 0.8 1 1.2 1.4 1.6 1.8 γ J x 0.2 0.4 0.6 0.81 1.2 1.4 1.6 1.82 2.2 )γ J x /d N )(dγ N (1/ 0.2 0.4 0.6 0.8 1 1.2 1.4 1.6 1.8 0.2 0.4 0.6 0.8 1 1.2 1.4 1.6 1.8 γ J x 0.2 0.4 0.6 0.81 1.2 1.4 1.6 1.82 2.2 )γ J x /d N )(dγ N (1/ 0.2 0.4 0.6 0.8 1 1.2 1.4 1.6 1.8 γ J x 0.2 0.4 0.6 0.8 1 1.2 1.4 1.6 1.8xJγ
50-80%
30-50%
20-30%
10-20%
0-10%
ATLAS -1 5.02 TeV, 25 pb pp -1 Pb+Pb 5.02 TeV, 0.49 nb = 158-200 GeV γ T p(same each panel)
pp
Pb+Pb
Figure 7: Photon–jet pT-balance distributions (1/Nγ)(dN/dxJγ) in Pb+Pb events (red circles) with each panel
showing a different centrality selection compared to that in pp events (blue squares). These panels show results for pγ
T= 158–200 GeV. Total systematic uncertainties are shown as boxes, while statistical uncertainties are shown as
0 50 100 150 200 250 300 350 400 part N 0.8 0.85 0.9 0.95 1 > 0.5) γ J x ( >γ J x < = 63.1-79.6 GeV γ T p = 79.6-100 GeV γ T p = 100-158 GeV γ T p 0 50 100 150 200 250 300 350 400 part N 0.08 − 0.06 − 0.04 − 0.02 − 0 0.02 0.04 0.06 ) pp >(γ J x >(Pb+Pb) - <γ J x < ) pp 2( ATLAS -1 , 5.02 TeV, 25 pb pp -1 Pb+Pb, 0.49 nb 0 50 100 150 200 250 300 350 400 part N 0.45 0.5 0.55 0.6 0.65 0.7 0.75 0.8 0.85 0.9 > 0.5)γ J x ( γ R = 63.1-79.6 GeV γ T p = 79.6-100 GeV γ T p = 100-158 GeV γ T p 0 50 100 150 200 250 300 350 400 part N 0.2 − 0.15 − 0.1 − 0.05 − 0 0.05 0.1 ) pp( γ R (Pb+Pb) - γ R ) pp 2( ATLAS -1 , 5.02 TeV, 25 pb pp -1 Pb+Pb, 0.49 nb
Figure 8: Summary of (left) the mean jet-to-photon pTratio xJγ
and (right) the total per-photon jet yield Rγ, calculated in the region xJγ > 0.5. The values are presented as a function of the mean number of participating
nucleons Npartin top panels. Each colour and symbol represents a different p γ
Tinterval, where the lowest and highest
intervals are displaced horizontally for clarity. The points plotted at Npart = 2 correspond to pp collisions. The
bottom panels show the difference between the Pb+Pb centrality selection and pp collisions. Boxes show the total systematic uncertainty while the vertical bars represent statistical uncertainties.
In Pb+Pb events with low pγT, shown in the left panel of Figure 10, the JEWEL, Hybrid, and SCETG models successfully capture several key features of the xJγdistribution, including the absence of a visible peak, and the monotonically increasing behaviour with decreasing xJγ. The BDMPS-Z model predicts a suppression of the yield near xJγ ≈ 0.9 relative to what is predicted in pp events, consistent with the trend in data. However, it underestimates the yield at low xJγ in both pp and Pb+Pb collisions. In the higher-pγT interval, the Hybrid model and JEWEL successfully describe the reappearance of a localised peak near xJγ ≈ 0.9. However, none of the models considered here describe the increase of the jet yield at xJγ < 0.5 above that observed in pp events. Additional comparisons between these data and theoretical calculations which are differential in both pγT and centrality will further constrain the description of the strongly coupled medium in these models.
8 Conclusion
This Letter presents a study of photon–jet transverse momentum correlations for photons with 63.1 < pγ
T< 200 GeV in Pb+Pb collisions at √
sNN = 5.02 TeV and pp collisions at√s= 5.02 TeV. The data were recorded with the ATLAS detector at the LHC and correspond to integrated luminosities of 0.49 nb−1and 25 pb−1, respectively. The data are corrected for the presence of combinatoric photon–jet pairs and of dijet pairs where one of the jets is misidentified as a photon. The measured quantities in data are fully corrected for detector effects and reported at the particle level. Per-photon distributions of the jet-to-photon pTratio, xJγ = pjet
T /p γ
0.2 0.4 0.6 0.8 1 1.2 1.4 1.6 1.8 γ J x 0.2 0.4 0.6 0.8 1 1.2 1.4 1.6 )γ J x /d N )(dγ N (1/ ATLAS -1 5.02 TeV, 25 pb = 63.1-79.6 GeV γ T p pp JEWEL+PYTHIA Hybrid BDMPS-Z G SCET 0.2 0.4 0.6 0.8 1 1.2 1.4 1.6 1.8 γ J x 0.2 0.4 0.6 0.8 1 1.2 1.4 1.6 1.8 2 )γ J x /d N )(dγ N (1/ ATLAS -1 5.02 TeV, 25 pb = 100-158 GeV γ T p pp JEWEL+PYTHIA Hybrid BDMPS-Z
Figure 9: Photon–jet pT-balance distributions (1/Nγ)(dN/dxJγ) in pp collisions for (left) p γ
T= 63.1–79.6 GeV and
(right) pγT= 100–158 GeV. The unfolded results are compared with the theoretical calculations shown as dashed coloured lines (see text). Total systematic uncertainties are shown as boxes, while statistical uncertainties are shown as vertical bars. 0.2 0.4 0.6 0.8 1 1.2 1.4 1.6 1.8 γ J x 0.2 0.4 0.6 0.8 1 1.2 1.4 1.6 )γ J x /d N )(dγ N (1/ ATLAS -1 5.02 TeV, 0.49 nb = 63.1-79.6 GeV γ T p Pb+Pb 0-10% JEWEL+PYTHIA Hybrid BDMPS-Z /fm) 2 =2-8 GeV q ( G SCET (g = 2.0-2.2) 0.2 0.4 0.6 0.8 1 1.2 1.4 1.6 1.8 γ J x 0.2 0.4 0.6 0.8 1 1.2 1.4 1.6 1.8 2 )γ J x /d N )(dγ N (1/ ATLAS -1 5.02 TeV, 0.49 nb = 100-158 GeV γ T p Pb+Pb 0-10% JEWEL+PYTHIA Hybrid BDMPS-Z /fm) 2 =2-8 GeV q (
Figure 10: Photon–jet pT-balance distributions (1/Nγ)(dN/dxJγ) in 0–10% Pb+Pb collisions for (left) p γ
T= 63.1–
79.6 GeV and (right) pγT = 100–158 GeV. The unfolded results are compared with the theoretical calculations shown as dashed coloured lines denoting central values or coloured bands which correspond to a range of theoretical parameters (see text). Total systematic uncertainties are shown as boxes, while statistical uncertainties are shown as vertical bars.
events, the data are well reproduced by event generators or models that depend on them, but are not fully described in detail by approaches based on perturbative calculations.
In Pb+Pb collisions, xJγdistributions are observed to have a significantly modified total yield and shape compared with those in pp collisions. These modifications have a smooth onset as a function of Pb+Pb event centrality and pγT. In peripheral collisions at high pγT, the distributions in Pb+Pb are statistically compatible with those in pp. In the most central Pb+Pb events at low pγT, the yield decreases monotonically with increasing xJγ over the measured range, in strong contrast to the sharply peaked distributions in pp events. However, in less central events or in higher-pγT intervals, the xJγ distributions retain a peak-like excess at an xJγ value similar to that in pp collisions but with a smaller per-photon yield. This last observation suggests that the amount of energy lost by jets in single events has a broad distribution, with
a small but significant population of jets retaining a pp-like pT correlation with the photon because they do not lose an appreciable amount of energy.
These results are sensitive to how partons initially produced opposite to a high-pT photon lose energy in their interactions with the hot nuclear medium. Taken together with other measurements of single-jet and dijet production, the data provide new, complementary information about how energy loss in the strongly coupled medium varies with the initial parton flavour and pT.
Acknowledgements
We thank CERN for the very successful operation of the LHC, as well as the support staff from our institutions without whom ATLAS could not be operated efficiently.
We acknowledge the support of ANPCyT, Argentina; YerPhI, Armenia; ARC, Australia; BMWFW and FWF, Austria; ANAS, Azerbaijan; SSTC, Belarus; CNPq and FAPESP, Brazil; NSERC, NRC and CFI, Canada; CERN; CONICYT, Chile; CAS, MOST and NSFC, China; COLCIENCIAS, Colombia; MSMT CR, MPO CR and VSC CR, Czech Republic; DNRF and DNSRC, Denmark; IN2P3-CNRS, CEA-DRF/IRFU, France; SRNSFG, Georgia; BMBF, HGF, and MPG, Germany; GSRT, Greece; RGC, Hong Kong SAR, China; ISF and Benoziyo Center, Israel; INFN, Italy; MEXT and JSPS, Japan; CNRST, Morocco; NWO, Netherlands; RCN, Norway; MNiSW and NCN, Poland; FCT, Portugal; MNE/IFA, Romania; MES of Russia and NRC KI, Russian Federation; JINR; MESTD, Serbia; MSSR, Slovakia; ARRS and MIZŠ, Slovenia; DST/NRF, South Africa; MINECO, Spain; SRC and Wallenberg Foundation, Sweden; SERI, SNSF and Cantons of Bern and Geneva, Switzerland; MOST, Taiwan; TAEK, Turkey; STFC, United Kingdom; DOE and NSF, United States of America. In addition, individual groups and members have received support from BCKDF, CANARIE, CRC and Compute Canada, Canada; COST, ERC, ERDF, Horizon 2020, and Marie Skłodowska-Curie Actions, European Union; Investissements d’ Avenir Labex and Idex, ANR, France; DFG and AvH Foundation, Germany; Herakleitos, Thales and Aristeia programmes co-financed by EU-ESF and the Greek NSRF, Greece; BSF-NSF and GIF, Israel; CERCA Programme Generalitat de Catalunya, Spain; The Royal Society and Leverhulme Trust, United Kingdom.
The crucial computing support from all WLCG partners is acknowledged gratefully, in particular from CERN, the ATLAS Tier-1 facilities at TRIUMF (Canada), NDGF (Denmark, Norway, Sweden), CC-IN2P3 (France), KIT/GridKA (Germany), INFN-CNAF (Italy), NL-T1 (Netherlands), PIC (Spain), ASGC (Taiwan), RAL (UK) and BNL (USA), the Tier-2 facilities worldwide and large non-WLCG resource providers. Major contributors of computing resources are listed in Ref. [61].
References
[1] X.-N. Wang, Z. Huang and I. Sarcevic, Jet Quenching in the Direction Opposite to a Tagged
Photon in High-Energy Heavy-Ion Collisions,Phys. Rev. Lett. 77 (1996) 231, arXiv:hep-ph/9605213.
[2] X.-N. Wang and Z. Huang,
Medium-induced parton energy loss inγ + jet events of high-energy heavy-ion collisions,
Phys. Rev. C 55 (1997) 3047, arXiv:hep-ph/9701227. [3] G.-Y. Qin, J. Ruppert, C. Gale, S. Jeon and G. D. Moore,
Jet energy loss, photon production, and photon-hadron correlations at energies available at the BNL Relativistic Heavy Ion Collider (RHIC),Phys. Rev. C 80 (2009) 054909,
arXiv:0906.3280 [hep-ph].
[4] T. Renk, γ-hadron correlations as a tool to trace the flow of energy lost from hard partons in
heavy-ion collisions,Phys. Rev. C 80 (2009) 014901, arXiv:0904.3806 [hep-ph].
[5] G.-Y. Qin, Parton shower evolution in medium and nuclear modification of photon-tagged jets in
Pb+Pb collisions at the LHC,Eur. Phys. J. C 74 (2014) 2959, arXiv:1210.6610 [hep-ph]. [6] X.-N. Wang and Y. Zhu, Medium Modification of γ-jets in High-energy Heavy-ion Collisions,
Phys. Rev. Lett. 111 (2013) 062301, arXiv:1302.5874 [hep-ph]. [7] W. Dai, I. Vitev and B.-W. Zhang,
Momentum Imbalance of Isolated Photon-Tagged Jet Production at RHIC and LHC,
Phys. Rev. Lett. 110 (2013) 142001, arXiv:1207.5177 [hep-ph]. [8] PHENIX Collaboration,
Measurement of Direct Photons in Au+Au Collisions at√sN N = 200 GeV,
Phys. Rev. Lett. 109 (2012) 152302, arXiv:1205.5759 [nucl-ex]. [9] ATLAS Collaboration,
Centrality, rapidity and transverse momentum dependence of isolated prompt photon production in lead–lead collisions at√sNN= 2.76 TeV measured with the ATLAS detector,
Phys. Rev. C 93 (2016) 034914, arXiv:1506.08552 [hep-ex]. [10] F. Arleo, K. J. Eskola, H. Paukkunen and C. A. Salgado,
Inclusive prompt photon production in nuclear collisions at RHIC and LHC,JHEP 04 (2011) 055, arXiv:1103.1471 [hep-ph].
[11] ATLAS Collaboration, Observation of a Centrality-Dependent Dijet Asymmetry in Lead–Lead
Collisions at√sNN= 2.76 TeV with the ATLAS Detector at the LHC, Phys. Rev. Lett. 105 (2010) 252303, arXiv:1011.6182 [hep-ex].
[12] ATLAS Collaboration, Measurement of jet p√ Tcorrelations in Pb+Pb and pp collisions at sNN= 2.76 TeV with the ATLAS detector,Phys. Lett. B 774 (2017) 379,
arXiv:1706.09363 [hep-ex]. [13] CMS Collaboration,
Observation and studies of jet quenching in PbPb collisions at√sNN = 2.76 TeV, Phys. Rev. C 84 (2011) 024906, arXiv:1102.1957 [nucl-ex].
[14] ATLAS Collaboration, Measurement of the jet radius and transverse momentum dependence of
inclusive jet suppression in lead–lead collisions at√sNN = 2.76 TeV with the ATLAS detector, Phys. Lett. B 719 (2013) 220, arXiv:1208.1967 [hep-ex].
[15] ATLAS Collaboration, Measurements of the Nuclear Modification Factor for Jets in Pb+Pb
Collisions at√sNN= 2.76 TeV with the ATLAS Detector,Phys. Rev. Lett. 114 (2015) 072302, arXiv:1411.2357 [hep-ex].
[16] CMS Collaboration,
Jet momentum dependence of jet quenching in PbPb collisions at√sNN = 2.76 TeV, Phys. Lett. B 712 (2012) 176, arXiv:1202.5022 [nucl-ex].
[17] ATLAS Collaboration, Measurement of charged-particle spectra in Pb+Pb collisions at√ sNN= 2.76 TeV with the ATLAS detector at the LHC,JHEP 09 (2015) 050,
arXiv:1504.04337 [hep-ex]. [18] CMS Collaboration,
Charged-particle nuclear modification factors in PbPb and pPb collisions at√sNN= 5.02 TeV, JHEP 04 (2017) 039, arXiv:1611.01664 [hep-ex].
[19] ALICE Collaboration, Transverse momentum spectra and nuclear modification factors of charged
particles in pp, p-Pb and Pb-Pb collisions at the LHC, (2018), arXiv:1802.09145 [nucl-ex]. [20] PHENIX Collaboration,
Photon-Hadron Jet Correlations in p+p and Au+Au Collisions at√sNN = 200 GeV, Phys. Rev. C 80 (2009) 024908, arXiv:0903.3399 [nucl-ex].
[21] PHENIX Collaboration, Medium modification of jet fragmentation in Au + Au collisions at√ sN N = 200 GeV measured in direct photon-hadron correlations,
Phys. Rev. Lett. 111 (2013) 032301, arXiv:1212.3323 [nucl-ex]. [22] STAR Collaboration,
Jet-like correlations with direct-photon and neutral-pion Triggers at√sN N = 200 GeV, Phys. Lett. B 760 (2016) 689, arXiv:1604.01117 [nucl-ex].
[23] CMS Collaboration, Studies of jet quenching using isolated-photon+jet correlations in PbPb and pp collisions at√sNN = 2.76 TeV,Phys. Lett. B 718 (2013) 773, arXiv:1205.0206 [nucl-ex]. [24] CMS Collaboration, Study of jet quenching with isolated-photon+jet correlations in PbPb and pp
collisions at√sNN = 5.02 TeV,Phys. Lett. B 785 (2018) 14, arXiv:1711.09738 [nucl-ex]. [25] ATLAS Collaboration, Measurement of jet fragmentation in Pb+Pb and pp collisions at√
sNN= 2.76 TeV with the ATLAS detector at the LHC,Eur. Phys. J. C 77 (2017) 379, arXiv:1702.00674 [hep-ex].
[26] L. Chen et al., Study of Isolated-photon and Jet Momentum Imbalance in pp and PbPb collisions, Nucl. Phys. B933 (2018) 306, arXiv:1803.10533 [hep-ph].
[27] Z.-B. Kang, I. Vitev and H. Xing, Vector-boson-tagged jet production in heavy ion collisions at
energies available at the CERN Large Hadron Collider,Phys. Rev. C 96 (2017) 014912, arXiv:1702.07276 [hep-ph].
[28] R. Kunnawalkam Elayavalli and K. C. Zapp,
Simulating V+jet processes in heavy ion collisions with JEWEL,Eur. Phys. J. C 76 (2016) 695, arXiv:1608.03099 [hep-ph].
[29] J. Casalderrey-Solana, D. C. Gulhan, J. G. Milhano, D. Pablos and K. Rajagopal,
Predictions for boson-jet observables and fragmentation function ratios from a hybrid strong/weak coupling model for jet quenching,JHEP 03 (2016) 053,
[30] ATLAS Collaboration, The ATLAS Experiment at the CERN Large Hadron Collider, JINST 3 (2008) S08003.
[31] ATLAS Collaboration, Performance of the ATLAS trigger system in 2015, Eur. Phys. J. C 77 (2017) 317, arXiv:1611.09661 [hep-ex].
[32] ATLAS Collaboration, Measurement of longitudinal flow de-correlations in Pb+Pb collisions at√ sNN= 2.76 and 5.02 TeV with the ATLAS detector,Eur. Phys. J. C 78 (2018) 142,
arXiv:1709.02301 [nucl-ex]. [33] ATLAS Collaboration,
Measurement of the pseudorapidity and transverse momentum dependence of the elliptic flow of charged particles in lead–lead collisions at√sNN = 2.76 TeV with the ATLAS detector,
Phys. Lett. B 707 (2012) 330, arXiv:1108.6018 [hep-ex]. [34] M. L. Miller, K. Reygers, S. J. Sanders and P. Steinberg,
Glauber modeling in high energy nuclear collisions,Ann. Rev. Nucl. Part. Sci. 57 (2007) 205, arXiv:nucl-ex/0701025 [nucl-ex].
[35] ATLAS Collaboration, Prompt and non-prompt J/ψ and ψ(2S) suppression at high transverse
momentum in 5.02 TeV Pb+Pb collisions with the ATLAS experiment,
Eur. Phys. J. C78 (2018) 762, arXiv:1805.04077 [nucl-ex].
[36] S. Agostinelli et al., GEANT4: a simulation toolkit,Nucl. Instrum. Meth. A 506 (2003) 250. [37] ATLAS Collaboration, The ATLAS Simulation Infrastructure,Eur. Phys. J. C 70 (2010) 823,
arXiv:1005.4568 [physics.ins-det].
[38] T. Sjöstrand, S. Mrenna and P. Z. Skands, A brief introduction to PYTHIA 8.1, Comput. Phys. Commun. 178 (2008) 852, arXiv:0710.3820 [hep-ph].
[39] R. D. Ball et al., Parton distributions with LHC data,Nucl. Phys. B 867 (2013) 244, arXiv:1207.1303 [hep-ph].
[40] ATLAS Collaboration, ATLAS Pythia 8 tunes to 7 TeV data, ATL-PHYS-PUB-2014-021, 2014, url:https://cds.cern.ch/record/1966419.
[41] T. Gleisberg et al., Event generation with SHERPA 1.1,JHEP 02 (2009) 007, arXiv:0811.4622 [hep-ph].
[42] H.-L. Lai et al., New parton distributions for collider physics,Phys. Rev. D 82 (2010) 074024, arXiv:1007.2241 [hep-ph].
[43] J. Bellm et al., Herwig 7.0/Herwig++ 3.0 release note,Eur. Phys. J. C 76 (2016) 196, arXiv:1512.01178 [hep-ph].
[44] L. A. Harland-Lang, A. D. Martin, P. Motylinski and R. S. Thorne,
Parton distributions in the LHC era: MMHT 2014 PDFs,Eur. Phys. J. C 75 (2015) 204, arXiv:1412.3989 [hep-ph].
[45] M. Cacciari, G. P. Salam and G. Soyez, The anti-kt jet clustering algorithm,JHEP 04 (2008) 063, arXiv:0802.1189 [hep-ph].
[46] M. Cacciari, G. P. Salam and G. Soyez, FastJet user manual,Eur. Phys. J. C 72 (2012) 1896, arXiv:1111.6097 [hep-ph].
[47] ATLAS Collaboration,
Jet energy measurement with the ATLAS detector in proton–proton collisions at√s= 7 TeV, Eur. Phys. J. C 73 (2013) 2304, arXiv:1112.6426 [hep-ex].
[48] ATLAS Collaboration, Measurement of the inclusive isolated prompt photon cross section in pp
collisions at√s= 8 TeV with the ATLAS detector,JHEP 08 (2016) 005, arXiv:1605.03495 [hep-ex].
[49] ATLAS Collaboration, Measurement of the cross section for inclusive isolated-photon production
in pp collisions at√s= 13 TeV using the ATLAS detector,Phys. Lett. B 770 (2017) 473, arXiv:1701.06882 [hep-ex].
[50] ATLAS Collaboration, Photon identification in 2015 ATLAS data, ATL-PHYS-PUB-2016-014, 2016, url:https://cds.cern.ch/record/2203125.
[51] ATLAS Collaboration, Electron and photon energy calibration with the ATLAS detector using
data collected in 2015 at√s= 13 TeV, ATL-PHYS-PUB-2016-015, 2016, url:https://cds.cern.ch/record/2203514.
[52] ATLAS Collaboration, Centrality and rapidity dependence of inclusive jet production in√ sNN= 5.02 TeV proton-lead collisions with the ATLAS detector,Phys. Lett. B 748 (2015) 392, arXiv:1412.4092 [hep-ex].
[53] ATLAS Collaboration, Jet energy scale measurements and their systematic uncertainties in
proton–proton collisions at√s= 13 TeV with the ATLAS detector, Phys. Rev. D 96 (2017) 072002, arXiv:1703.09665 [hep-ex].
[54] ATLAS Collaboration, Measurement of the nuclear modification factor for inclusive jets in
Pb+Pb collisions at√sNN= 5.02 TeV with the ATLAS detector, (2018), arXiv:1805.05635 [nucl-ex].
[55] G. D’Agostini, A multidimensional unfolding method based on Bayes’ theorem, Nucl. Instrum. Meth. A 362 (1995) 487.
[56] T. Adye, Unfolding algorithms and tests using RooUnfold,(2011), arXiv:1105.1160 [physics.data-an].
[57] ATLAS Collaboration,
Jet energy scale and its uncertainty for jets reconstructed using the ATLAS heavy ion jet algorithm,
ATLAS-CONF-2015-016, 2015, url:https://cds.cern.ch/record/2008677. [58] ATLAS Collaboration, Measurement of jet fragmentation in Pb+Pb and pp collisions at√
sN N = 5.02 TeV with the ATLAS detector,Phys. Rev. C 98 (2018) 024908, arXiv:1805.05424 [nucl-ex].
[59] ATLAS Collaboration, Jet Calibration and Systematic Uncertainties for Jets Reconstructed in the
ATLAS Detector at√s= 13 TeV, ATL-PHYS-PUB-2015-015, 2015, url:https://cds.cern.ch/record/2037613.
[60] ATLAS Collaboration, Data-driven determination of the energy scale and resolution of jets
reconstructed in the ATLAS calorimeters using dijet and multijet events at√s= 8 TeV, ATLAS-CONF-2015-017, 2015, url:https://cds.cern.ch/record/2008678. [61] ATLAS Collaboration, ATLAS Computing Acknowledgements 2016–2017,