BHive: A Benchmark Suite and Measurement Framework
for Validating x86-64 Basic Block Performance Models
The MIT Faculty has made this article openly available.
Please share
how this access benefits you. Your story matters.
Citation
Chen, Yishen et al. "BHive: A Benchmark Suite and Measurement
Framework for Validating x86-64 Basic Block Performance Models."
2019 IEEE International Symposium on Workload Characterization,
November 2019, Orlando, Florida, Institute of Electrical and
Electronics Engineers, March 2020. © 2019 IEEE
As Published
http://dx.doi.org/10.1109/iiswc47752.2019.9042166
Publisher
Institute of Electrical and Electronics Engineers (IEEE)
Version
Author's final manuscript
Citable link
https://hdl.handle.net/1721.1/128755
Terms of Use
Creative Commons Attribution-Noncommercial-Share Alike
BHive: A Benchmark Suite and Measurement
Framework for Validating x86-64 Basic Block
Performance Models
Yishen Chen
∗, Ajay Brahmakshatriya
∗, Charith Mendis
∗, Alex Renda
∗,
Eric Atkinson
∗, Ondˇrej S´ykora
†, Saman Amarasinghe
∗, and Michael Carbin
∗∗Massachusetts Institute of Technology
{ychen306,ajaybr,charithm,renda,eatkinson,saman,mcarbin}@mit.edu
†Google Research
Abstract—Compilers and performance engineers use hardware performance models to simplify program optimizations. Perfor-mance models provide a necessary abstraction over complex modern processors. However, constructing and maintaining a per-formance model can be onerous, given the numerous microarchi-tectural optimizations employed by modern processors. Despite their complexity and reported inaccuracy (e.g., deviating from native measurement by more than 30%), existing performance models—such as IACA and llvm-mca—have not been system-atically validated, because there is no scalable machine code profiler that can automatically obtain throughput of arbitrary basic blocks while conforming to common modeling assumptions. In this paper, we present a novel profiler that can profile arbitrary memory-accessing basic blocks without any user in-tervention. We used this profiler to build BHive, a benchmark for systematic validation of performance models of x86-64 basic blocks. We used BHive to evaluate four existing performance models: IACA, llvm-mca, Ithemal, and OSACA. We automat-ically cluster basic blocks in the benchmark suite based on their utilization of CPU resources. Using this clustering, our benchmark can give a detailed analysis of a performance model’s strengths and weaknesses on different workloads (e.g., vectorized vs. scalar basic blocks). We additionally demonstrate that our dataset well captures basic properties of two Google applications: Spanner and Dremel.
Index Terms—Cost/performance, Measurement techniques, Modeling techniques, Benchmarking
I. INTRODUCTION
Processor performance models are analytical tools that stat-ically predict program performance without execution. They can simplify compiler optimizations such as auto-vectorization and instruction scheduling, giving compiler writers an abstrac-tion over the machines they are targeting. Performance models can also guide manual optimization by showing potential program bottlenecks.
An inaccurate performance model can misguide optimiza-tions. For instance, Mendis and Amarasinghe [1] show that in automatic vectorization, an inaccurate performance model can cause performance regression—even with an optimal solution relative to the performance model. Pohl et al. [2] show that predictions made by the vectorization cost model of LLVM only weakly correlate with measurements, with a
Pearson correlation coefficient of 0.55. There has been no comprehensive evaluation of existing performance models.
In this work, we focus on validating the prediction of performance models that run on a single basic block. To do so, we collect an extensive dataset of basic blocks— along with reference timings—that represent a wide variety of characteristic workloads: scientific computing, databases, data compression, machine learning, compilers, and graphics. A. Automatically Profiling Basic Blocks
A key technical challenge with collecting a large basic block dataset is that there is no existing approach to profile an arbitrary basic block that has been removed from its program context. Specifically, a basic block is likely to attempt to access memory and crash unless it is run in an appropriately created execution context that includes appropriately allocated memory. Additionally, one also needs to ensure that the basic block’s execution conforms to common modeling invariants that performance models typically assume, such as that all memory accesses hit the L1 cache. However, existing machine code profilers [3, 4] delegate the responsibility of ensuring a basic block’s successful execution to the user and make no attempt to ensure that the block accesses memory without crashing or that its execution conforms to common modeling assumptions. For instance, we modified Agner Fog’s Perfor-mance Test script [3] (a standard benchmarking tool) to be slightly more robust1, and found that it could only profile
16.65% of basic blocks in our dataset without crashing. B. Contributions
In this paper, we present a novel profiler that automatically profiles the throughput—the average number of cycles it takes to execute a basic block in steady-state—of arbitrary basic blocks, and develop a dataset to support performance model
1The script uses several general-purpose registers for bookkeeping and
assume that they are not used by the code that it’s benchmarking. For a fair comparison, we modified the script so it could profile programs that use these registers.
validation. Specifically, we make the following contributions in this paper:
• We present a profiler for arbitrary, memory-accessing
basic blocks. The profiler creates an appropriate execution context for a basic block by mapping virtual pages accessed by it to a single physical page, thus legalizing all memory accesses and preventing cache misses. Our profiler automatically profiles more than 90% of the basic blocks collected in our dataset.
• We present BHive, a benchmark suite of over 300,000
basic blocks collected from applications that cover a wide range of domains such as numerical computation (e.g., OpenBLAS), databases (SQLite), machine learning (Ten-sorFlow), and cryptography (OpenSSL).
• We present an approach for basic block clustering that
leverages Latent Dirichlet Allocation [5] to automat-ically cluster basic blocks into categories that reflect their execution port usage. We show that the clusters we identify generalize to two data-center applications, Google’s Spanner [6] and Dremel [7], demonstrating that our open source data set is representative of unseen data.
• We evaluate four existing performance models—
IACA [8], llvm-mca [9] (which exposes LLVM’s per-formance model used for instruction scheduling), OS-ACA [10], and Ithemal [11]—on three recent Intel mi-croarchitectures: Ivy Bridge, Haswell, and Skylake. Using our execution port usage clustering, we analyze the strengths and weaknesses of the performance models on different categories of basic blocks.
Our dataset provides a new benchmark for evaluat-ing performance models and holds out the promise of a future for performance modeling research that rests on large-scale, quantitative comparisons with other state-of-the-art techniques. Our tool and dataset are open-source at https://www.github.com/ithemal/bhive.
II. BACKGROUND
A. Existing Performance Models
Broadly speaking, there are two types of performance models: microarchitecture simulators that can produce an interpretable execution trace—a timeline detailing when each instruction is issued or retired—in addition to throughput pre-dictions (e.g., IACA [8]); and per-instruction latency/through-put lookup tables (e.g, a spill-cost estimator used by a register allocator).
IACA [8] (Intel Architecture Code Analyzer) is a static analyzer developed by Intel. It has support for Intel microar-chitectures since Nehalem. Given a machine code snippet, IACA estimates the average number of cycles it take to execute the given basic block in an infinite loop. Unlike its alternatives, IACA takes advantage of its knowledge of Intel’s proprietary processor optimization—such as zero-idioms and micro-op fusions—to make better predictions. Intel discontinued IACA in April 2019.
llvm-mca [9] is a similar tool inspired by IACA. Imple-mented as an out-of-order super-scalar microarchitecture simu-lator, it uses parameters (e.g., instruction throughput) supplied by LLVM [12]’s backend scheduling model. The reuse of the scheduling model is an explicit design choice made to expose LLVM’s cost model for testing. Thus the accuracy of llvm-mca has a bearing on that of LLVM’s scheduling model.
OSACA [10] is an open-source alternative to IACA. Similar to llvm-mca, it is implemented as a parametrized out-of-order simulator—in this case, the parameters come from the mea-sured throughput and latency data for individual instructions. Ithemal [11] is a basic block throughput predictor im-plemented as a deep neural network. Unlike other models discussed so far, Ithemal is blackbox: it outputs a single throughput prediction for each input basic block, but does not report an interpretable execution trace.
Production compilers such as LLVM [12] and GCC typi-cally use cost models to guide optimizations. Unlike models such as IACA or llvm-mca, compiler cost models typically model the costs at the instruction level, rather than at the basic block level. These compilers also use multiple cost models. LLVM, for instance, uses at least three cost models: a generic, per-instruction IR (Intermediate Representation) cost model for its target-independent optimizations [13]; one for instruction scheduling (the scheduling model [14] is also used by llvm-mca); and another one for register allocation [15]. GCC employs analogous models [16, 17]. To our knowledge, out of the models discussed so far, the scheduling model of LLVM is the only one exposed by an interface for testing in isolation from its client optimizations.
B. Machine Code Profilers
Several tools enable users to perform low-level microbench-marking and to validate performance models by hand. Agner Fog’s script [3] profiles small code snippets. The script reports the number of cycles taken to execute the code, as well as performance statistics such as the number of cache misses. nanoBench [4] is a profiler similar to Agner Fog’s [3], with two notable improvements. It allows the user to specify which processor-specific performance counters to measure, in addition to the cycle counter. It also supports profiling in kernel-mode, removing potential noise due to context-switches and interrupts.
Unrolling. The basic strategy these tools take to measure
basic block throughput is to unroll a basic block multiple times and divide the latency of the unrolled basic block by the unroll factor.2 Measuring the execution of multiple iterations
serves two purposes: 1) a large iteration count marginalizes the latency of the first few iterations, when the processor is still warming up to its steady-state behavior, and 2) it diminishes the overhead of collecting performance counters. The formula for estimating throughput using this approach is shown in
2We use IACA’s definition of throughput: the average number of cycles
required to execute a basic block at a steady state. Note that this definition is the reciprocal of the textbook definition of throughput.
Equation 1, where n is the unroll factor3 and cycles(b, n) is
the number of cycles taken to execute basic blockb unrolled n times:
throughput(b) ≈ cycles(b, n)
n (1)
Compared to running the basic block inside a loop, unrolling has an advantage in that the measurements are not tainted by the control overhead incurred by looping. However, if the unroll factor is too large, then the execution may encounter a significant number of L1-instruction cache misses that then taint the measured latency.
Abel and Reineke [18] suggest an alternative approach to address these issues. Equation 2 shows the formula they use to derive basic block throughput:
throughput(b) ≈ cycles(b, n) − cycles(b, n
0)
n − n0 (2)
Essentially, instead of using a single large unroll factor, they measure basic blocks with two unroll factors,n and n0. They
then measure the latency of the two unrolled basic blocks, calculate the difference in the measurements, and divide it by the difference of the unroll factors. The resulting number is the throughput of the basic block.
Limitations. Although it is possible to calculate throughput for individual basic blocks, these profilers are in general unsuitable for automatically profiling a large set of arbitrary basic blocks for systematic validation. They require user intervention to profile arbitrary basic blocks. Specifically, users must provide code to allocate memory and initialize memory-addressing registers to prevent crashing from invalid accesses.
III. PROFILINGARBITRARYBASICBLOCKS
Our goal is to profile arbitrary basic blocks—without re-quiring manual intervention—such that the measured through-put corresponds to the definitions and invariants commonly assumed by performance models. The key challenge is en-abling these basic blocks to access arbitrary memory addresses without crashing.
A. Handling Arbitrary Memory Accesses
Most basic blocks access memory. Directly applying exist-ing tools to profile these basic blocks out of their original program context is likely to result in crashes.
Consider the basic block in Figure 1, which Gzip uses to compute a CRC code. Highlighted instructions show the flow of pointer values: essentially, bits of %rdx are used to index into a lookup table, the content of which is then used in the next iteration to update %rdx. This basic block can only execute successfully in an execution context that allocates memory at 0x4110a. Furthermore, since the index (%rax) of the table at 0x4110a is also XOR’d every iteration with the contents of a second array addressed by %rdi, one would also need to coordinate the initialization of the second array with the one at 0x4110a, so that the pointer always points to a valid memory address.
add $1, %rdi mov %edx, %eax shr $8, %rdx xor -1(%rdi), %al movzx %al, %eax
xor 0x4110a(, %rax, 8), %rdx cmp %rcx, %rdi
Fig. 1. The inner loop of updcrc from Gzip. This basic block cannot be directly executed because of its memory accesses.
function monitor numF aults ← 0 mappedP ages ← ∅
while numF aults < maxN umF aults do
pid ← launch(measure(mappedP ages))
ifexitSuccess(pid) then
break end if
memAddr ← interceptSegF ault(pid)
ifisM appableAddr(memAddr) then
mappedP ages.add(getP ageAddr(memAddr)) numF aults ← numF aults + 1
end if end while end function
function measure(pagesT oM ap)
mmapT oP hysP age(pagesT oM ap, ...) initialize
. Wait for preceding instructions to finish serialize
begin ← readP erf ormanceCounters initialize
executeU nrolledBasicBlock . Wait for the basic block to finish serialize
end ← readP erf ormanceCounters analyzeAndReportCounters(begin, end) end function
Fig. 2. Pseudocode of the profiling routines.
Our technique works by mapping all virtual memory pages accessed by a basic block to a single physical page, so that all data resides in the L1 cache. The basic block can then execute without crashing since all of memory accesses are valid virtual addresses. This allows us to execute 97% of basic blocks.
Remapping Virtual Pages. Figure 2 shows the algorithm
we use to remap virtual pages. We first unmap all virtual pages—this forces all subsequent memory accesses to trigger a segfault—except the pages containing the basic block’s in-structions. We then execute an unrolled basic block in a forked process monitored by a parent process using ptrace. Each
access of an unmapped virtual page triggers a segmentation fault, which is intercepted by the monitoring process. The monitor process then instructs the executing process to create the appropriate mapping and to restart execution.
Memory Initialization. We initialize the single physical
page—which is shared by all active virtual pages—to be filled with a moderately sized constant (we used 0x12345600 in our experiments) to accommodate for indirect memory accesses. To see why this is necessary, consider a basic block that first loads a pointerp from memory and then de-references p. If the value of p is too low (e.g., 0) or too high (i.e., bigger than the highest address that a user space program is allowed
to address), we cannot map the virtual page addressed by p.
All general-purpose registers are initialized similarly.
Virtual page aliasing. Under our page mapping scheme,
two virtual addresses differing by a multiple of page size get mapped to the same physical address. Such aliasing can introduce extra memory dependences and cause slowdown. Consider the following code snippet: *p = x; y = *(p + page_size). Whereas in a stan-dard execution context the load can be executed independently from the first store, in this context the load can only be issued after the store finishes, due to page aliasing introduced by our profiler. We remove basic blocks whose execution that could be affected by page aliasing out of our analysis. There are 20,729 (6.28%) such basic blocks. Because there is no hardware counter that tracks accesses serialized due to page aliasing, we trace all addresses accessed during profiling and mark a basic block if, within a conservative window, there are any loads following an aliased store. We note that we can reduce the occurrence of page aliasing by mapping the set of virtual pages to a larger range of physical memory (e.g., two pages instead of one).
B. Overall Profiling Workflow
Our profiler computes the throughput of a basic block by repeatedly measuring the block, filtering measurements that violate modeling invariants, then calculating throughput using the filtered measurements.
Raw Measurement. The profiler first creates an execution
context so the basic block executes without crashing, using the page mapping algorithm in Figure 2. The profiler then measures the unrolled latency using the unrolling heuristics described in Section II-B. It uses 100 and 200 as the unroll factors for basic blocks smaller than 100 bytes; 50 and 100 for basic blocks between 100 bytes and 200 bytes; and finally 16 and 32 for basic blocks larger than 200 bytes.
Filtering. Performance models typically model an idealized execution of the code in which all data resides in L1 cache, and rare performance-degrading events do not occur. We have designed our measurement tool to deliver measurements that are consistent with such an idealized execution.
• L1 Cache Misses. Our measurement tool monitors
in-struction cache and data cache misses with hardware counters and rejects any measurements with a cache miss.
• Unaligned Loads. Unaligned memory accesses can be
slower than aligned accesses. In particular, accesses straddling a cache line boundary can cause an order of magnitude slowdown. Our measurement tool detects (using a hardware counter) unaligned loads and rejects any measurements with a non-zero number of such loads. We removed 553 (0.183%) basic blocks that are affected by unaligned accesses from our dataset.
• Subnormal Floating Point. Floating-point computations
on subnormal numbers can be up to 20x slower than for normal numbers. We configured the MXCSR register to disable gradual underflow. We found 334 (0.1%) basic blocks that would have been affected by gradual underflow if we had not taken this measure.
• Context Switches. We profile all basic blocks with hyper-threading disabled and monitor context switches during execution using a system-call provided by Linux. We reject all measurements with a detected context switch. If the profiler rejects more than 6 of the measurement at-tempts due to violations of its idealized execution model, then it fully rejects the basic block. In addition, if the coefficient of variation—i.e., standard deviation divided by mean—of the measurements is more than 10%, then it also rejects the block because there is residual measurement variance that the measurement methodology is unable to eliminate.
Throughput Calculation. If the block survives filtering,
then the profiler uses the minimum latency of the recorded measurements to calculate throughput according Equation 2.
Environment Variance. It is possible for the profiler to
encounter random but consistent noise that pollutes our latency measurements. E.g., a basic block (say unrolled 100 times) with a latency of 500 cycles would yield a measured latency of around 700 cycles consistently for 16 consecutive runs. Such noise occurs about 6% of the time. To overcome this, we profile the throughput of a basic block at least five times (i.e., each basic block is measured at least5 × 16 times), and the minimum of the five is the throughput we report. C. Portability to Other Architectures
We briefly discuss how to port our profiling technique to other architectures. Our profiler requires being able to map multiple virtual pages to a few physical pages, detecting cache misses, and detecting or disabling floating-point underflow. To our knowledge, recent implementations of x86-64 (AMD and Intel) and ARM satisfy these requirements.
Page Mapping. We require the ability to map multiple virtual pages to a few physical pages without incurring a performance penalty due to unnecessary cache invalidation (i.e., when two aliased virtual addresses are mapped to different cache entries, the cache evicts one entry to ensure coherence). We therefore require that the target processor has a physically tagged data
TABLE I
Source applications of BHive’s basic blocks. Note that the basic blocks collected from each application are not necessarily unique. For instance,
most applications use the same libc implementation.
Application Domain # Basic Blocks
OpenBLAS Scientific Computing 19032
Redis Database 9343
SQLite Database 8871
GZip Compression 2272
TensorFlow Machine Learning 71988
Clang/LLVM Compiler 212758
Eigen Scientific Computing 4545
Embree Ray Tracing 12602
FFmpeg Multimedia 17150
Total 330018
cache. If the cache is virtually indexed, we additionally require that the page size is small enough so the indexing bits are not affected by address translation. These two conditions are sufficient to establish that any two aliased virtual addresses are always mapped to the same cache entry.
IV. BASICBLOCKDATASET
Table I shows the applications from which we extracted basic blocks for BHive. We selected these applications with the following goals. First, the set of applications should cover a diverse range of domains to represent real-world workloads. Second, their basic blocks should reflect usage that concerns typical users of a performance model; compiler developers deal with basic blocks from general-purpose programs, which have different characteristics than those from, e.g., high-performance kernels.
We selected Clang/LLVM [12] (compiler), Redis (in-memory database), SQLite (database), and Gzip (compression) to collect basic blocks representative of applications that are written in general purpose languages like C and C++. These are some of the most used applications today and they all use sophisticated algorithms and data structures, yielding a large source of diverse basic blocks.
Next, we chose the following applications that use hand-optimized high performance kernels: OpenSSL [19] (cryptog-raphy), OpenBLAS [20], Eigen [21] (scientific computing), TensorFlow [22] (machine learning), Embree [23] (rendering), and FFmpeg (multimedia). OpenSSL, OpenBLAS, and FFm-peg use handwritten assembly for performance-critical inner loops. Embree is written in ispc [24], a data-parallel language designed specifically to target Intel’s vector extensions.
We compiled all applications with the highest optimization settings defined by their build systems. Applications that use handwritten assembly (e.g., OpenBLAS) allow users to configure their builds to target specific ISA-extensions, and we configured these applications to target machines with AVX2.
We extracted basic blocks from these applications using a dynamic analysis implemented in DynamoRIO [25], which allows us to record every basic block executed at runtime. We used a dynamic analysis rather than static disassembly because
we discovered in our experiments cases of static disassemblers unable to distinguish padding bytes from instructions. To simu-late realistic execution when recording the basic blocks, we use the official benchmarking input of these applications, with the exception of FFmpeg and Gzip, which to our knowledge do not have official benchmarks.4 We evaluated Eigen on two sparse
linear algebra workloads: sparse matrix-matrix multiplication (SpMM) and sparse matrix-vector multiplication (SpMV).
V. BASICBLOCKCLUSTERING
Some basic blocks are harder to model than others. For instance, our results in Section VI-B demonstrate that basic blocks with a memory dependence have higher prediction errors than blocks without for all performance models in our evaluation. We therefore present a technique that clusters basic blocks based on their use of processor resources. The tech-nique enables performance model designers and users to have a finer-grained understanding of the behavior of the performance model, enabling them to focus their development resources on whole categories of blocks that pose challenges. For example, a data-driven performance model such as Ithemal [11] could be steered to oversample categories of basic blocks that it poorly models.
A. Methodology
The approach we took to cluster basic blocks is as follows: 1) we map each basic block to a representation that reflects its use of hardware resources; we then 2) cluster the basic blocks based on this representation.
We compute a port-combination mapping for each instruc-tion, using results from Abel and Reineke [18]. For instance, the port-combination mapping for xor %rax, %rbx in Haswell is {p0156 → 1} (using Abel and Reineke’s notation): in other words, this instruction is implemented with a single micro-op that can be executed at any of ports 0, 1, 5, or 6. In Haswell, there are 13 unique port combinations for all user-level instructions.
After translating each basic block to its port-mapping rep-resentation, we used Latent Dirichlet Allocation (LDA) [5] to build a topic model. A topic model in language processing assigns a topic to each word based on the word’s frequency in a set of documents. In our context, words are micro-operations differentiated based on their port combinations, topics are categories, and documents are basic blocks. We therefore assign a category to each micro-operation based on its port-combination frequency in a set of basic blocks. To infer the category for each micro-op, we used SciKit Learn’s default implementation of stochastic variational inference for LDA [5], with six categories and the parameter valuesα = 1/6
andβ = 1/13. We then computed the most common category
for each basic block, taking this to be the category of the basic block itself.
TABLE II
Description of basic block categories. Categories were discovered by LDA, and category names are decided by manual inspection.
Category Description # Basic Blocks
Scalar Scalar ALU operations 85208
Vec Purely vector instructions 1267
Scalar/Vec Scalar and vector arithmetic 7710
Ld Mostly loads 121412
St Mostly stores 55879
Ld/St Mix of loads and stores 58540
B. Results
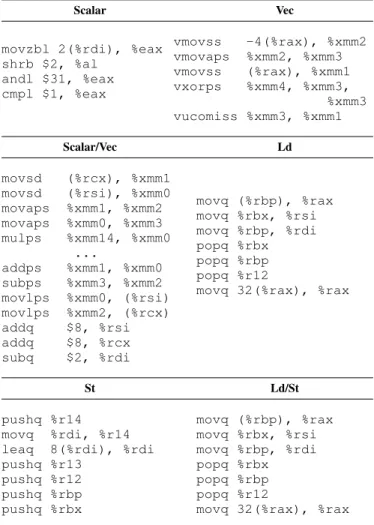
Table II presents the number of unique basic blocks in each category discovered by our technique. Note that LDA does not give names or descriptions to the categories; we manually named the categories and developed their descriptions after inspecting their constituent basic blocks. Table III shows an example basic block for each category.
Figure 3 shows the unique basic block category patterns for each application; we weigh each basic block by its runtime fre-quency (which is determined by a sample-based profiler [26]). As expected, applications with high-performance numerical kernels such as TensorFlow and OpenBLAS are composed primarily of vectorized basic blocks. The majority of SQLite and LLVM’s basic blocks are not vectorized. OpenSSL and Gzip have many bit-manipulation basic blocks, consistent with our analysis.
C. Case Study on Data-Center Applications
We next demonstrate that our clustering generalizes to unseen basic blocks, providing similar explanatory power for two data-center applications that are not within our dataset: Google’s Spanner [6] and Dremel [7]. The key observation is that if our clusters generalize to these new applications, then our dataset captures properties of unseen workloads.
Methodology. Spanner is a highly available, globally
dis-tributed database, designed to scale up to millions of machines and trillions of database rows [6]. Dremel is a scalable, interactive ad-hoc query system for analysis of read-only data, capable of running aggregation queries over trillion-row tables in seconds [7].
To evaluate our clustering’s ability to generalize to unseen basic blocks, we use the following experiment. First, we assigned each basic block in Spanner and Dremel to the most appropriate cluster from our benchmark suite of open source applications (Section V). We performed this assignment using Blei et al. [5]’s unseen data classification technique as implemented in Scikit Learn’s transform method. Second, we created a new set of clusters from the combination of our open source applications and Spanner and Dremel. Finally, we compared the perplexity [5] of each clustering on the Spanner and Dremel basic blocks. Perplexity is a measurement of how successfully LDA can discriminate between different data points in a data set, with lower being more successful.
Therefore, our experimental hypothesis is that if the perplexity of our open source data clustering is the same as that of our combined data clustering, then our open source clustering generalizes because the Spanner and Dremel basic blocks are well captured by the clusters in our open source applications.
TABLE III
Example basic blocks for each category identified in Table II
Scalar Vec
movzbl 2(%rdi), %eax shrb $2, %al andl $31, %eax cmpl $1, %eax vmovss -4(%rax), %xmm2 vmovaps %xmm2, %xmm3 vmovss (%rax), %xmm1 vxorps %xmm4, %xmm3, %xmm3 vucomiss %xmm3, %xmm1 Scalar/Vec Ld movsd (%rcx), %xmm1 movsd (%rsi), %xmm0 movaps %xmm1, %xmm2 movaps %xmm0, %xmm3 mulps %xmm14, %xmm0 ... addps %xmm1, %xmm0 subps %xmm3, %xmm2 movlps %xmm0, (%rsi) movlps %xmm2, (%rcx) addq $8, %rsi addq $8, %rcx subq $2, %rdi movq (%rbp), %rax movq %rbx, %rsi movq %rbp, %rdi popq %rbx popq %rbp popq %r12
movq 32(%rax), %rax
St Ld/St
pushq %r14
movq %rdi, %r14
leaq 8(%rdi), %rdi
pushq %r13 pushq %r12 pushq %rbp pushq %rbx movq (%rbp), %rax movq %rbx, %rsi movq %rbp, %rdi popq %rbx popq %rbp popq %r12
movq 32(%rax), %rax
Results. We found that, when trained just on the open source data, our clustering achieved a perplexity of 5.23, versus a perplexity of 5.26 for the clustering additionally trained with the Google data. This small increase of 0.5% shows that the perplexity of the clusterings are nearly the same, and that the basic blocks in the open-source data are diverse enough to cover previously unseen applications.
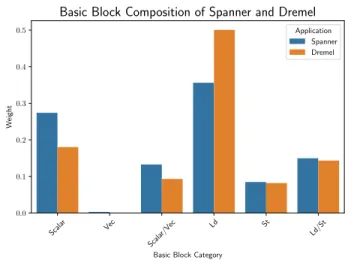
Figure 4 shows Spanner’s and Dremel’s basic block cate-gories inferred by the clustering from our benchmark dataset (Section V). The two applications spend almost half of the time executing load instructions—40% and 50% respectively. Compared to similar applications from our data set, Spanner and Dremel spend significantly more time—12% and 9%, respectively—executing vectorized basic blocks, compared to 5.0% and 0.2% for SQLite and Redis respectively.
0.0 0.2 0.4 0.6 0.8 Weight
OpenBLAS
SQLite
GZip
TensorFlow
Clang/LLVM
Scalar Vec Scalar/Vec
Ld St
Ld/St Basic Block Category 0.0 0.2 0.4 0.6 0.8 Weight
Eigen
Scalar Vec Scalar/Vec Ld St Ld/St Basic Block CategoryFFmpeg
Scalar Vec Scalar/Vec
Ld St
Ld/St Basic Block Category
Embree
Scalar Vec Scalar/Vec
Ld St
Ld/St Basic Block Category
OpenSSL
Scalar Vec Scalar/Vec
Ld St
Ld/St Basic Block Category
Redis
Fig. 3. Breakdown of applications by basic block categories. The Y-axis is the total runtime frequency of the basic blocks in a given category (specified on the X-axis). We define the category of a basic block as the most common category of micro-ops contained in the block.
Scala r
Vec Scala
r/Vec Ld St Ld/St Basic Block Category
0.0 0.1 0.2 0.3 0.4 0.5 W eight
Basic Block Composition of Spanner and Dremel
Application Spanner Dremel
Fig. 4. Basic block composition of Spanner and Dremel. Each basic block is weighted by its execution frequency.
VI. PERFORMANCEMODELEVALUATION
We evaluate four existing basic block-level performance models on three recent Intel microarchitectures: Ivy Bridge, Haswell, and Skylake.
A. Methodology
We evaluated IACA [8], llvm-mca [9], Ithemal [11], and OSACA [10]. In Section II-A, we present a more detailed discussion regarding their design and usage. For Skylake and Haswell, we used IACA 3.0; and for Ivy Bridge we used IACA 2.0 because IACA discontinued its support for Ivy Bridge after version 2.0. For llvm-mca, we used version 8.0.1. OSACA is currently under development, and we took the latest version at the time of writing this paper. For Ithemal5, we used commit
5https://github.com/ithemal/Ithemal
cb5fd79f6 from the master branch and retrained its model using the dataset described in [11], but timed with our profiler. We note that only 22% of the basic blocks in our dataset appear in Ithemal’s dataset. Therefore our dataset is a valid test because it has limited exposure to the risk that Ithemal overfits on its own dataset.
Dataset. We evaluated the performance models using the
basic block dataset discussed in Section IV. Some basic blocks in our dataset contain AVX2 instructions, which are not implemented in Ivy Bridge. These basic blocks are not included in the Ivy Bridge evaluation.
Platforms. For the Ivy Bridge measurements, we used a
server with the Intel(R) Xeon(R) CPU E5-2695 v2 CPU and 128 GB of memory. For the Haswell measurements, we used a server with the Intel(R) Xeon(R) CPU E5-2680 v3 CPU and 128 GB of memory. Finally, for the Skylake measurements, we used a server with the Intel(R) Xeon(R) W-2123 CPU and 64 GB of memory.
Evaluation Metrics. Given a measured throughputt and a
predicted throughput t0, we define error in this paper as the
relative error: err(t, t0) =
t−t0 t
. We report the prediction errors of the performance models in three different ways.
• Overall error: We report the average error of all basic
blocks in our dataset on a given microarchitecture.
• Per-application error: We report the average error of all basic blocks in a given application on a given microar-chitecture.
• Per-category error: We cluster the basic blocks in our
dataset into different categories (Section V) and report the average error of all basic blocks in a given category on a given microarchitecture.
We additionally evaluated how each model preserves the ordering of basic block throughput, using Kendall’s tau coeffi-cient [27], which measures the fraction of preserved pairwise ordering. Kendall’s tau coefficient can be more useful than relative error, when the consumers of a performance model are not so much concerned with the precise predictions but the relative ordering of predictions—such as compiler opti-mizations that needs to select the best of candidate programs. B. Results
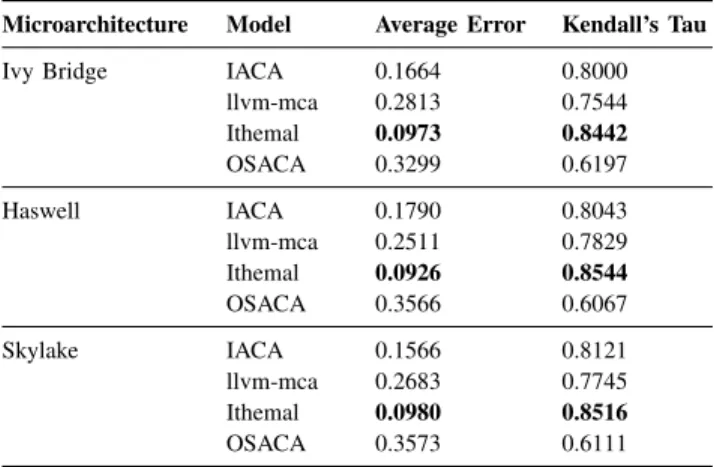
Table IV shows the overall error and Kendall’s tau coeffi-cients for each model on different microarchitectures. Figures 5, 7, and 9 show the breakdown of the errors by application. Figure 6, 8, and 10 show the breakdown of the errors by cate-gory. The discrepancy between overall prediction error (Table IV) and that of more specialized types of basic blocks such as vectorized code (Figures 6, 8, and 10) highlights the need of basic block clustering and per-category error reporting.
TABLE IV
Overall error of evaluated models. Kendall’s tau coefficient [27] measures the fraction of pairwise throughput ordering preserved by a given model.
The bolded entry of each cell shows the best model.
Microarchitecture Model Average Error Kendall’s Tau
Ivy Bridge IACA 0.1664 0.8000
llvm-mca 0.2813 0.7544 Ithemal 0.0973 0.8442 OSACA 0.3299 0.6197 Haswell IACA 0.1790 0.8043 llvm-mca 0.2511 0.7829 Ithemal 0.0926 0.8544 OSACA 0.3566 0.6067 Skylake IACA 0.1566 0.8121 llvm-mca 0.2683 0.7745 Ithemal 0.0980 0.8516 OSACA 0.3573 0.6111
IACA is the second most accurate model for most cate-gories. It is the best model at modeling purely vectorized basic blocks. In its weakest categories—Scalar/Vec and Ld/St—it is no worse than the most accurate model by more than 10%.
llvm-mca is considerably worse on all microarchitectures compared to IACA and Ithemal, especially on modeling basic blocks involving loads.
Ithemal [11] consistently outperforms other models, except on vectorized basic blocks. Ithemal is also considerably better than other models at modeling basic blocks with memory de-pendence (Ld/St). The inconsistency between Ithemal’s overall error and the error on vectorized basic blocks seems to be a result of an imbalance in its training dataset, the majority of which consists of non-vectorized basic blocks.
OSACA [10] is, on average, more accurate than llvm-mca but considerably less than IACA [8] and Ithemal [11]. We note that this has less to do with OSACA’s methodology than the fact that its instruction parser is under active development. During our evaluations, we found and reported five bugs
in OSACA’s instruction parser. In particular, OSACA does not recognize several instruction forms; depending on the cases, it either crashes or treats unrecognized instruction forms as nops. One such instruction form is any instruction that reads an immediate operand and writes to memory (e.g., add $1, (%rbx)). OSACA treats these instructions as nops, thus underreporting the throughput of many basic blocks. C. Examples of Modeling Bugs
We present a case study of three basic blocks where some of the evaluated models behave poorly. These examples show-case the microarchitectural complexity that these performance models face. Table V shows these basic blocks, their measured throughput (Haswell), and the throughput predicted by dif-ferent models (Haswell). We manually inspected IACA’s and llvm-mca’s predicted instruction schedules; OSACA and Ithe-mal do not predict execution schedules. The first two examples highlight cases in which a model’s prediction contradicts the instruction throughput specified by the manual. The last ex-ample shows a case where a model (llvm-mca [9] in this case) can significantly mispredict throughput due to mis-scheduling micro-ops, despite correct modeling of individual instructions. Modeling bug due to unsigned division. The first example in Table V is bottlenecked by a 64-bit by 32-bit unsigned division. The throughput is bounded by the latency of the di-vision (since it reads from and writes to %rax each iteration). Intel’s manual [28] states that the latency of such a division ranges from 20 to 26 cycles, which is consistent with our measurement (21.62 cycles).
All models are wrong here. llvm-mca and IACA [8] sig-nificantly over-predict; Ithemal [11] and OSACA [10] under-predict—it appears that they ignore the data-dependence.
One can infer from llvm-mca’s and IACA’s predictions— 98 and 99 cycles—that they mistake this 64-by-32 division
(latency ≈ 12 cycles) with the 128-by-64 analog (latency
≈ 90 cycles). Their predictions would, however, still be wrong due to the preceding xorl %edx, %edx, which zeros %edx and enables a fastpath for the subsequent division (latency ≈30 cycles).
Modeling bug due to zero-idioms. The basic block in the
second example in Table V is a single vectorized XOR of %xmm2 with itself. At the end of executing this instruction, the value of %xmm2 is always 0. All three microarchitectures have fast-paths for such zero-idioms. IACA and Ithemal rec-ognize this idiom and make predictions close to the measured throughput, while llvm-mca and OSACA treat this instruction as a regular vectorized XOR.
Modeling bug due to mis-scheduling. The third example in Table V is a basic block whose instructions form a non-trivial dependence-chain. On the surface, every instruction depends on the previous one, but there is still some instruction-level parallelism because the memory addressed by %rcx in the third instruction does not depend on the rest of the computation (in fact, it is constant).
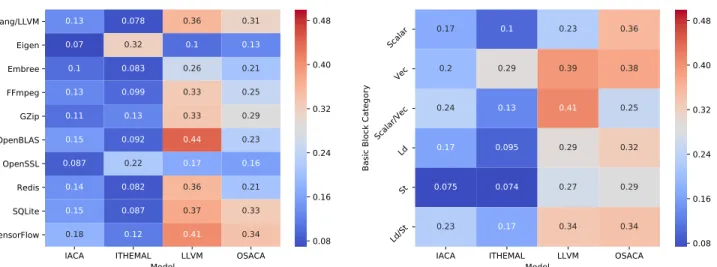
IACA ITHEMAL LLVM OSACA Model Clang/LLVM Eigen Embree FFmpeg GZip OpenBLAS OpenSSL Redis SQLite TensorFlow Application 0.13 0.078 0.36 0.31 0.07 0.32 0.1 0.13 0.1 0.083 0.26 0.21 0.13 0.099 0.33 0.25 0.11 0.13 0.33 0.29 0.15 0.092 0.44 0.23 0.087 0.22 0.17 0.16 0.14 0.082 0.36 0.21 0.15 0.087 0.37 0.33 0.18 0.12 0.41 0.34 0.08 0.16 0.24 0.32 0.40 0.48
Fig. 5. Per-application error for each model on Ivy Bridge
IACA ITHEMAL LLVM OSACA
Model Scalar Vec Scalar/Vec Ld St Ld/St
Basic Block Category
0.17 0.1 0.23 0.36 0.2 0.29 0.39 0.38 0.24 0.13 0.41 0.25 0.17 0.095 0.29 0.32 0.075 0.074 0.27 0.29 0.23 0.17 0.34 0.34 0.08 0.16 0.24 0.32 0.40 0.48
Fig. 6. Per-category error for each model on Ivy Bridge
IACA ITHEMAL LLVM OSACA
Model Clang/LLVM Eigen Embree FFmpeg GZip OpenBLAS OpenSSL Redis SQLite TensorFlow Application 0.16 0.068 0.34 0.34 0.14 0.27 0.12 0.37 0.16 0.11 0.26 0.3 0.16 0.088 0.33 0.31 0.13 0.13 0.32 0.37 0.19 0.093 0.43 0.28 0.11 0.18 0.19 0.28 0.19 0.078 0.36 0.26 0.17 0.077 0.37 0.35 0.18 0.11 0.42 0.35 0.08 0.16 0.24 0.32 0.40 0.48
Fig. 7. Per-application error for each model on Haswell
IACA ITHEMAL LLVM OSACA
Model Scalar Vec Scalar/Vec Ld St Ld/St
Basic Block Category
0.21 0.092 0.18 0.45 0.22 0.27 0.42 0.41 0.25 0.11 0.54 0.27 0.14 0.089 0.27 0.33 0.12 0.055 0.26 0.29 0.27 0.13 0.27 0.35 0.08 0.16 0.24 0.32 0.40 0.48
Fig. 8. Per-category error for each model on Haswell
IACA ITHEMAL LLVM OSACA
Model Clang/LLVM Eigen Embree FFmpeg GZip OpenBLAS OpenSSL Redis SQLite TensorFlow Application 0.14 0.09 0.37 0.35 0.12 0.1 0.13 0.19 0.15 0.11 0.27 0.3 0.15 0.11 0.35 0.32 0.12 0.15 0.35 0.37 0.18 0.1 0.46 0.29 0.083 0.12 0.2 0.2 0.18 0.097 0.39 0.26 0.16 0.097 0.4 0.37 0.18 0.13 0.43 0.38 0.16 0.24 0.32 0.40 0.48
Fig. 9. Per-application error for each model on Skylake
IACA ITHEMAL LLVM OSACA
Model Scalar Vec Scalar/Vec Ld St Ld/St
Basic Block Category
0.19 0.11 0.21 0.45 0.17 0.3 0.37 0.47 0.23 0.13 0.45 0.32 0.11 0.093 0.29 0.32 0.11 0.052 0.26 0.3 0.24 0.13 0.3 0.35 0.08 0.16 0.24 0.32 0.40 0.48
IACA is the most accurate model. Ithemal’s and OS-ACA’s predictions—1 cycle per iteration—reveal that they ignored the dependence altogether. Figure 11 shows the schedules predicted by llvm-mca and IACA. The instruction
xorq (%rcx), %rax is dispatched noticeably earlier in
IACA’s schedule. llvm-mca delays dispatching xorq due to its dependence on the previous computation, not recognizing that that the micro-op of xorq (%rcx), %rax that loads
%rcx is independent and should be dispatched earlier.
TABLE V
Basic blocks and their predicted throughputs, demonstrating modeling bugs.
Basic Block Model Throughput
xorl %edx, %edx
divl %ecx
testl %edx, %edx
IACA 98.00 llvm-mca 99.04 Ithemal 16.28 OSACA 12.25 Measured 21.62 vxorps %xmm2, %xmm2, %xmm2 IACA 0.24 llvm-mca 1.00 Ithemal 0.27 OSACA 1.00 Measured 0.25 xorq 1000000(%rax), %rbx movq %rbx, %rax xorq (%rcx), %rax IACA 7.83 llvm-mca 12.03 Ithemal 1.01 OSACA 1.00 Measured 7.23 A---sdeeeew----R---p A---sdw----R---p A---w---R---p s---cdeeeew---R---p A---sdw----R---p A---sdeeeew----R---p D================================eeeeeeER D=====================================eER D=====================================eeeeeeER D==========================================eeeeeeER xorq 1000000(%rax), %rbx TYPE_LOAD (1 uops) TYPE_OP (1 uops) movq %rbx, %rax TYPE_OP (0 uops) xorq (%rcx), %rax TYPE_LOAD (1 uops) TYPE_OP (1 uops) xorq 1000000(%rax), %rbx TYPE_LOAD (1 uops) llvm-mca IACA xorq 1000000(%rax), %rbx movq %rbx, %rax xorq (%rcx), %rax xorq 1000000(%rax), %rbx
Fig. 11. Schedules predicted by llvm-mca and IACA for an example basic block. Each red window marks the boundary of a single iteration of execution. The width of the windows represents the steady-state throughput. As illustrated here, llvm-mca and IACA predicts two different schedules. Notice that the bolded instruction is dispatched earlier in IACA’s schedule.
VII. CONCLUSION
We present a benchmark for validating performance models of x86-64 basic blocks. We describe the techniques with which we collected and profiled over 300,000 basic blocks from real-world applications. Our benchmark can be used to evaluate and tune performance models of x86-64 basic blocks systematically. We evaluated four throughput prediction models, including two recently published research models. Our evaluation shows that even the best models we evaluated can differ from the ground truth by more than 20%, and sometimes
more, for certain classes of basic blocks; in particular, we show that existing throughput predictors have difficulty modeling memory dependency and vectorized basic blocks reliably.
VIII. ACKNOWLEDGEMENTS
We thank Stephen Chou and all reviewers for their insightful comments. This work was supported by a Google Faculty Research Award and the Applications Driving Architectures (ADA) Research Center, a JUMP Center co-sponsored by SRC (Semiconductor Research Corporation) and DARPA.
APPENDIXA
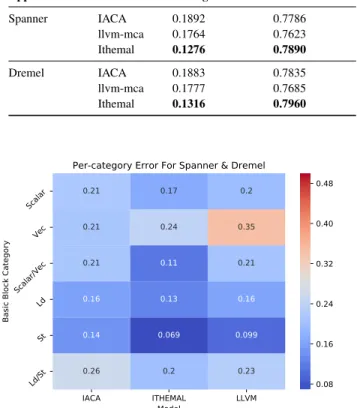
MODELPREDICTIONERRORS ONSPANNER ANDDREMEL
Table VI shows the accuracy of IACA, llvm-mca, and Ithemal’s prediction errors on these basic blocks. Figure 12 shows the per-category error analysis. We gather the validation measurements on a Haswell machine. IACA’s predictions are similar to those on our dataset. Ithemal’s predictions on the two applications’ vectorized basic blocks are 3% better than on our dataset, but its predictions on basic blocks in the Scalar and Ld/St categories are 7% worse. llvm-mca, which has an average prediction error of 25% on our benchmark, predicts noticeably better; we note that llvm-mca still lags behind the other models on vectorized basic blocks.
TABLE VI
Accuracy of models on basic blocks from Spanner and Dremel. Bolded entries show the best models.
Application Model Average Error Kendall’s Tau
Spanner IACA 0.1892 0.7786 llvm-mca 0.1764 0.7623 Ithemal 0.1276 0.7890 Dremel IACA 0.1883 0.7835 llvm-mca 0.1777 0.7685 Ithemal 0.1316 0.7960 IACA ITHEMAL LLVM Model Scalar Vec Scalar/Vec Ld St Ld/St
Basic Block Category
0.21 0.17 0.2 0.21 0.24 0.35 0.21 0.11 0.21 0.16 0.13 0.16 0.14 0.069 0.099 0.26 0.2 0.23
Per-category Error For Spanner & Dremel
0.08 0.16 0.24 0.32 0.40 0.48
Fig. 12. Per-category prediction error (vs. Haswell measurements) on Spanner and Dremel’s basic blocks.
REFERENCES
[1] C. Mendis and S. Amarasinghe, “goslp: globally opti-mized superword level parallelism framework,” in Pro-ceedings of the ACM on Programming Languages, 2018. [2] A. Pohl, B. Cosenza, and B. Juurlink, “Portable cost modeling for auto-vectorizers,” in IEEE International Symposium on the Modeling, Analysis, and Simulation of Computer and Telecommunication Systems, 2019. [3] “Software optimization resources,” https://www.agner.
org/optimize/, 2019.
[4] A. Abel and A. Wharton, “A tool for running small microbenchmarks on recent intel and amd x86 cpus.” https://github.com/andreas-abel/nanoBench, 2019. [5] D. M. Blei, A. Y. Ng, and M. I. Jordan, “Latent dirichlet
allocation,” Journal of machine Learning research, vol. 3, no. Jan, pp. 993–1022, 2003.
[6] J. C. Corbett, J. Dean, M. Epstein, A. Fikes, C. Frost, J. Furman, S. Ghemawat, A. Gubarev, C. Heiser, P. Hochschild, W. Hsieh, S. Kanthak, E. Kogan, H. Li, A. Lloyd, S. Melnik, D. Mwaura, D. Nagle, S. Quin-lan, R. Rao, L. Rolig, D. Woodford, Y. Saito, C. Tay-lor, M. Szymaniak, and R. Wang, “Spanner: Google’s globally-distributed database,” in USENIX Conference on Operating Systems Design and Implementation, 2012. [7] S. Melnik, A. Gubarev, J. J. Long, G. Romer, S.
Shivaku-mar, M. Tolton, and T. Vassilakis, “Dremel: Interactive analysis of web-scale datasets,” in International Confer-ence on Very Large Data Bases, 2010.
[8] “Intel architecture code analyzer,” https://software.
intel.com/en-us/articles/intel-architecture-code-analyzer, 2017.
[9] “llvm-mca - llvm machine code analyzer,” https://llvm. org/docs/CommandGuide/llvm-mca.html.
[10] J. Laukemann, J. Hammer, J. Hofmann, G. Hager, and G. Wellein, “Automated instruction stream throughput prediction for intel and amd microarchitectures,” in IEEE/ACM Performance Modeling, Benchmarking and Simulation of High Performance Computer Systems, 2018.
[11] C. Mendis, A. Renda, D. Amarasinghe, and M. Carbin, “Ithemal: Accurate, portable and fast basic block throughput estimation using deep neural networks,” in International Conference on Machine Learning, 2019. [12] C. Lattner and V. Adve, “Llvm: A compilation
frame-work for lifelong program analysis & transformation,” in International Symposium on Code Generation and [16] “18.16 describing relative costs of operations,” https://
Optimization, 2004.
[13] “llvm::TargetTransformInfo Class Reference,” https:
//llvm.org/doxygen/classllvm 1 1TargetTransformInfo. html.
[14] “llvm::targetschedmodel class reference,” http://llvm.org/ doxygen/classllvm 1 1targetschedmodel.html.
[15] “llvm::TargetRegisterInfo Class Reference,” https://llvm. org/doxygen/classllvm 1 1TargetRegisterInfo.html. gcc.gnu.org/onlinedocs/gccint/Costs.html.
[17] “18.17 adjusting the instruction scheduler,” https://gcc. gnu.org/onlinedocs/gccint/Scheduling.html.
[18] A. Abel and J. Reineke, “uops.info: Characterizing la-tency, throughput, and port usage of instructions on intel microarchitectures,” in ASPLOS, 2019.
[19] “Openssl, cryptography and ssl/tls toolkit,” https://www. openssl.org/.
[20] “Openblas, an optimized blas library,” https://www. openblas.net/.
[21] “Eigen,” http://eigen.tuxfamily.org/index.php?title=
Main Page.
[22] M. Abadi, P. Barham, J. Chen, Z. Chen, A. Davis, J. Dean, M. Devin, S. Ghemawat, G. Irving, M. Isard, M. Kudlur, J. Levenberg, R. Monga, S. Moore, D. G. Murray, B. Steiner, P. Tucker, V. Vasudevan, P. Warden, M. Wicke, Y. Yu, and X. Zheng, “Tensorflow: A system for large-scale machine learning,” in USENIX Conference on Operating Systems Design and Implementation, 2016. [23] I. Wald, S. Woop, C. Benthin, G. S. Johnson, and M. Ernst, “Embree: A kernel framework for efficient cpu ray tracing,” ACM Transactions on Graphics, 2014. [24] M. Pharr and W. R. Mark, “ispc: A spmd compiler
for high-performance cpu programming,” in Innovative Parallel Computing, 2012.
[25] D. Bruening, T. Garnett, and S. Amarasinghe, “An infras-tructure for adaptive dynamic optimization,” in Interna-tional Symposium on Code Generation and Optimization, 2003.
[26] J. Whaley, “A portable sampling-based profiler for java virtual machines,” in ACM Conference on Java Grande, 2000.
[27] M. G. Kendall, “A new measure of rank correlation,” Biometrika, vol. 30, no. 1/2, pp. 81–93, 1938.
[28] “Intel 64 and ia-32 architectures
optimiza-tion reference manual,” https://software.
intel.com/sites/default/files/managed/9e/bc/ 64-ia-32-architectures-optimization-manual.pdf.