Publisher’s version / Version de l'éditeur:
Vous avez des questions? Nous pouvons vous aider. Pour communiquer directement avec un auteur, consultez la première page de la revue dans laquelle son article a été publié afin de trouver ses coordonnées. Si vous n’arrivez pas à les repérer, communiquez avec nous à [email protected].
Questions? Contact the NRC Publications Archive team at
[email protected]. If you wish to email the authors directly, please see the first page of the publication for their contact information.
https://publications-cnrc.canada.ca/fra/droits
L’accès à ce site Web et l’utilisation de son contenu sont assujettis aux conditions présentées dans le site LISEZ CES CONDITIONS ATTENTIVEMENT AVANT D’UTILISER CE SITE WEB.
Inter-Noise 2011, 2011-09-07
READ THESE TERMS AND CONDITIONS CAREFULLY BEFORE USING THIS WEBSITE.
https://nrc-publications.canada.ca/eng/copyright
NRC Publications Archive Record / Notice des Archives des publications du CNRC : https://nrc-publications.canada.ca/eng/view/object/?id=dfd53bb4-ecad-4d85-9640-1873ff10353b https://publications-cnrc.canada.ca/fra/voir/objet/?id=dfd53bb4-ecad-4d85-9640-1873ff10353b
NRC Publications Archive
Archives des publications du CNRC
This publication could be one of several versions: author’s original, accepted manuscript or the publisher’s version. / La version de cette publication peut être l’une des suivantes : la version prépublication de l’auteur, la version acceptée du manuscrit ou la version de l’éditeur.
Access and use of this website and the material on it are subject to the Terms and Conditions set forth at
Wood or concrete floor? A comparison of direct sound insulation
Wood or concrete floor? – A comparison of direct sound insulation
Berndt Zeitler1, Ivan Sabourin2, and Stefan Schoenwald3
1
National Research Council Canada
1200 Montreal Road, Ottawa, ON, K1A 0R6, Canada
ABSTRACT
In the process of designing buildings, architects have to consider many aspects from different disciplines in order to choose the most appropriate materials and design details. Regarding only sound insulation, a 320 mm deep wood framed floor performs better for most sound insulation ratings than an eight times heavier 150 mm thick concrete floor, especially if a heavy topping on a resilient layer is added on both. This paper presents the results of a small study comparing the direct sound insulation of a wood frame and a concrete base floor (both bare and with a heavy topping), measured with four standardized sources (Airborne Sound and Tapping Machine according to ISO 10140 Parts 2 & 3 respectively, and Ball and Tire both according JIS 1418-2 and KS F 2810-2). As mentioned above, this study shows that with a topping the wood floor performs better than the concrete floor over all standard frequency ranges. It was also found that the improvement of sound insulation due to a topping is very similar for all sources except for the Tire or “Bang Machine”, which is an outlier probably due to its extremely forceful impact.
Keywords: Building acoustics, wood frame construction, sound transmission, heavy impact source.
1. INTRODUCTION
The overall goal of this NRC-IRC study is to understand the mechanism of direct and flanking sound transmission in lightweight wood framed construction well enough to be able to predict and reduce overall transmission. This study focuses on the change to direct sound transmission by adding a heavy cementitious topping on a resilient interlayer to a wood joist floor. Further knowledge and a better understanding of sound transmission mechanisms is expected to be gained by comparing the effect of adding the same topping to a different bare assembly, a concrete slab, and by using several different excitation sources. In this paper the measurement setup is described, results are presented and finally conclusions are drawn.
2. MEASUREMENT SETUP
This section describes the sound transmission facility, the applied standard and non-standard building acoustical measurement methods, as well as the specimens under test.
2.1 Facility
The NRC Floor Sound Transmission Facility consists of two vertically adjacent rooms with volumes of about 175 m3. To decrease measurement uncertainty, the microphones used to sample the sound pressure are positioned with robots. A detailed description of the facility is given elsewhere [1]. 2.2 Standard sources
Four standard sources were used for the sound insulation measurements: Airborne according to ISO 10140-2 and three impact sources shown in Figure 1. The transient signals of the heavy impact sources (Ball and Tire) are measured as maximum fast weighted levels LiFmax.
1
2
Figure 1 – Standard impact sources. From left to right: Bang Machine (Tire), Ball, ISO Tapping Machine (Hammer). Detailed descriptions of sources can be found in the following standards: Tapping
Machine: ISO 10140-3, JIS A 1418-1, KS F 2810-1; heavy impactors: ISO 10140-3 (Ball), JIS A 1418-2, KS F 2810-2.
2.3 Non-standard measurements
The drive point impedance of the floors was measured as input data for a simple model [2] of power injected into the floor using an electro-magnetic shaker with integrated impedance head. Threaded metal tabs were glued to the floor surface in order to mount the shaker.
2.4 Specimen
A bare wood and bare concrete assembly, both with and without an added topping as shown and described in Figure 2 were used in this study.
Wood vs Concrete Comparison (§3.1)
1a) 2a) C on c r e te T o pp ing Imp r o v e me n t (§3 .2 ) 1b) 2b)
Figure 2 – Specimens compared in this study, described from top of specimen to bottom as: 1a) Wood joist floor bare - two layers of 19 mm OSB subfloor, two 39 mm x 235 mm scabbed wood
joists spaced 406 mm o/c with glass fibre insulation, three layers of 13 mm gypsum board on resilient channels spaced 610 mm o/c;
1b) Wood joist floor with topping – 100 mm concrete slab on 25 mm resilient interlayer on floor 1a; 2a) Concrete floor bare - 150 mm thick concrete slab;
2b) Concrete floor with topping - 100 mm concrete slab on 25 mm resilient interlayer on floor 2a.
3. RESULTS
First, the floors of Figure 2 are compared from left to right (wood vs. concrete) and second, from top to bottom (effect of topping). All four sources described in Figure 1 above will be used in these comparisons.
3.1 Wood vs Concrete
In this section comparisons are made between the wood and concrete floors, first with a topping and following as bare assemblies.
3.1.1 Floors with Topping
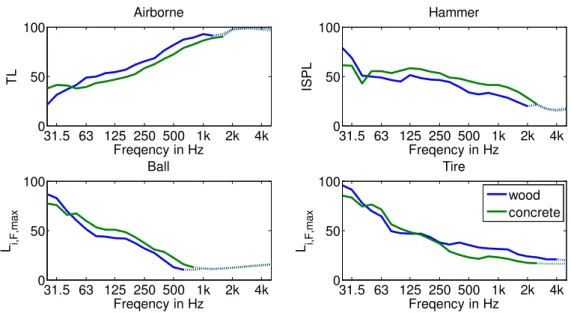
Below, Figure 3 shows the transmission loss (TL) and impact sound pressure levels (ISPL) on both the wood joist and the concrete floor with the concrete topping. The intention of this figure is to give an understanding of the data limitations due to background and flanking noise. The dotted extension of the solid curves denotes sections that are influenced by either flanking or background noise for airborne and impact sources respectively.
Figure 3 – Levels of impact sound pressure (Hammer, Ball, Tire) and Airborne transmission loss for the wood (1b) and concrete (2b) assemblies with topping.
The differences between the concrete and wood assemblies with topping are plotted in Figure 4 for all four sources as improvements relative to the wood joist floor - positive numbers mean that the wood joist floor assembly performs better than the concrete floor assembly. This approach will be continued throughout the paper for all difference plots with all sources.
Figure 4 shows that the difference between the sound insulation of the floors has the same trend for all sources except for the Tire. Again, the frequency range is influenced by background noise or flanking sound, due to the high sound insulation of the floors as shown in Figure 3, so a valid comparison is only possible below 500 Hz. This figure also shows that the concrete floor performs better only below 50 Hz, whereas the wood joist floor performs approximately 5-10 dB better above 50 Hz. Again the Tire is an exception. The floor excited by the large impact of the Tire, is believed to react differently, due to the un-bonded concrete slab topping that is possibly lifting off the wood floor as seen in a previous study [3].
Figure 4 – Difference of levels of impact sound pressure (Hammer, Ball, Tire) and Airborne transmission loss for the wood and concrete assemblies with topping (1b vs. 2b).
31.5 63 125 250 500 1k 2k 4k 0 50 100 Freqency in Hz TL Airborne 31.5 63 125 250 500 1k 2k 4k 0 50 100 Freqency in Hz ISPL Hammer 31.5 63 125 250 500 1k 2k 4k 0 50 100 Freqency in Hz L i,F ,m a x Ball 31.5 63 125 250 500 1k 2k 4k 0 50 100 Freqency in Hz L i,F ,m a x Tire wood concrete 31.5 63 125 250 500 1k 2k 4k -20 -15 -10 -5 0 5 10 15 Freqency in Hz L ev e l D if fe re n c e in d B Airborne Hammer Ball Tire Average wood better concrete better
3.1.2 Bare
The same comparisons are made in this section for the bare floors (1a and 2a). Again the differences have the same trend for all sources, however, in this case with exception of the Hammer. An explanation is given below. Bare, the concrete floor performs better than the wood floor in a broader low frequency range up to 125 Hz, and furthermore above 2 kHz (except for the Hammer). In the mid frequency range the bare wood floor performs approximately 10 dB better than the bare concrete floor.
Figure 5 – Difference of levels of impact sound pressure (Hammer, Ball, and Tire) and airborne transmission loss for the bare wood and concrete floor assemblies (1a vs. 2a).
The discrepancy between tapping machine and the other sources is due to the greater influence of the impedance of the hammers on the power injected above 500 Hz than of the other sources.
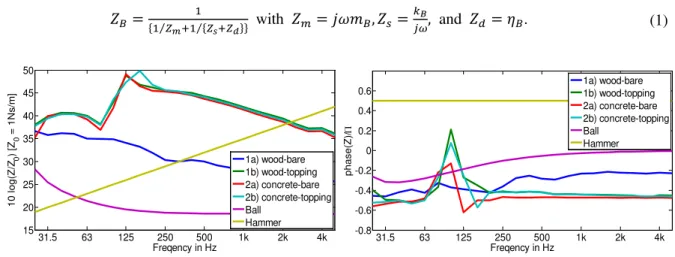
The power injected ����=12�02ℜ{��}����+���2 is a function of the blocked force �0 of the source and the impedance of both the source (��) and the floor (��) [2]. The power injected is greatest when the impedance of the source is the complex conjugate of the impedance of the floor, in other words, when the magnitude of source and floor are equal and their phases are opposite. Impedance measurements made on all floors and theoretical estimates of impedance of two of the sources are displayed as logarithmic magnitude (10 log10{1kg s m|�|⁄ } ) and phase in Figure 6 below. The impedance of the hammer was estimated as �ℎ=���ℎ, with �ℎ=0.5 kg being the mass of a hammer, � = √−1, and � the angular frequency. The impedance of the ball was estimated using a parallel mass-spring-damper system approach
��={1 �⁄ �+1 {�1⁄ �+��}} with ��=����,�� =����, and ��=��. (1)
Figure 6 – Impedance Levels and phase of four floors assemblies and Ball and Hammer sources
31.5 63 125 250 500 1k 2k 4k -30 -20 -10 0 10 20 30 40 50 Freqency in Hz L ev e l D if fe re n c e in d B Airborne Hammer Ball Tire Average
Ball adjusted wood better
concrete better 31.5 63 125 250 500 1k 2k 4k 15 20 25 30 35 40 45 50 10 l og( Z /Z0 ) [Z 0 = 1 N s/ m ] Freqency in Hz 1a) wood-bare 1b) wood-topping 2a) concrete-bare 2b) concrete-topping Ball Hammer 31.5 63 125 250 500 1k 2k 4k -0.8 -0.6 -0.4 -0.2 0 0.2 0.4 0.6 phase (Z )/ Π Freqency in Hz 1a) wood-bare 1b) wood-topping 2a) concrete-bare 2b) concrete-topping Ball Hammer
The mass of the Ball was measured as, ��= 2.5 kg; and the stiffness ��=40E3 N/m and the damping ��= 71.3 Ns/m, were estimated using an elegant method [4] in which the Ball dropped onto a rigid surface is modeled using simple mass-spring-damper system. With this model the stiffness and damping properties of the ball are obtained through a formulation that as input data simply requires the number of bounces until the ball is stationary and the total duration of this process. Note that none of the important higher order ball vibration modes presented in other studies [5-7] are taken into account in this model.
As the magnitude of the floor impedances is much bigger than that of the Ball, the Ball impedance has little influence on the power injected into the floor – the blocked force and real part of the floor impedance dictate the injected power. The magnitude of the Hammer impedance, on the other hand, crosses that of the floors (bare wood at 500 Hz and others at around 2k Hz) and also has almost the opposite phase (the floors being stiffness controlled and Hammer mass controlled), meaning the Hammer impedance has much influence on the power injected above 500 Hz.
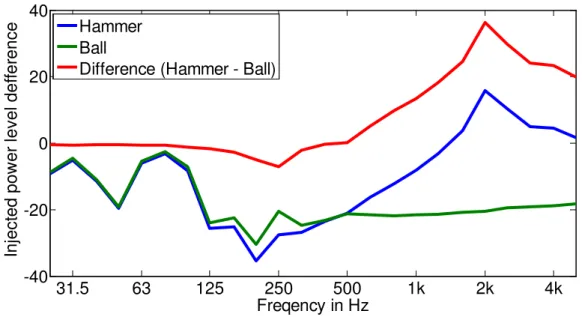
To help understand how much influence the injected power has on the final impact sound pressure levels, the differences between levels of power injected on the bare wood and bare concrete floor by the Hammer (blue) and Ball (green) are displayed in Figure 7. Both power injection differences are the same up to approximately 500 Hz, where the blue curve increases with a slope of approximately 12 dB/Octave due to the Hammer impedance. The relative difference between the Hammer and Ball is plotted in red.
The data of this red curve, the difference of Hammer and Ball level difference of power injected into wood and concreted floors, is used to approximate the difference between the bare concrete and bare wood floor for the Hammer by adding it to the Ball sound level differences in Figure 5 above (red dotted curve). There is very good agreement until approximately 2 kHz at which the level differences are slightly under predicted. This could be due to the simple theoretical estimates of the Ball and Hammer impedances that do not consider any of the higher frequency modes.
Figure 7 – Injected power level differences between wood and concrete floor for Hammer and Ball. 3.2 Effect of topping
In this section comparisons are made between the bare floor and floor with topping, first for the wood joist floor and then for the concrete floor.
3.2.1 Wood
Once more all sources except the Tire have the same trend as shown in Figure 8, namely that the topping improves the insulation of the wood joist floor by more than 15 dB above 50 Hz. The assumption for the discrepancy of the improvement of the Tire, of approximately zero in the mid-frequency range, was explained earlier. A similar study [3] showed that other design
31.5
63
125
250
500
1k
2k
4k
-40
-20
0
20
40
Freqency in Hz
Inj
ect
ed pow
er
l
eve
l def
fer
ence
Hammer
Ball
insulation, except for the Tire in cases involving a resilient element.
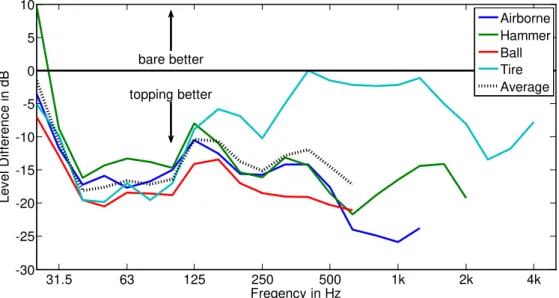
Figure 8 – Level difference of wood joist floor due to adding topping (1a vs. 1b) for all sources 3.2.2 Concrete
For the concrete floor, all sources have the same trend except for the Tire which differs slightly above 500 Hz. Again the similarity of the Ball, Airborne, and Hammer sources above 500 Hz can unfortunately not be assessed due to the high sound insulation of the concrete floor with topping that introduces background and flanking limitations. The improvement due to adding the topping is negative around 50 Hz due to a newly introduced mass-spring-mass resonance (topping-interlayer-floor) as noted in an earlier study [8]. Above the resonance frequency an improvement of approximately 25 dB/Octave is achieved by adding the topping.
Figure 9 – Level difference of concrete floor due to adding concrete (2a vs. 2b) for all sources
4. SUMMARY AND CONCLUSION
The bare concrete floor under test performs better acoustically than the bare wood joist floor below 125 Hz and above 2 kHz (except for the Hammer that continuously performs better for wood above 125 Hz). In the mid frequency range the bare wood joist floor performs approximately 10 dB better than the bare concrete floor. The wood floor with topping performs better than the concrete floor with
31.5 63 125 250 500 1k 2k 4k -30 -25 -20 -15 -10 -5 0 5 10 Freqency in Hz L ev e l D if fe re n c e in d B Airborne Hammer Ball Tire Average bare better topping better 31.5 63 125 250 500 1k 2k 4k -50 -40 -30 -20 -10 0 10 Freqency in Hz L ev e l D if fe re n c e in d B Airborne Hammer Ball Tire Average bare better topping better
topping above 50 Hz for all sources.
All sources have the same trend in level difference when comparing wood versus concrete or the effect of adding a topping. The Tire is an exception for the wood floor with topping, whereas the Hammer is an exception for cases were the impedance of the floors differ substantially and where the impedance of the hammers is of the same magnitude as that of the floors as is the case above 500 Hz. In this case, the discrepancy of the Hammer source could be estimated quite well using a power injection estimate, based on theoretical estimates of the impedance of the Ball and Hammer sources and measurements of the impedance made on the floors.
These trends suggest that on the same floor, measurements of only one source are needed to be able to characterize the sound insulation of the floor for all other sources (except the Tire) – the others can be predicted.
These results also suggest that when comparing two different floors, the sound insulation properties of one floor can be predicted for all sources using the impedance of the floors and sources as input.
Further work is necessary to validate these conclusions for other floor assemblies.
REFERENCES
[1] A.C.C. Warnock and J.A. Birta, “Detailed Report for Consortium on Fire Resistance and Sound Insulation for Floors,” NRC-IRC Report IR-811 (Ottawa, 2000).
[2] B. Zeitler and T. Nightingale, “Impedance of standard impact sources and their effect on impact sound pressure level of floors,” Proc. of Acoustics’08, (Paris, 2008).
[3] B. Zeitler, S. Schoenwald, and T. Nightingale, “Parametric study of sound transmission through lightweight floors,” Proc. of Inter-Noise 2010, (Lisbon, 2010).
[4] M. L. Nagurka and Shuguang Huang, “A mass-spring-damper model of a bouncing ball,” Int. Journal of Engineering Education, 22(2), 393–401 (2006).
[5] B. Park et al., “Force generation characteristics of standard heavyweight impact sources used in the sound generation of building floors”, Journal of the Acoustical Society of America, 128 (6), 2010. [6] S. Schoenwald et al., “Excitation of wood joist floors with the standard rubber ball”, Proc. of Forum,
Acusticum (Aalborg, 2011).
[7] S. Schoenwald et al., “Prediction of the blocked force at impact of Japanese rubber ball source”, accepted in Acta Acustica.
[8] J. Klein et al., “Effects of a concrete topping and modified resilient interlayer on sound transmission through a concrete floor,” Proc. of CAA Conference, (Victoria, Canada, 2010).