Automated high-dimensional flow cytometric data analysis
The MIT Faculty has made this article openly available.
Please share
how this access benefits you. Your story matters.
Citation
Pyne, Saumyadipta et al. “Automated high-dimensional flow
cytometric data analysis.” Proceedings of the National Academy of
Sciences 106.21 (2009): 8519-8524. © 2009 the National Academy of
Sciences
As Published
http://dx.doi.org/10.1073/pnas.0903028106
Publisher
National Academy of Sciences
Version
Final published version
Citable link
http://hdl.handle.net/1721.1/52667
Terms of Use
Article is made available in accordance with the publisher's
policy and may be subject to US copyright law. Please refer to the
publisher's site for terms of use.
Automated high-dimensional flow cytometric
data analysis
Saumyadipta Pynea, Xinli Hua,1, Kui Wangb,1, Elizabeth Rossina,1, Tsung-I Linc, Lisa M. Maiera,d, Clare Baecher-Alland,
Geoffrey J. McLachlanb,e, Pablo Tamayoa, David A. Haflera,d,2, Philip L. De Jagera,d,f,3, and Jill P. Mesirova,2,3
aBroad Institute of MIT and Harvard, 7 Cambridge Center, Cambridge MA 02142;bDepartment of Mathematics andeInstitute for Molecular Bioscience,
University of Queensland, St. Lucia, Queensland, 4072, Australia;cDepartment of Applied Mathematics, National Chung Hsing University, Taichung 402,
Taiwan;dDivision of Molecular Immunology, Center for Neurologic Diseases, Brigham and Women’s Hospital and Harvard Medical School, 77 Avenue
Louis Pasteur, Boston, MA 02115; andfPartners Center for Personalized Genetic Medicine, Boston, MA 02115
Communicated by Peter J. Bickel, University of California, Berkeley, CA, April 3, 2009 (received for review December 28, 2008)
Flow cytometric analysis allows rapid single cell interrogation of surface and intracellular determinants by measuring fluorescence intensity of fluorophore-conjugated reagents. The availability of new platforms, allowing detection of increasing numbers of cell surface markers, has challenged the traditional technique of iden-tifying cell populations by manual gating and resulted in a growing need for the development of automated, high-dimensional ana-lytical methods. We present a direct multivariate finite mixture modeling approach, using skew and heavy-tailed distributions, to address the complexities of flow cytometric analysis and to deal with high-dimensional cytometric data without the need for pro-jection or transformation. We demonstrate its ability to detect rare populations, to model robustly in the presence of outliers and skew, and to perform the critical task of matching cell populations across samples that enables downstream analysis. This advance will facilitate the application of flow cytometry to new, complex biological and clinical problems.
finite mixture model兩 flow cytometry 兩 multivariate skew distribution
F
low cytometry transformed clinical immunology and hematol-ogy over 2 decades ago by allowing the rapid interrogation of cell surface determinants and, more recently, by enabling the analysis of intracellular events using fluorophore-conjugated antibodies or markers. Although flow cytometry initially allowed the investiga-tion of only a single fluorophore, recent advances allow close to 20 parallel channels for monitoring different determinants (1–4). These advances have now surpassed our ability to interpret man-ually the resulting high-dimensional data and have led to growing interest and recent activity in the development of new computa-tional tools and approaches (5–8).The difficulty in data analysis arises from the traditional tech-nique of identifying discrete cell populations by manual gating, which is a labor-intensive process and varies by user experience. The initial computational packages for flow cytometric analyses focused largely on different preprocessing tasks such as data acquisition, normalization, and live cell gating. Besides visualization and trans-formation of flow cytometric data, useful tools such as Flowjo (www.flowjo.com) and the packages in BioConductor (www.bio-conductor.org) (such as prada, flowCore, flowViz, flowUtils, and rflowcyt) allow some form of software-assisted gating and extrac-tion of populaextrac-tions of interest. The operator subjectively demar-cates a cell population while moving through successive 2- or 3-dimensional projections of the data. This process limits the reproducibility of data processing. A more fundamental problem is that this lower dimensional visualization hinders the identification of higher-dimensional features. Furthermore, current methods extract only a limited number of sample parameters, such as the mean fluorescence intensity of a cell population, which can lead to loss of critical information in defining the properties of a cell population.
Although mathematical modeling of the fluorescence intensity distribution of cell populations in higher dimensional flow
cyto-metric data can address these issues, there are significant chal-lenges. First, these populations tend to be noisy, to contain outliers, and, generally, are not symmetrically distributed. This suggests that standard Gaussian mixture approaches to model cell populations, such as those used in Demers et al. (9) and more recent studies (6–8), will often be insufficient and may cause spurious splits leading to an inaccurate count of populations during sample analysis.
Another challenge derives from the difficulty of correctly and efficiently matching corresponding populations across multiple samples in preparation for comparisons across phenotypes or time points. This matching process is key to building classification and prediction algorithms that employ flow cytometric data from patient samples for clinical applications such as diagnosis and prognosis. Notably, a traditional k-partite graph matching formu-lation of this problem, given k samples in 3 or more dimensions, is a member of the nondeterministic polynomial (NP)-complete class of computationally intractable problems (10).
Here, we report the development of a new computational approach for modeling high-dimensional cytometric data directly, without the need to project into lower dimensions or to transform it to reduce asymmetry (5). Such transformations can diminish skew but may lead to less accurate models. Our method is based on finite mixture model clustering techniques. Although mixture modeling is not a new concept in statistics or in modeling flow cytometric data (5–9), we break new ground by introducing (i) the use of multivar-iate skew t mixture models ideally suited for directly modeling flow cytometric data, (ii) algorithms for estimating these multivariate models, and (iii) a method to address the challenging issue of matching cell populations across samples. The use of non-Gaussian distributions in finite mixture modeling is challenging and has only recently been addressed (11, 12).
To enable unsupervised learning of non-Gaussian populations, our multivariate skew t modeling methods use theoretically well-studied high-dimensional distributions (13) that are robust against outliers and skew. This yields clusters, which provide ‘‘automatically gated’’ populations in a sample and, importantly, describe each population with multivariate parameters. We then employ a 2-tiered metaclustering algorithm that matches corresponding pop-ulations across samples despite intersample variation. The rigorous model-based estimation of parameters and population association
Author contributions: P.T., D.A.H., P.L.D.J., and J.P.M. designed research; S.P., X.H., K.W., E.R., P.L.D.J., and J.P.M. performed research; S.P., K.W., T.-I.L., L.M.M., C.M.B.-A., and G.J.M. contributed new reagents/analytic tools; X.H., E.R., and P.L.D.J. analyzed data; and S.P., X.H., P.L.D.J., and J.P.M. wrote the paper.
The authors declare no conflict of interest.
Freely available online through the PNAS open access option. 1X.H., K.W., and E.R. contributed equally to this work.
2To whom correspondence may be addressed. E-mail: [email protected] or [email protected].
3P.L.D.J. and J.P.M. contributed equally to this work.
This article contains supporting information online atwww.pnas.org/cgi/content/full/ 0903028106/DCSupplemental. STATISTICS BIOPHYSICS AND COMPUTATIONAL BIOLOGY
enables sophisticated, quantitative downstream analyses, such as classification and prediction of clinically relevant phenotypes.
In this article, we describe our approach and demonstrate its ability to model robustly in the presence of outliers and skew, to identify a rare cell population, and to characterize and match cell populations across samples. We refer to the method as flow analysis with automated multivariate estimation (FLAME), and make it freely available in a software package with the same name. Results
Overview of the FLAME Method.We developed FLAME to define and characterize discrete populations within a mixture of cells interrogated by flow cytometry without prior knowledge of the number or specific properties of the populations, without transfor-mation to diminish skew, and without the bias of sequential 2-dimensional gating or of selective use of dimensions in the analysis. The fundamental assumption is that we can effectively model such cell populations with a corresponding mixture of skewed and heavy-tailed multivariate probability distributions. Once the mixture model is built, any desired statistical inquiry regarding the biological populations can be translated into an appropriate test or analysis of the mixture model parameters.
FLAME starts with a collection of samples for which k-dimensional flow cytometric data has been acquired, quality-controlled and tabulated into an .fcs file, the standard format for this type of data. We extract from each file an m row by k column matrix, corresponding to intensity values of k markers/antibodies for m cells. Data from tens to hundreds of thousands of cells may be available for each sample. Our task is to find the best description of each sample as a heterogeneous mixture of g populations of cells each modeled by a k-variate distribution. There are 4 main steps in the method that we describe below (see Methods andSI Appendix
for additional details and Fig. S1 inSI Appendixfor the data flow).
Step 1. Automated discovery of cell populations in each sample.For a range of values of g, we use maximum likelihood estimation via the Expectation-Maximization (EM) algorithm to optimally fit the parameters for the k-variate distributions used to model the g populations (14). By default, we use the skew t distribution for modeling. This step can be done in a completely unsupervised fashion, using no a priori knowledge of the data or the markers, or can be guided if ancillary information is available. The output of this step is a preferred model, or clustering, of g cell populations, along with a set of characteristic parameters for each sample and each value of g in the range tested.
Step 2. Determining the appropriate number of populations within each sample.For each sample, we assess the candidate models’ fit by a novel measure, the Scale-free Weighted Ratio (SWR), a weighted ratio of average intracluster scale-free distance to average intercluster scale-free distance and choose the value of g that minimizes the SWR. Average Mahalanobis distances, normalized for the distinct variances (which determine shape, dispersion, orientation, etc.) of different populations, are computed for pairs of points within and across clusters. By weighting these average distances we restrict outlier cells from influencing the number of populations. The resulting model optimizes both intercluster het-erogeneity and intracluster homogeneity.
Step 3. Registering cell populations across samples.To match pop-ulations across samples, we use a 2-tiered approach. First, we identify the modes of all of the populations in each sample based on the mixture model (Step 1). These population ‘‘locations’’ for all of the samples in a class are then pooled and clustered using PAM (Partitioning Around Medoids) (15) to construct a template of locations for the global ‘‘metaclusters.’’ The optimal number of metaclusters in the template is determined by a measure of overall cluster stability known as the average silhouette width (15). Next, we refine the assignment of every sample’s populations to the meta-clusters of the template with a bipartite matching algorithm on population modes and metacluster locations, which takes into account the proportions of cells in each sample’s subpopulations. This step also helps to detect extra or missing populations and to recombine spurious splits.
Step 4. Downstream analysis.Once steps 1–3 are complete, param-eters of the corresponding clusters are available for identification of important features, and subsequent analyses or visualization can be carried out to address biological questions.
Enhanced Fitting of Natural Distributions of Cell Surface Marker Expression.We first show how FLAME’s use of the skew t distri-bution provides more accurate modeling of the skewed cell popu-lations. Accuracy in these measurements enhances statistical power in downstream analyses. This is important when studying modest effects on gene expression associated with genetic variation.
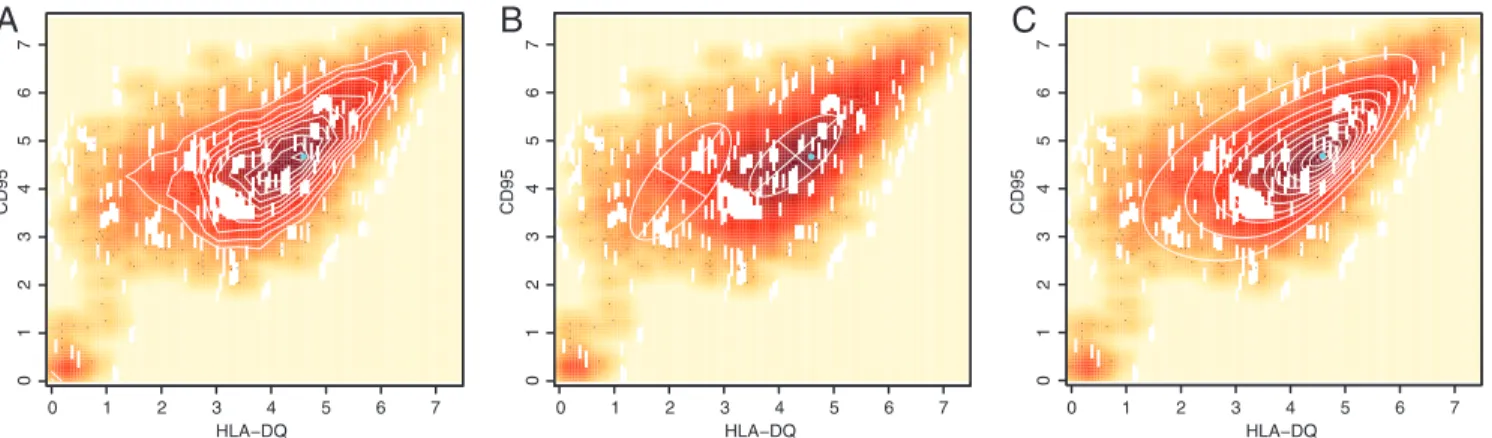
We interrogated a lymphoblastic cell line derived from B cells infected in vitro with the Epstein–Barr virus. Pertinent here is the single cluster of genetically identical cells in this cell line. The contours of the density plot of the data derived after staining the cells with anti-HLA DQ and anti-CD95 antibodies (Fig. 1A)
HLA−DQ CD95
C
01234567 0 1 2 3 4 5 6 7B
HLA−DQ CD95 01234567 0 1 2 3 4 5 6 7A
HLA−DQ CD95 01234567 0 1 2 3 4 5 6 7Fig. 1. Enhanced fit using skew distribution with FLAME. (A) Expression of HLA-DQ and CD95 in a lymphoblastic cell line: A representative sample from 194
cell lines is plotted with hue intensity representing data density. The data contours, in white, show a single unimodal asymmetric population of cells. The mode estimated by skew-t modeling (cyan dot) coincides with the highest percentile contour. (B) Gaussian mixture modeling (MCLUST) yields 2 distinct subpopulations. The true (cyan dot) and estimated (center of cross) modes do not coincide. (C) FLAME fits a single skew t distribution capturing the asymmetry in 1(a) and correctly estimating the mode.
revealed a single, skewed unimodal population of live cells that expressed these 2 markers (see also SI Appendix, Fig. S2). This single, skewed population is a challenge to packages that employ symmetric, Gaussian distributions for mixture model-based clus-tering, e.g., EMMIX (11) or MCLUST (16), which can split the population of cells in a spurious manner (Fig. 1B). Notably, the use of the heavy-tailed skew t distribution by FLAME (Fig. 1C) resulted in far better estimates of the true distribution of this cell population and the mode’s location (Fig. 1 A and B).
Phenotyping Genotypic Classes of Lymphoblastic Cell Lines.Given our method’s ability to fit flow cytometric data, we next compared the results of analyses using FLAME with manually preprocessed data. We used data generated by another project, in which we cultured lymphoblastic cell lines from 194 different individuals under tightly regulated conditions and captured the expression of cell surface markers, including HLA DQ, using a panel of fluorescently labeled monoclonal antibodies. Using manually processed data, we identi-fied the association (P⫽ 2.3 ⫻ 10⫺8) of increased expression of the HLA DQ molecule to the ‘‘G’’ allele of rs9272346, a single nucleotide polymorphism found in the promoter region of the HLA
DQA1 gene, one of the component genes of the HLA DQ
het-erodimer (17). With FLAME-derived measurements, we con-firmed this association between the rs9272346Gallele and higher
expression of HLA DQ (P⫽ 1.31 ⫻ 10⫺9). Thus, both manual and FLAME processing returned the same, highly significant result confirming the comparability of FLAME’s automatically derived parameters to those obtained by a skilled operator.
Automated Discovery of a Rare Subpopulation of Regulatory T Cells.
We next sought to evaluate the effectiveness of our automated method in an unsupervised discovery mode by determining whether FLAME could discover a known rare cell population.
Notably, we uncovered the complex cell population structure found in a sample of human peripheral blood mononuclear cells (PBMC) and identified an important, distinct, low frequency cell population. Specifically, we targeted a recently discovered, relatively rare cell population, CD4⫹CD25highnatural regulatory T cells, that
plays an important role in autoimmunity (18). In humans this population can be identified in peripheral blood using 4 infor-mative markers: CD4, CD25, Foxp3, and HLA DR (19). None of these markers is unique to regulatory T cells, which can be defined as CD4⫹CD25highFoxp3⫹HLA DR⫹. We used FLAME
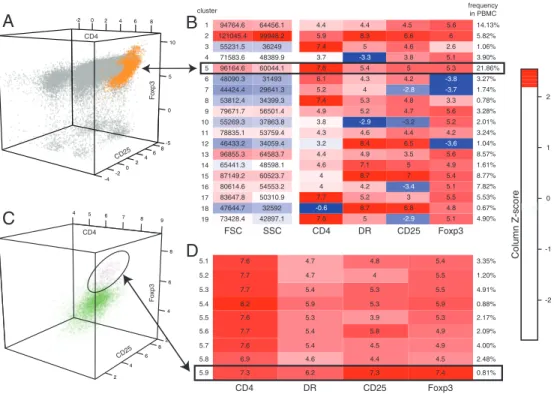
in a 2-step manner to analyze peripheral blood mononuclear cells (PBMC) stained for these 4 markers. First, we fit skew t distribu-tions to the 4-dimensional data, and obtained an optimal model of 19 clusters. Of these, clusters 2 and 5, which contain CD4⫹CD25⫹DR⫹Foxp3⫹cells (Fig. 2 A and B) were candidates for further investigation. Cluster 2 had lower mean CD4 expression, and the forward- and side-scatter values confirmed that this cell population of large, very granular cells consists of activated T cells and not regulatory T cells (Fig. 2B). Further examination of cluster 5, with a second round of clustering, returned an optimal model of 9 subpopulations (Fig. 2D), one of which (cluster 5.9) had the expected high levels of Foxp3 and CD25 expression that charac-terize regulatory T cells. Cluster 5.9 contains 0.81% of the PBMC sample, a fraction that is consistent with the expected frequency of regulatory T cells. This example illustrates FLAME’s ability to identify a rare but important cell population within a PBMC sample in the absence of a specific marker. It also illustrates the power of FLAME to decompose a mixture of cells into its component parts so that each cell cluster or subcluster can be targeted for cell sorting and further functional characterization.
Quantifying Differences in Naı¨ve and Memory T Cell Phosphorylation in a Cohort of Subjects.Here, we assessed the ability of FLAME to identify the corresponding cell populations across a cohort of
7.6 5.1 4.7 4.8 5.4 3.35% 7.7 5.2 4.7 4 5.5 1.20% 7.7 5.3 5.4 5.3 5.5 4.91% 8.2 5.4 5.9 5.3 5.9 0.88% 7.6 5.5 5.3 3.9 5.3 2.17% 7.7 5.6 5.4 5.8 4.9 2.09% 7.6 5.7 5.4 4.5 4.9 4.00% 6.9 5.8 4.6 4.4 4.5 2.48% 7.3 5.9 6.2 7.3 7.4 0.81% CD4 DR CD25 Foxp3
D
73428.4 42897.1 47644.7 32592 83647.8 50310.9 80614.6 54553.2 87149.2 60523.7 65441.3 48598.1 96855.3 64583.7 46433.2 34059.4 78835.1 53759.4 55269.3 37863.8 79671.7 56501.4 53812.4 34399.3 44424.4 29641.3 48090.3 31493 96164.6 60044.1 71583.6 48389.9 55231.5 36249 121045.4 99948.2 94764.6 64456.1 SSC CD4 DR CD25 Foxp3 FSC 1 2 3 4 5 6 7 8 9 10 11 12 13 14 15 16 17 18 19 clusterB
5.9 8.3 6.6 6 5.82% 7.4 5 4.6 2.6 1.06% 3.7 -3.3 3.8 5.1 3.90% 7.6 5.4 5 5.3 21.86% 6.1 4.3 4.2 -3.8 3.27% 5.2 4 -2.8 -3.7 1.74% 7.4 5.3 4.8 3.3 0.78% 4.9 5.2 4.7 5.6 3.28% 3.8 -2.9 -3.2 5.2 2.01% 4.3 4.6 4.4 4.2 3.24% 3.2 8.4 6.5 -3.6 1.04% 4.4 4.9 3.5 5.6 8.57% 4.6 7.1 5 4.9 1.61% 4 8.7 7 5.4 8.77% 4 4.2 -3.4 5.1 7.82% 7.7 5.2 3 5.5 5.53% -0.6 8.7 6.8 4.8 0.67% 7.6 5 -2.9 5.1 4.90% 4.4 4.4 4.5 5.6 14.13% frequency in PBMCA
C
-4 -20 2 4 6 -5 8 0 5 10 -2 0 2 4 6 8 CD25 CD4 F o xp3 4 2 4 6 8 2 4 6 8 5 6 7 8 9 CD25 CD4 F o xp3 Column Z-score 0 -2 -1 1 2Fig. 2. Automated discovery of a rare subset of regulatory T cells with FLAME. (A) 3-dimensional projection (for markers CD4, CD25, Foxp3) of the stained PBMCs.
FLAME’s 4-variate modeling yielded 19 clusters as optimal. Cluster 5 (orange) has high expression of CD4 and CD25, rendering it the best candidate to represent the regulatory T cell population. (B) Clusters’ expression profiles as a heat map of the 4 markers, FSC and SSC. Lower CD4 and high FSC and SSC in cluster 2 suggest activated T cells rather than regulatory T cells. (C) Subclustering of cluster 5 yields an optimal model of 9 subpopulations. Subcluster 9 (purple) matches the CD4⫹DR⫹CD25brightFoxp3⫹of regulatory T cells. Subclusters 1– 8 are in green. (D) The heat map shows that subcluster 9 has the highest expression levels of DR,
CD25 and Foxp3, and is 0.81% of live PBMCs, consistent with an expected frequency of⬃1%.
STATISTICS
BIOPHYSICS
AND
COMPUTATIONAL
subjects by forming ‘‘metaclusters’’ to assess differences between classes of subjects or experimental conditions.
We reanalyzed raw flow cytometric data generated ex vivo by Maier and colleagues to determine differences in phosphorylation events downstream of T cell receptor activation in naı¨ve and memory T cells (20). For each of the 30 subjects, whole blood was stained using labeled antibodies against CD4, CD45RA, SLP76 (pY128), and ZAP70 (pY292) before stimulation with an anti-CD3 antibody (baseline measurement), and another aliquot underwent the same staining procedure 5 min after stimulation.
FLAME segregated the baseline data into 5 cell clusters (Fig. 3
A and B); 2 of these clusters represent the naı¨ve
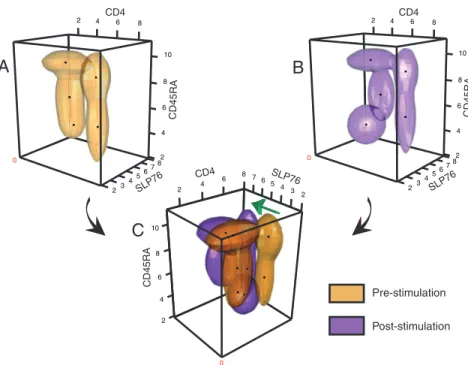
(CD4⫹CD45RAhigh) and memory (CD4⫹CD45RAlow) T cell sub-sets. The large shift in phosphorylation of SLP76 after stimulation is clearly visible (Fig. 3C). In 2 metaclustering steps, we first assigned each individual’s cell clusters to metaclusters within the prestimulation and poststimulation cohorts, and then identified corresponding metaclusters across these 2 cohorts (SI Appendix, Fig. S3). Importantly, despite the large phosphorylation shift, we note that FLAME identified the correct correspondence of each sample’s prestimulation and poststimulation cell subpopulations. Moreover, when we extracted parameters, we replicated the results found in manually derived data (20), e.g., that memory T cells displayed a lower baseline SLP76 phosphorylation level than naı¨ve T cells (P⫽ 5.7 ⫻ 10⫺5). Further, by matching samples pre- and postsimulation, we found that naı¨ve T cells displayed a greater fold-induction in SLP76 phosphorylation (P ⫽ 0.01) (20) than memory T cells do. Similar results were obtained for ZAP70 (P⫽ 2.2⫻ 10⫺4). Thus, FLAME provided objective, robust, reproduc-ible, automated analysis of data collected on different days across a cohort of subjects.
FLAME can extract many more parameters than a human operator using routine methods. The major difference that a human operator would observe is the poststimulation increase in certain cell populations’ levels of SLP76 phosphorylation (Fig. 3C). How-ever, FLAME also captured additional parameters from each cell
cluster (SI Appendix, Table T1) that describe its shape and spatial orientation. These parameters can be informative, as illustrated in Fig. 3 A and B. The shapes of the 2 CD4⫹clusters were narrowed after T cell receptor stimulation. Importantly, we quantitatively captured this difference using a feature selection method. The result of this analysis is displayed as a heat map inSI Appendix, Fig. S4 that highlights the clear differences observed in this geometric feature and in many other parameters.
In this example, we have shown FLAME’s ability to (i) perform matching of cell populations within and across cohorts of samples, (ii) extract features that can be used to compare different classes of samples or subjects, and (iii) recapitulate the manual data process-ing of a trained human operator.
Discussion
Computational modeling of flow cytometric data is receiving increasing attention with the rapidly rising number of simulta-neously monitored markers. Gaussian mixture modeling for flow cytometry was introduced by Demers and colleagues (9) and is the subject of ongoing development (6–8). However, the use of Gauss-ian distributions can cause spurious splits because of outliers and skew in the data as shown in Fig. 1. Lo and colleagues (5) address this issue in flowClust by employing a Box-Cox transformation to reduce skew, followed by an efficient t mixture modeling algorithm originally introduced by Peel and McLachlan (11). However, even in the 1-dimensional case this approach can yield indistinguishable models for 2 very distinct forms of skew (see SI Appendix, SI
Discussion). On the other hand, our direct and parametric modeling
with skew t preserves the distinct nature of the original distributions and precisely models the asymmetry and ‘‘heavy tails’’ of the data. Importantly, this approach can capture phenotypic differences that may be lost if the data were transformed to appear symmetric.
The metaclustering approach in FLAME matches corresponding cell populations across samples. This registration is critical for downstream analysis, e.g., class discovery or class prediction, and not available in other methods. Metaclustering is stable with respect
Pre-stimulation Post-stimulation 3 2 45 67 2 8 4 6 8 10 2 4 6 8
A
CD4 CD45RA SLP76 0 23 45 67 2 8 4 6 8 10 2 4 6 8B
CD4 CD45RA SLP76 0C
CD4 SLP76 CD45RA 2 4 6 8 10 2 4 8 6 7 65 4 3 2 0Fig. 3. Mixture modeling of prephosphorylation and postphosphorylation T cell populations. (A and B) FLAME modeling of (A) pre- and (B) postphosphorylation
data for a representative subject. The data are fit with 4-variate t mixtures projected into 3 dimensions, ZAP70 is not shown. Three-dimensional abstractions of the (A) pre- and (B) postphosphorylation clusters are shown in yellow and purple respectively. Black dots mark the cluster modes. (C) The results are superimposed, and the view is rotated to emphasize the differences in the SLP76 dimension that occur with stimulation. A green arrow indicates the increase in SLP76 phosphorylation of the naı¨ve and memory CD4⫹T cell populations and in the CD4⫺CD45RAintermediatepopulation.
to the inherent biological variation as illustrated in the T cell phosphorylation example and in simulation studies we performed (seeSI Appendix, SI Methods). However, metaclustering must be used with care and with an understanding of the underlying biology of the problem. For example, when identifying populations across phenotypes or experimental conditions, it is critical to consider the possibility of (i) new populations arising or (ii) differing proportions of cells belonging to each subpopulation.
FLAME should be used at the distal end of a production pipeline that includes a suite of QA/QC steps that minimizes experimental noise. Several such approaches are in various stages of implemen-tation (21, 22). Because FLAME uses the standard *.fcs as its input format, it can be readily coupled to any commonly used prepro-cessing method. Importantly, the user should know exactly how their data are collected and processed and whether either will cause artifacts, spikes, or boundary populations.
The advantage of FLAME’s ability to model a sample in the multiple dimensions inherent in flow cytometry data is clear. Because the number of surface markers simultaneously captured by flow cytometry has grown over the past decade, human operators can no longer directly visualize or analyze the data. The current strategy to sequentially gate cell populations by projection to 2- or 3-dimensional space may be reasonable, particularly when a spe-cific, predetermined cell population is sought. However, this ap-proach has substantial limitations related to subjectivity, lack of efficiency and reproducibility for the examination of large number of samples, and loss of information for the multidimensional analysis necessary for discovery of novel populations. In our examples, we have shown that FLAME can recapitulate the data processing performed by a trained human operator while extracting a greater number of param-eters for use in classification or diagnostic tests.
Some past approaches (23–25) to automated multidimensional flow cytometric analysis were restricted to supervised or nonpara-metric techniques. The unsupervised learning methodology of FLAME allows sensitive and more accurate exploratory identifi-cation of new, and known, populations for high-dimensional flow cytometric data. We process data in a pure discovery mode, evaluate a range of models with different numbers of clusters and, using a quantitative measure, identify an optimal solution that best fits these data. Our approach is statistically rigorous and eliminates the subjectivity of a human operator. Importantly, because we can use skew distributions to model our data, extracted parameters offer a better description of a cell population’s expression characteristics. Although FLAME’s approach is rigorous and reproducible, it is not rigid and can be adapted to a number of different study designs. As illustrated in the regulatory T cell example, one can subcluster a population to explore structure at a higher resolution. Further-more, one can readily implement a gating step before or during the FLAME analysis if certain cell populations are not of interest. Similarly, once clusters of interest are discovered, the most infor-mative dimensions can be defined and subsequently used with FLAME in an identification mode. This enhances processing speed and ensures that all samples are processed in the same manner.
There are many opportunities for further research and enhance-ment of the systematic analysis of multiparametric flow cytometric data as presented here. Instead of relying on the ‘‘one component, one cluster’’ legacy of mixture modeling, the use of multicomponent population models could yield more complex and even nonconvex shapes. Here, FLAME might be extended with a hierarchical design to address this need (SI Appendix, SI Discussion). Another challenge is more sensitive detection of very small populations, which may require the power of vastly increased sample sizes. One strategy here is the stepwise approach described in the regulatory T cell example above to focus on the subpopulation of greatest interest followed by a second round of clustering to extract the rare cell population.
The ‘‘Discovery’’ mode of FLAME is computationally intensive as a range of models is evaluated for optimality. We estimate that
FLAME may require ⬇30 min to discover the optimal model (number of clusters) within a sample of 20,000 cells with 6-dimen-sional data and 15 cell populations (seeSI Appendix, SI Discussion). However, once one or a small number of samples is run in this manner, the range of models evaluated can be significantly reduced for the remaining samples, resulting in faster processing speeds. The Discovery mode is distinct from a ‘‘Clinical’’ mode in which the desired number of clusters is known, and FLAME is simply used to extract parameters on each cluster in large numbers of samples. In Discovery mode, it is difficult to compare FLAME to a human operator both because an operator does not consider more than 3 dimensions of information simultaneously and because such efforts are not standardized. However, in Clinical mode, the comparison is more pertinent as a precise set of parameters needs to be extracted. Here, FLAME is able to process the sample of 20,000 cells with 6-dimensional data and 15 cell populations in⬍4 min (SI Appendix, SI Discussion). This is comparable with a human operator but is much more precise and reproducible.
In summary, we have devised a direct computational approach for the rigorous, flexible, automated, multivariate analysis of flow cytometric data, which handles outliers and skew without the need of any preliminary transformation and includes a method for identifying corresponding subpopulations of cells across samples. The software implementation of this tool, when combined with rigor-ous quality control of the production pipeline, can enhance the use of the flow cytometric platform for disease diagnosis and clinical utility.
Methods
Data Preparation. Extraction of the matrix of marker/antibody intensity values for each cell in a sample (with optional forward-scatter (FSC) and side-scatter (SSC) columns) as described in Results above is performed with Bioconductor (www.bioconductor.org) packages flowCore, prada and Biobase. The inten-sities, but not the FSC and SSC, are transformed with a biexponential (Logicle) transformation and the matrix is output as a *.txt file. Details of example datasets are described inSI Appendix, SI Methods.
Identifying Cell Populations by Mixture Modeling of a Sample. FLAME fits each cell population in a sample to a multivariate parametric cluster (a component) with a full covariance matrix. The skew t distribution is used by default (SI Appendix, Figs. S5 and S6). Alternatively, the user may choose to use t (Student t) or skew normal distributions for modeling. Here, we describe the computations for the skew t case (seeSI Appendix, SI Methods for alternative distributions). We model the k-dimensional data points in a sample Yiwith the probability density
function (or pdf) f with unknown parameters⌿ consisting of a mixture of g components for a range of values of g in unknown mixing proportions p1, . . . , pg
(p1, . . . , pgⱖ0; 兺h⫽1...gph⫽ 1) f共Yi,⌿兲 ⫽
冘
h⫽1
g
phfh共y;h,⌺h, Dh,h兲 [1]
where fh(y;h,⌺h, Dh,h) is the multivariate skew t pdf for the hth component with
location vectorh, scale matrix⌺h, skew parameter Dhand degrees of freedomh.
The multivariate skew t distribution is defined by introducing skewness in a multivariate elliptically symmetric t distribution (26)
f共y;, ⌺ D, 兲 ⫽ 2tk,共y;, ⍀兲T⫹k共/兲 y僆 Rk, [2] where⍀ ⫽ ⌺ ⫹ DDT, ⫽ DT⍀⫺1(y⫺), 2 ⫽ ⫹
⫹ k 共1 ⫺ DT⍀⫺1D兲, ⫽ (y⫺)T⍀⫺1(y⫺); tk,(y;, ⍀) is the pdf of a k-dimensional t distribution with
degrees of freedom, mean, and scale covariance ⍀; T ⫹ k(M)is the t distribution
function with ⫹ k degrees of freedom. We fit the entire vector of unknown parameters⌿⫽(,⌺,D,)totheflowcytometricdata,andestimatetheunknown mixing proportions p1. . . pg, using the expectation-maximization (EM)
algo-rithm (14). FLAME uses a newly developed multivariate skew density mixture modeling EM program, which is freely available from the authors (www.math-s.uq.edu.au/⬃gjm/EMMIX-skew). To speed up convergence, we perform 10 EM iterations with initialization by a k-means algorithm, and choose the one with the largest log-likelihood as the initial condition for the rest of the EM iterations until convergence. This entire process is repeated for all of the samples independently for a range of g values from 2 to max {2k, 20}. The program also allows fitting for
STATISTICS
BIOPHYSICS
AND
COMPUTATIONAL
a specific range of g. The mixture model induces ‘‘soft’’ clustering, i.e., each data point has a probability of belonging to each of the different components. To find the optimal number of components, g*, for each sample, we assign each data point i to the component with maximal posterior probability pi, then set g* to the
value of g that minimizes the scale-free weighted ratio (SWR) of average intra- to intercluster distances, where
SWR⫽
冑
冘
i, j僆C pipjdM 2 共i, j兲冒
冘
i, j僆C pipj冑
i僆C, j僆C⬘,C⫽C⬘冘
pipjdM 2 共i, j兲冒
冘
i僆C, j僆C⬘,C⫽C⬘ pipjand the scale-free Mahalanobis distance dM(i, j) between every pair of points (i, j) in the sample is given by
dM共i, j兲 ⫽
再
冑
共i ⫺ j兲 T⌺ C ⫺1共i ⫺ j兲 i, j僆 C冑
共i ⫺ j兲T共⌺ C⫹ ⌺C⬘兲⫺1共i ⫺ j兲 i 僆 C, j 僆 C⬘, C ⫽ C⬘.The posterior probability piof point i belonging to cluster C from the mixture
model is used for weighting the average distances and⌺cdenotes the scale
variance of cluster C. The final mixture model output includes the multivariate cluster parameters, mixture weights (or proportions), and cluster membership labels for the original data points. Although FLAME assesses quality of fit using SWR, the user can opt for other criteria (seeSI Appendix, SI Methods).
Matching Populations Across Samples. To match populations and mixture model parameters across samples, we perform metaclustering of populations using a 2-step strategy. For details seeSI Appendix, SI Methods.
Step 1. PAM clustering. For a given class of samples, we first overlay all of the cluster locations, represented by their modes, across the samples and then apply the Partitioning Around Medoids (PAM) algorithm (15) to construct a high-dimensional template of G metaclusters for that class specified by the locations (high-dimensional medians, also known as ‘‘medoids’’) and the associated weights (the proportions of cells) for the subpopulations. The medoids computed by PAM serve as natural metacluster locations. A metacluster’s weight is the median weight of the c clusters closest to its location, c⫽ (total number of clusters
in the metacluster)/5. The optimal number of metaclusters, G*, is determined by maximizing the average silhouette width. We use PAM because of its robustness to outlier effects. Thus, metaclusters are made of clusters, as represented by their location representatives, and not the original data points.
Step 2. Bipartite matching. Clusters from every sample are matched to the metaclusters of its class-template from Step 1 using an enhanced version of the classical minimum cost bipartite matching problem. The matching problem is formulated as integer programming (IP) and solved with a fast IP solver routine. We seek to ensure that an optimal solution for a biologically homogeneous set of samples matches clusters with metaclusters that have both similar locations and weights. Importantly, in a given solution, multiple clusters could be matched to one metacluster of combined weight (or capacity) and comparable location, and vice versa. In this manner our approach handles missing, extra or spuriously split clusters in the mixture model output of each sample (seeSI Appendix, SI Meth-ods). Note that this second step is both a global clustering of clusters across samples according to location, and a feature registration or component labeling procedure that matches the clusters from sample to sample.
For metaclustering of samples across 2 classes, we apply a similar bipartite matching formulation to the templates of the compared classes and then extend the obtained matching from the templates to the respective classes based on the scheme described above. The final superset of all labeled clusters becomes the full set of features for the entire sample collection. Most features should be repre-sented in every sample. However, this may not be the case because of biological or technical variation. In that case, they are labeled as missing values in the corresponding samples. Corresponding features across samples retain their own parameters and weights.
Performing Association Testing to a Genetic Variation. We assessed the corre-lation of our lymphoblastic cell line HLA DQ expression data to the rs9272346 single nucleotide polymorphism using the quantitative trait analysis module of the PLINK software suite (pngu.mgh.harvard.edu/⬃purcell/plink and ref. 27). Genotypes for each cell line were obtained from the HapMap project (www.hap-map.org).
ACKNOWLEDGMENTS. We thank G. Gilliland and M. Kharas for discussions and data, and J. Bistline and C. Lewis for assistance with figures. This work was supported by the National Institutes of Health (S.P., X.H., E.R., C.B., P.T., D.A.H., P.L.D.J., and J.P.M.) and National Science Foundation (S.P., P.T., and J.P.M.); National Multiple Sclerosis Society (D.A.H. and P.L.D.J.); the Australian Research Council (K.W. and G.J.M.); the Juvenile Diabetes Foundation (L.M.M.); and the National Science Council of Taiwan (T-I.L.).
1. Perfetto SP, Chattopadhyay PK, Roederer M (2004) Seventeen-colour flow cytometry: Unravelling the immune system. Nat Rev 4:648 – 655.
2. De Rosa SC, Brenchley JM, Roederer M (2003) Beyond six colors: A new era in flow cytometry. Nat Med 9:112–117.
3. De Rosa SC, Herzenberg LA, Herzenberg LA, Roederer M (2001) 11-color, 13-parameter flow cytometry: Identification of human naive T cells by phenotype, function, and T-cell receptor diversity. Nat Med 7:245–248.
4. Irish JM, Kotecha N, Nolan GP (2006) Mapping normal and cancer cell signalling networks: Towards single-cell proteomics. Nat Rev 6:146 –155.
5. Lo K, Brinkman RR, Gottardo R (2008) Automated gating of flow cytometry data via robust model-based clustering. Cytometry A 73:321–332.
6. Wang H, Huang S (2007) Mixture-model classification in DNA content analysis.
Cytom-etry A 71:716 –723.
7. Boedigheimer MJ, Ferbas J (2008) Mixture modeling approach to flow cytometry data.
Cytometry A 73:421– 429.
8. Chan C, et al. (2008) Statistical mixture modeling for cell subtype identification in flow cytometry. Cytometry A 73A:693–701.
9. Demers S, Kim J, Legendre P, Legendre L (1992) Analyzing multivariate flow cytometric data in aquatic sciences. Cytometry 13:291–298.
10. Shatsky M, Shulman-Peleg A, Nussinov R, Wolfson HJ (2005) Recognition of binding patterns common to a set of protein structures. Res Comput Mol Biol Proc 3500:440 – 455. 11. Peel D, McLachlan GJ (2000) Robust mixture modelling using the t distribution. Stat
Comp 10:339 –348.
12. Lin TI, Lee JC, Hsieh WJ (2007) Robust mixture modeling using the skew t distribution.
Stat Comp 17:81–92.
13. Genton MG (2004) Skew-Elliptical Distributions and Their Applications : A Journey
Beyond Normality (Chapman, Hall/CRC, Boca Raton, FL).
14. Dempster AP, Laird NM, Rubin DB (1977) Maximum likelihood from incomplete data via em algorithm (with discussion). J R Stat Soc Ser B 39:1–38.
15. Kaufman L, Rousseeuw PJ (2006) Finding Groups in Data: An Introduction to Cluster
Analysis (Wiley, John & Sons, Hoboken, NJ).
16. Fraley C Raftery AE (2002) Model-based clustering, discriminant analysis, and density estimation. J Am Stat Assoc 97(458):611– 631.
17. Choy E, et al. (2008) Genetic analysis of human traits in vitro: Drug response and gene expression in lymphoblastoid cell lines. PLoS Genet 4:e1000287.
18. Sakaguchi S, Sakaguchi N, Asano M, Itoh M, Toda M (1995) Immunologic self-tolerance maintained by activated T cells expressing IL-2 receptor alpha-chains (CD25). Break-down of a single mechanism of self-tolerance causes various autoimmune diseases.
J Immunol 155:1151–1164.
19. Baecher-Allan C, Wolf E, Hafler DA (2006) MHC class II expression identifies functionally distinct human regulatory T cells. J Immunol 176:4622– 4631.
20. Maier LM, Anderson DE, De Jager PL, Wicker LS, Hafler DA (2007) Allelic variant in CTLA4 alters T cell phosphorylation patterns. Proc Natl Acad Sci USA 104:18607–18612. 21. Le Meur N, et al. (2007) Data quality assessment of ungated flow cytometry data in high
throughput experiments. Cytometry A 71:393– 403.
22. Perfetto SP, Ambrozak D, Nguyen R, Chattopadhyay P, Roederer M (2006) Quality assurance for polychromatic flow cytometry. Nat Protoc 1:1522–1530.
23. Costa ES, et al. (2006) A new automated flow cytometry data analysis approach for the diagnostic screening of neoplastic B-cell disorders in peripheral blood samples with absolute lymphocytosis. Leukemia 20:1221–1230.
24. Roederer M, Moore W, Treister A, Hardy RR, Herzenberg LA (2001) Probability binning comparison: A metric for quantitating multivariate distribution differences. Cytometry 45:47–55.
25. Toedling J, Rhein P, Ratei R, Karawajew L, Spang R (2006) Automated in-silico detection of cell populations in flow cytometry readouts and its application to leukemia disease monitoring. BMC Bioinf 7:282.
26. Azzalini A, Capitanio A (2003) Distributions generated by perturbation of symmetry with emphasis on a multivariate skew t-distribution. J R Stat Soc Ser B 65(2):367– 389.
27. Purcell S, et al. (2007) PLINK: A tool set for whole-genome association and population-based linkage analyses. Am J Hum Genet 81:559.