DIAL • 4, rue d’Enghien • 75010 Paris • Téléphone (33) 01 53 24 14 50 • Fax (33) 01 53 24 14 51 E-mail : [email protected] • Site : www.dial.prd.fr
D
OCUMENT DE
T
RAVAIL
DT/2006-12
Colonisation and Development in
the Former French West Africa :
The Long-term Impact of the
Colonial Public Policy
COLONISATION AND DEVELOPMENT IN THE FORMER FRENCH WEST
AFRICA : THE LONG-TERM IMPACT OF THE COLONIAL PUBLIC POLICY
Elise Huillery
Paris Jourdan Sciences Economiques (PSE), DIAL, Paris
[email protected] Document de travail DIAL
Juillet 2006
ABSTRACT
To what extent did the colonial public policy influence the current regional inequalities in the French-speaking West Africa? This paper uses the differences in development outcomes across the areas of the former French West Africa to show the existence of colonial long term effects on development paths. To correct from potential biases, I take carefully into account the geographical and pre-colonial characteristics of the districts and use the spatial discontinuities of the colonial public policy to control for unobservable districts’ characteristics. Results show that colonial history is a strong determinant of current development of the districts of the former French West Africa. First, the African chiefs’ association to the colonial administration played a discriminating role between districts but its effects are ambiguous, positive on educational performances and negative on the health performances. Secondly, the colonial public investments in education, health and public works explain much of the current regional development inequalities. The nature of the public investment also matters: each type of current performance has been specifically determined by the corresponding colonial investment. The colonial public policies had thus very persistent effects and played a strong spatial discriminating role.
Key Words: English: Colonisation, West Africa, Spatial inequalities, Development, Public goods,
Public policy
RESUME
Dans quelle mesure les inégalités spatiales en Afrique de l’Ouest francophone ont-elles été influencées par la politique publique menée par les Français pendant la période coloniale ? Ce papier utilise les différences de développement entre les cercles de l’ancienne Afrique Occidentale Française (AOF) pour mettre en évidence des effets de long terme de la colonisation sur les trajectoires de développement. Les caractéristiques géographiques ainsi que l’histoire précoloniale des cercles ont été prises en compte pour corriger l’éventuelle endogénéité de la politique coloniale. J’utilise ensuite les discontinuités spatiales de la politique coloniale pour contrôler également certaines caractéristiques inobservables des cercles. Les résultats montrent que l’histoire coloniale fut un déterminant important du développement des cercles de l’ancienne AOF. La première source de discrimination spatiale fut la politique d’association des chefs africains dans l’administration coloniale, mais son effet reste ambigu : elle a joué positivement sur les performances éducatives mais négativement sur les performances de santé. La deuxième source de discrimination entre les cercles, plus importante que la première, fut la politique d’investissement en biens publics (éducation, santé, infrastructures), qui explique une part importante des inégalités de développement actuelles entre les cercles. On observe enfin que la nature des investissements importe, même à long terme : les performances actuelles dans les domaines de l’éducation, de la santé et des infrastructures sont chacune spécifiquement expliquées par l’investissement colonial « correspondant ». La politique coloniale française a donc créé des discriminations spatiales très persistantes dont les marques sont encore nettement visibles aujourd’hui.
Mots-clés : Colonisation, Afrique de l’Ouest, Inégalités spatiales, Développement, Biens publics,
Politique publique
Contents
1. INTRODUCTION... 5
2. DESCRIPTION OF CURRENT INEQUALITIES OF DEVELOPMENT IN THE FORMER FRENCH WEST AFRICA ... 8
2.1. Descriptive statistics on the districts’ development... 9
2.2. The geographical distribution of the development inequalities ... 10
3. HISTORICAL BACKGROUND: THE FRENCH COLONIZATION... 11
3.1. The financial and administrative organization ... 11
3.1.1. The administrative organisation ... 11
3.1.2. The financial organisation ... 11
3.2. The public goods’ investment policy... 12
3.2.1. Were the investments determined by the districts’ tax revenue?... 12
3.2.2. What, where, how much? ... 13
3.3. The indigenous policy ... 14
3.3.1. The potential role of the African chiefs ... 14
3.3.2. The status of the African chiefs in the colonial history ... 14
3.3.3. Descriptive statistics on the indigenous policy... 15
4. FIRST ESTIMATES OF THE IMPACT OF THE COLONIAL PUBLIC POLICY CONTROLLING FOR OBSERVABLE CHARACTERISTICS ... 17
4.1. The observable characteristics of the districts... 17
4.1.1. The geographical characteristics... 18
4.1.2. The pre-colonial characteristics ... 18
4.1.3. The French conquest characteristics ... 19
4.2. The empirical strategy ... 21
4.3. OLS estimates of the impact of the colonial public policy... 23
5. FURTHER ESTIMATES USING THE NEIGHBOURING DISTRICTS TO CONTROL FOR UNOBSERVABLE CHARACTERISTICS ... 25
5.1. Definition of the problem... 25
5.2. First estimation of β ... 26
5.3. Second estimation of β ... 28
6. CONCLUSIONS ... 30
REFERENCES ... 31
List of figures
Figure 1: The bias’s sources in the estimation of the impact of the colonial policy... 17List of maps
Map 1: Territorial organization of the French West Africa (1925) ... 35
Map 2: School attendance rate of the 7-12 year old children... 36
Map 3: Children stunting rate of the less than 5-year old children ... 36
Map 4: Share of the households equipped with electrical supplies ... 37
Map 5: Share of the households equipped with private water tap ... 37
Map 6: Share of the households using a modern combustible... 37
Map 7: The number of teachers per 100,000 habitants ... 38
Map 8: The medical staff per 100,000 habitants... 38
Map 9: The amount of Francs invested in public works per 1,000 km2 ... 39
Map 10: The African chiefs’ wages per capita (in Francs) ... 39
Map 11: Pre-colonial empires and kingdoms ... 40
List of tables
Table 1: Measures of the districts’ level of development around 1995 and its heterogeneity ... 41Table 2: Decomposition of the total variance of the current development indicators between and withincountries ... 41
Table 3: The link between colonial investments and tax revenue at the districts’ level... 42
Table 4: The colonial investments in public goods until 1930... 42
Table 5: The impact of the indigenous policy on education and health: OLS estimates ... 43
Table 6: The impact of the indigenous policy on infrastructures development: OLS estimates ... 44
Table 7: The impact of the colonial investments in education on education and in health on health: OLS estimates... 45
Table 8: The impact of the colonial investments in infrastructures on infrastructures development: OLS estimates ... 46
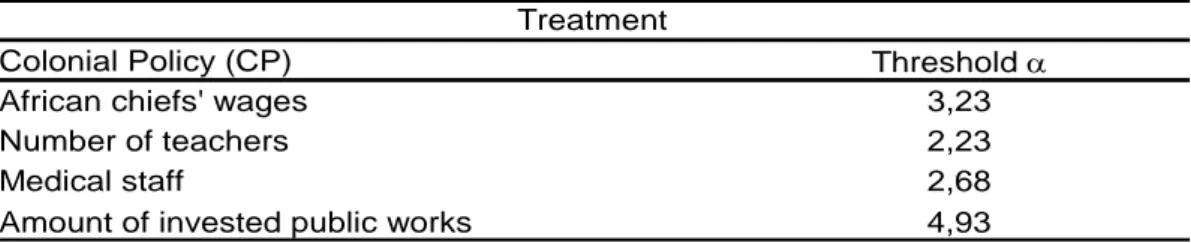
Table 9: The minimal ratio between the high and the low treatments of two neighbouring districts ... 47
Table 10: First estimation of β controlling for unobservable characteristics: matching districts and using the colonial policy as a treatment ... 47
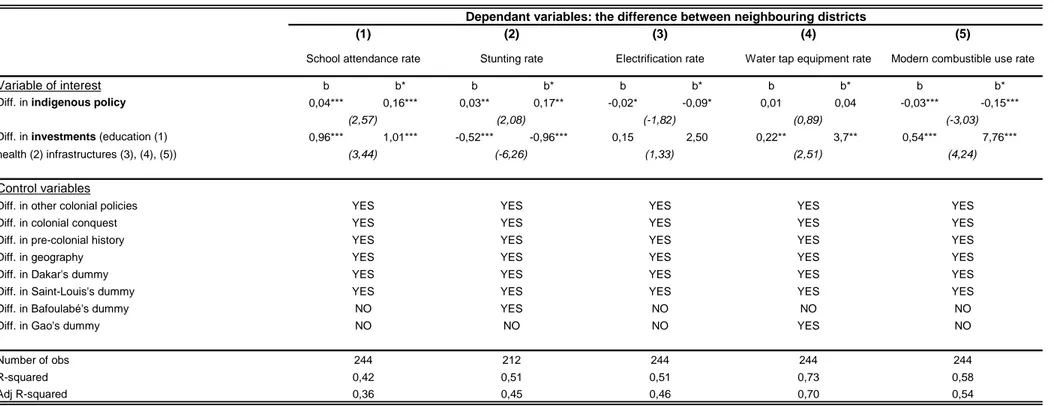
Table 11: Second estimation of β controlling for unobservable characteristics: The determinants of thedifference in the development of the neighbouring districts ... 48
1. INTRODUCTION
Since the independences in the 1960’s, West Africa’s economic performances have been strikingly low in comparison with the rest of the developing countries. This is what makes many observers talk about the “African tragedy”. Obviously, explanations of this tragedy are of growing concern. Many papers try to identify the institutional factors that obstruct the
development of the African countries. The economic historian Paul Bairoch1 writes: “There is
no doubt that a large number of negative structural features of the process of economic underdevelopment have historical roots going back to European colonization”. The main motivation of this paper is actually to evaluate the influence of the colonial experience on the development of the African ex-colonies.
Since 2000, a growing literature focuses on the link between colonialism and development. A number of studies have empirically tested this link and for the best clarity I will classify them in three groups according to the nature of the studied colonial determinant:
- The coloniser’s identity: La Porta & al (1998) and Acemoglu & Robinson (2003), among others, find that the coloniser’s identity had an impact on the development path of the ex-colonies through the nature of the legal system imported in the colonies.
- The European settlement: Acemoglu, Johnson & Robinson (2000) show that the type of colonialism (extraction colonialism versus settlement colonialism) had an important impact on the current development of former colonies through the quality of the institutions: the more Europeans settled in a colony, the better the quality of the institutions became, and the more the colony is developed now. - The administrative organisation: Banerjee & Iyer (2002) study the impact of the
colonial rule (indirect rule versus direct rule) on the development of Indian districts. They provide evidence that the districts that were under the direct rule, that is to say directly administrated by the British themselves, have now better economical performances than the districts that were indirectly administrated through Indian landlords’ intermediary. But Iyer (2004) finds on the contrary that the districts under direct colonial rule have significantly lower availability of public goods like schools, health centers ad roads.
In this paper, I want to study the role played by the French colonial public policy in the formation of regional inequalities in the former French West Africa. This is motivated by two underlying questions: first, the question of the relative importance of the colonial experience compared to the pre-colonial history and the geographical factors. Secondly, this problem is related to the long-term impact of public policy in general, in the sense that we are also interested in the more general question of the persistency of discriminations created by public choices.
The paper of Banerjee & Iyer (2005) innovates because the comparison does not concern all the former colonies but the Indian districts only. It is actually quite difficult to make some comparisons between countries that have radically different historical, geographical, cultural backgrounds and, what’s more, radically different colonial history. That is the reason why this paper focuses on the link between colonialism and current development only in a geographically restricted region, the former French West Africa: the region benefits from a
noticeable homogeneity regarding its geographical, anthropological, cultural and historical characteristics. Moreover, the whole region was colonized by only one European country, France, which allows us to avoid the debate on French versus British colonisation. The colonial experience took place at the same period in West Africa, the last quarter of the nineteenth century, and all former colonies attained independence between 1958 and 1960. The comparability between the districts of the former French West Africa is therefore much higher than between all former colonies.
The colonial experience introduced important sources of differentiation between the districts of the former French West Africa. The public colonial policy was indeed very unequal from a district to another regarding at least two aspects: the colonial investments in education, health and infrastructures on the one hand, and the “indigenous policy”, which is the colonial attitude toward local chiefs, one the other hand. The question is whether the colonial investments in public goods and the French indigenous policies in West Africa have had a long-term impact on the regional development paths.
Even if the pre-colonial context was much more homogeneous in the former French West Africa than in the whole former colonial world, we can not suppose that all the areas of the region appeared as exactly identical to the French colonial power, and that differences in colonial policy were totally random. But we can more easily identify the differences between the districts that could have influenced the colonial policy. This is a crucial issue because some districts’ pre-colonial characteristics could have influenced both the colonial policy and the current level of development, making the naïve measure of the impact of the colonial policy on the current development of the districts biased. For example, the French colonial power could have more invested in the richest districts, those which would have anyway reached a higher level of development than their poorer neighbors.
To overcome this potential selection bias, I use a two-steps strategy: first, I try to identify the potential determinants of the colonial policy, which I classify in three groups: the geographical factors, the pre-colonial factors (the level of political and economical development), and some characteristics of the colonial conquest. I have then a first estimation of the impact of the colonial policy on current development controlling for those pre-colonial characteristics. The second step consists in testing the robustness of these first results by using the geographical discontinuities of the colonial policy. Assuming that there are potentially some unobservable characteristics that are not captured by our controls and that these unobservable characteristics are quite similar for border districts, I use (with two different methods) the differences in colonial policy between border districts to identify the impact of the colonial policy on current development.
The data on colonisation used in this paper are original data that I collected in Paris and Dakar. I use first the colonial annual budgets that provide all information on public investments and indigenous policy. These data have been collected at the district level, which was the sub-colonial administrative unit in the former French West Africa. The territory was divided in 8 colonies (Senegal, Guinea, Mauritania, Mali, Upper-Volta, Niger, Ivory Coast and Benin), each one composed of districts (between 8 and 20). Map 1 illustrates this organisation, excluding Dahomey (this colony had to be excluded of the study because of the lack of current data from Benin).
I also collected political data about the pre-colonial history and the colonial conquest of West Africa at the district level. One interest of the paper is therefore the use of long-term historical data at the district level.
Current data about the former colonial districts come from national households surveys of the 1990’s. I compute statistics at the former colonial districts level by matching the
geographical coordinates of the surveyed households’ locality with a colonial district thanks to colonial maps.
The paper is organized as follows: Section 2 provides a description of the current inequalities of development between the former French West African districts. Section 3 will then give a description of the French colonial administrative and financial organisation in West Africa, focusing on the potential sources of discrimination between the colonial districts. Section 4 gives the OLS estimates of the impact of the colonial policy on the current districts’ development controlling for the some geographical, pre-colonial and colonial observable characteristics of the districts. Section 5 introduces a matching method to check the robustness of these results adding controls for some unobservable characteristics of the districts. Section 6 concludes.
2. DESCRIPTION OF CURRENT INEQUALITIES OF DEVELOPMENT IN THE FORMER FRENCH WEST AFRICA
Although West Africa counts among the poorest regions of the world, there is an important heterogeneity between the countries of this region, even between the French-speaking countries. For instance, in 2000, the Ivory Coast’s GNP per capita was four times higher than
that of Niger2. The primary net enrolment rate varied in 1995 from 25% in Niger to 75% in
Benin3. The literacy rate in 1995 amounted to only 13.5% in Niger, around 20% in Mali and
Burkina Faso, 32% in Senegal and Benin, 38% in Mauritania, and reached 44% in Ivory
Coast4. The inequalities inter countries are thus consequent.
But the greatest inequalities in the former French West Africa do not arise at the national level. The inequalities within countries are in fact much higher than the inequalities between countries. Using the national household surveys implemented in West African countries in
the 1990’s, the locality where surveyed households live and the colonial maps5, I computed
statistics on the former colonial districts (called circles) representing their level of development. I retain the development indicators that can be computed for each national
household’s surveys6. They can be classified in two groups: indicators of the human
development, and indicators of the development of the infrastructures. Unfortunately, I could not use any survey for Benin, so this country will not be included in this study.
The objective of the section is to give evidence of the spatial heterogeneity of development of the former French West Africa. It aims also to underline the primacy of the heterogeneity within countries in comparison to heterogeneity between countries. This is partly what legitimates the choice of studying inequalities in West Africa at an infra-national level. Moreover, I want to show that the inequalities between border districts are often significant. This raises the following question: what happened in the districts so that border districts, similar at many levels, had such different development performances? The next sections will try to answer this question. Let us describe inequalities in West Africa first.
I constructed 5 indicators of the districts’ level of development from the national households’ surveys. Two of them are human development indicators, one related to the educational performances and one related to health performances. The three others are indicators of the development of the infrastructures affecting the standard of living of the households in the districts. I will first present some statistics on those 5 development indicators to give the main characteristics of the development of the districts, before focusing on the spatial distribution of those development indicators.
2 Sources : World Bank statistics. The Ivory Coast’s GNP was in 2000 690$ per capita, whereas Niger’s GNP
was 190$ per capita.
3 World Bank Data. 4 Idem.
5 I use the territorial divisions of 1925. At this time, there were 8 colonies and 120 districts (circles) in French
West Africa, 102 excluding Benin’s districts.
6 Senegal: ESAM II (2000). Upper-Volta: EPCV (1998). Guinea: EIBC (1994). Niger: EPCES (1995). Mali:
2.1. Descriptive statistics on the districts’ development
Table 1 presents some statistics on those 5 development indicators, reflecting the average level of development of the French-speaking West African countries and the heterogeneity of the region.
The indicator of educational development is the rate of the 7-12 year old children attending
school at the survey’s time7. On average, 34% of the 7/12-year old children of the districts
are going to school, what is obviously very low. This is consistent with other measures of the educational development, like the literacy rate (18% per district on average) or the rate of having attended primary school at least one year for all the more than 7-year old people (17% per district on average). The dispersion of the rate of the 7-12 year old children attending school across the districts is important as showed by the mean within terciles: only 18% for the lowest tercile, versus 54% for the highest tercile.
The indicator of health performance is the rate of the less than 5-year old children who suffer
from stunting8. I used international standards associated to each age (measured in months) to
calculate the rate of stunting children in each district. A child is said to suffer from stunting if
his height is less than two standard errors under the median height9. The Mauritanian survey
does not contain information about the weight and the height of the children, so Mauritania can not be included in these statistics.
On average, 37% of the children of a district suffer from stunting. The dispersion of this indicator is less important than the dispersion of the other development’s indicators: the standard error amounts to 32% of the mean. The mean by terciles are respectively 24%, 36% and 50%. This represents very high rates. The children health performances are then quite low even in the best tercile. But the inequalities are not insignificant. The lowest rate of stunting children is 7% in the district of Hombori (in the north-east part of Mali). The highest one is 58% in the district of Bafoulabe (in the west part of Mali).
Infrastructures are an important dimension of development so I use three indicators reflecting the level of infrastructures’ equipment of the districts: access to electricity, access to running
water and the type of combustible used for cooking10.
On average, 14% of the households of a district benefit from electrical supplies, 11% have a private water tap (by opposition to public sources of water like fountains or natural sources like streams), and 15% use a modern combustible for cooking (gas, coal or electricity, by opposition to natural combustibles). Once again, this gives evidence of the very low global level of infrastructures’ equipment in the French-speaking West Africa. But the distributions of these 3 indicators are all exceptionally unequal. Their standard errors represent at least 133% of their mean, and there is an enormous gap between the districts of the first tercile and the districts of the third one. As shown by the districts means of the first tercile for each of these 3 infrastructures’ development indicators, the third of the districts of the former French West Africa had yet in the 1990’s almost no electricity, no private water tape and no modern combustible.
7 There are on average 620 7-12 year old surveyed children per district. 8 There are on average 370 less than 5 year-old surveyed children per district.
9 The median of the height for a given age (in months) is calculated from international data, not regional ones. 10 There are on average 450 surveyed households per district.
2.2. The geographical distribution of the development’s inequalities
The question is: how are those observed inequalities geographically distributed? Are we in front of inequalities between countries, between the North and the South, the East and the West? To answer these questions, we can consider the maps 2 to 6, representing the geographical repartition of the districts between the three terciles of each development’s indicator. The districts of the first tercile are light coloured, those of the third tercile are dark coloured. We can see that there are some regional tendencies (“light” areas versus “dark” areas). Concerning the school attendance of the 7/12-year old children, the north-west of West Africa and the south of Ivory Coast are evidently more educated than the rest of the region. Niger appears to be the area that has the highest rate of stunting children. The mean rate of stunting children for Nigerien districts is actually 50%, whereas Guinea’s districts have the lowest mean rate with 29%. Ivory Coast, Senegal and the north-west of Mauritania seem to have better infrastructures than the rest of the region, particularly Niger and Mali. The average share of equipped households is 28% for Ivorian districts and 26% for Senegalese ones, which is much higher than for all the districts (14%). Conversely, the average share is 3.4% for Malian districts and 4% for Nigerien ones. The average share of households using a modern combustible is indeed 32% for the Ivorian districts and 28% for the Mauritanian ones, while only 11% for all districts. On the opposite, this average share amounts to only 2.7% for the Nigerien districts and 5% for the Malian ones. The inequalities of development among the districts are therefore partly a matter of country and of geographical position. But there is also an important heterogeneity between neighbouring districts. We can see that some districts of the first tercile are neighbour of a district of the third tercile. The country or the geographical position is also not all the story. Moreover, there are important inequalities even between districts of the same tercile.
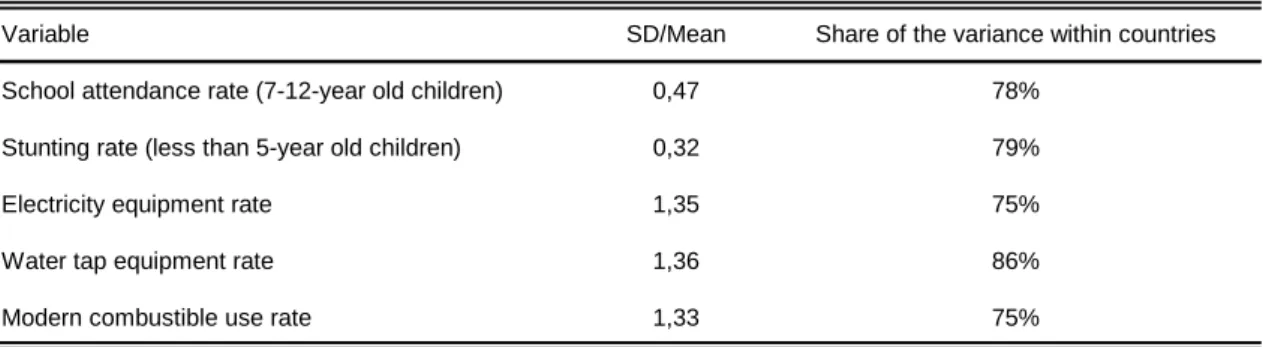
To measure the importance of being in a particular country, I decomposed the total variance
of each indicator in two parts, the variance within countries11 and the variance between
countries12. Table 2 reports the share of the total variance due to the variance within
countries. This makes clearly appear that around 80% of the heterogeneity between districts stands within countries and only 20% between countries. What we have to explain is therefore the inequalities at the district level rather than at the national level.
To conclude, performances are on average quite bad, but there is a significant heterogeneity between the districts. The heterogeneity is more important concerning the development of infrastructures than the educational and health performances. Even if some areas are sometimes more homogeneous, the heterogeneity affects also border districts. The inequalities between districts of a country are always much higher than the inequalities between countries.
What happened to the former colonial districts making such inequalities appear? The potential sources of formation of these inequalities are obviously of multiple kinds. They could be geographical, cultural, anthropological, political, etc. I do not argue to identify all of them, far from it. But I propose to identify some of them related to the colonial history. The next sections will therefore focus on the colonial history and on its potential determinants so as to measure the impact of the colonial policy on the current inequalities between the former colonial districts of the French West Africa.
11 The variance within countries is the mean of the variances of the districts’ values in a country. 12 The variance between countries is the variance of the countries’ means values.
3. HISTORICAL BACKGROUND: THE FRENCH COLONISATION
This section aims to describe the aspects of the French colonisation that could have influenced the formation of the current inequalities in the French-speaking West Africa. It starts with a description of the colonial administrative and financial organisation so as to understand how the colonial policy was framed and financed. Then I will focus on the two main sources of differentiation between districts: the public investment policy on the one hand and the indigenous policy on the other hand.
3.1. The financial and administrative organisation
The French West Africa was officially created in 1895 as the federation of the colonies of West Africa. But the conquest was not yet achieved. The federal government became effective in 1904, and the civil administration took place in the whole territory in the 1900’s and 1910’s. The administrative occupation was then effective in the whole territory from 1910 to 1960. 3.1.1. The administrative organisation
The colonial administration was organised as a pyramid: at the top chairs the General Governor of the federation. Below stands a Governor for each of the 8 colonies. Then we find the districts’ administrators, around 15 per colony. In 1925, the territory counts 120 districts. The largest districts were divided in subdivisions that were also managed by administrators, constituting the fourth level of the pyramid. In 1925, the number of subdivisions (or districts when the districts have no subdivision) amounts to 164. The bottom of the pyramid is occupied by African chiefs. They received from the colonial administration the status of “village’s chiefs” so as to limit their influence to small areas.
In this pyramidal organisation, the effective power was concentrated at the third stage: the districts’ administrators were “the real chiefs of the French empire”. Their tasks were very important: oversee the tax collection, represent the Governor in all official events, count people living in the districts and draw up the map, steer elementary schools, watch the Koranic schools, plan and supervise the building of roads, bridges, wells and tracks, arrest the criminals
and judge them according to the “native population code”13. The official tasks of the African
chiefs were to collect tax, to recruit the workforce for the hard labour and to recruit the military reservists. The number of people to recruit was defined by the district’s administrator. African chiefs were therefore quartered to auxiliaries of the colonial administrators.
The administrative organisation was thus officially centralized but effectively decentralized. The districts’ administrators could manage their policy in an almost independent way thanks to the physical distances and the lack of means of communication. Border districts could therefore have experimented different colonial policies.
3.1.2. The financial organisation
The colonial financial system was based on 3 budgets: the budget of the French Ministry of the Colonies, the French West Africa federal budget and the colonies’ budgets.
The budget of the French Ministry of the Colonies was credited with metropolitan taxes and entirely devoted to the military expenses. The French West Africa federal budget was credited with the customs duties generated by the trade between the federation and the rest of the world. This budget had to cover three expenses: the running expenses of the General Government and
its central services, large-scale public works related to several colonies (railway works for the most part), and subsidies to poor colonies (Mauritania only). Finally, the colonies’ budgets were credited with local taxes. Each colony must then use its own resources so as to finance
the French colonisation. According to the statistics I computed14, 60% of the colonies’ budgets
came from the capitation tax between 1907 and 1930. The direct taxes (the capitation tax, the trading tax, the property tax and later the revenue tax) represent all together 89% of the total colonies’ resources. The cost of colonisation was thus endured by local populations themselves. The local budgets must cover all the expenses except for military expenses and some of the biggest large-scale public works. The central services and the Government of the colony expended 30% of the colony’s resources, so the districts received the 70% remaining. The 70% of the total budget devoted to the districts are divided as follows: 40% for the administration expenses, 10% for the public works, 15% for the education and health expenses (personal and material). The 5% left are miscellaneous expenses. The investments in infrastructures, health and education amounted together to 25% of the colonies’ budgets.
The only development expenses carried out by other budgets than local budgets are some large-scale public works, in particular railway works, paid on the federal budget. This study does not include these investments for two reasons: first, it would have required to collecting the data of the federal budgets in addition to the local ones; second, the federal budgets do not decompose the investments nor at the district level neither at the national level, making their repartition between districts very hypothetical. This exclusion produces actually an understatement of inequalities during the colonial era: the large-scale public works financed by the federal budget were mostly devoted to the main towns and main axes of each colony, which were already advantaged by the colony’s budget. The actual inequalities in infrastructures’ investments were thus probably bigger than measured here.
I will now present the data about public goods’ policy then about indigenous policy, which are the two main aspects of colonial history that could have had a long-term impact on the districts development paths.
3.2. The public goods’ investment policy
The colonial administration invested in three public goods: education, health and infrastructures. How were public goods allocated? How much was expended? Where?
3.2.1. Were the investments determined by the districts’ tax revenue?
The financial resources were collected at the districts’ level then paid back to the local budget. How were they allocated between the districts? The districts brought different levels of tax revenue to the colony’s budget, so they could receive proportional investments. This would imply that richer districts received more investments and vice versa. To answer this question, I calculated the ratio between the share of the colony’s investments received- and the share of the colony’s resources brought by each district (Table 3).
These statistics show that the public goods’ allocation was completely disconnected from the districts’ contribution to the colony’s tax revenue (this would have been the case if the ratio had been near 1). There was thus a very important redistribution between the colonial districts. The correlation between this ratio and the wealth of the districts show that this distribution was neither systematically from the richest towards the poorest nor systematically from the poorest towards the richest. The allocation of public goods in the colonies was thus not linked to the resources of the districts.
3.2.2. What, where, how much?
Concerning the investments in education, the more reliable proxy in the colonial budgets is the number of teachers in each district, which I divided by the population of the district in 1925. Concerning the investments in health, I collected the number of people working in the medical staff and also divided it by the population of the district in 1925. Concerning the investments in infrastructures, I collected the costs of material used for the public works yearly invested in each district, whatever the type of works (roads, wells, tracks, buildings, bridges), and divided the corresponding average over 1907-1930 by the surface of the district.
Table 4 presents the mean of the colonial investments by district. Since Dakar and Saint-Louis were a lot advantaged in terms of colonial investments, I also report in table 4 the mean of the colonial investments per districts without those two districts. The ratio between the standard error and the mean of the colonial investments by districts is a measure of the heterogeneity of the colonial investments. I calculate this ratio without Dakar and Saint-Louis too to have a more realistic idea of the heterogeneity of the colonial investments (the ratio would be much higher with Dakar and Saint-Louis).
We can see that the colonial investments until 1930 were very limited: districts (excluding Dakar and Saint-Louis) received on average only 4.5 teachers and 9 medical workers per 100 000 habitants, 1 school per 10 000 km2. The average annual amount invested in public works (3.3 Francs per km2) seams ridiculous. The colonial investments are moreover very unequally distributed across the districts, particularly the investments in infrastructures.
The geographical distribution of the districts by terciles of colonial investments shows that the investments’ public policy advantaged some regions in the detriment of others. If we look at the maps 7 to 9, it is actually visible that Upper-Volta and the south-east of Niger have been disadvantaged by the colonial human capital investments’ policy. The investments in infrastructures were more concentrated in the coastal areas of Senegal, Guinea and Ivory Coast. This fact could reflect the structure of the colonial economical system, which was based on exportations and importations with European countries.
In addition to these regional discriminations, it is also visible that some neighbouring districts received different colonial treatments in terms of public goods’ investments. The average gap between two neighbouring districts is equal to 5 teachers and 10 doctors, which is big compared to the average numbers of teachers and doctors by districts. The discrimination within close districts adds thus to the discrimination between areas of the French West Africa. To conclude on the colonial investments’ public policy, two characteristics are remarkable. First, there have been only few colonial investments at least until 1930. If I totalize the average number of teachers of every district, I find that there were 700 teachers on average in the whole French West Africa, including a majority of African teachers. Similarly, I find 1 230 persons in the medical staff. This is obviously not insignificant, but the investment effort was not massive. Secondly, these investments were very unequally distributed. The colonial investments’ public policy was thus a source of discrimination between districts. Are the current inequalities linked to these colonial discriminations?
3.3. The indigenous policy
The current development of the districts could have been influenced by a completely different colonial public policy which is “the indigenous policy”. The indigenous policy was the name of the French policy concerning the relationship between the colonial administration and the African chiefs. The French colonisation is often pictured as a “direct rule” colonisation, whereas the English colonisation stands as an “indirect rule” colonisation. In the French empire, the African chiefs actually never kept their entire power on their kingdom, but they were nevertheless less or more associated to the colonial administration, what could have had a long term impact on the development paths of the districts. What was exactly the status of the African chiefs during the colonial experience?
3.3.1. The potential role of the African chiefs
There are at least three channels through which the participation of the African chiefs to the colonial administration could have influenced the districts’ development. First, the participation of the African chiefs could have allowed a better appropriation of the colonial institutions by the African people. It is potentially easier to accept new rules and new ways of living from a political power if the local legitimate chiefs are part of the power than if not. Secondly, the participation of African people in the colonial administration could have facilitated the transmission of the political and administrative power at the independence’s times, even if the position of the African was subordinated to the French power.
Thirdly, the participation of the African chiefs, when those chiefs came from the traditional powerful families, could have prevented the districts from a complete destruction of their traditional political and social structures and thus preserved a political and social continuity before and after the colonial times. But it is hard to know a priori if the chiefs who
participated to the colonial administration had been considered rather as legitimate chiefs15 or
as traitors16 by the populations. In fact both cases occurred.
The participation of local chiefs to the colonial power, even if some aspects are ambiguous, had potentially a rather positive impact on the districts’ development thanks to a better adaptability of the colonial policy to the African population, a better State’s transmission at the independence’s times and the political and social continuity.
3.3.2. The status of the local chiefs in the colonial history
The status of the African chiefs varied during the colonial times. 3 periods can be distinguished. The first period lasted from the conquest to the beginning of the twentieth century. At the earliest times of the colonial experience, several factors encouraged the French administrators to rely on the traditional African chiefs: the administrative employees were too scarce to physically occupy all the territory and it was cheaper to conquest territories by the diplomatic way than by the military way. Many treaties (“protectorate treaty”, “friendship treaty”) were signed between the French officials and the African chiefs. This first period was really an indirect rule period.
From the 1900’s to the 1920’s, the French colonial ideology moved to the famous direct rule. French administrators settled in every district and the African chiefs were exiled or killed when opposing too much resistance to the colonial power. In most of the cases, their status
15 Felix Houphouët-Boigny, baoule chief and member of the colonial administration, became later the father of
the Ivory independence.
16 The chiefs of the Mossi kingdom in Upper-Volta were excluded of the building of the independent State
was reduced to a symbolic and religious status. Their only official role was to help the administrative tax collectors.
After 1920, some influent French colonial ideologists like Henri Labouret and Robert Delavignette and the diplomatic context after the World War I promoted a new attitude towards the local chiefs: no more assimilation but association. The idea consisted in enhancing the status of the African chiefs and in associating them in the colonial administration so as to make profit from their knowledge of the social and cultural environment. The number of European people was still too small compared to the administrative needs, so the association policy was also a pragmatic response to a logistical problem. This change was not yet a revolution: the districts’ administrators could fire any African chief if one of them was not as obedient towards the French power as he should. 3.3.3. Descriptive statistics on the indigenous policy
The association of local chiefs can be measured by the wages paid by the colonial administration to the “indigenous chiefs”. The apparition of these wages coincides with the change in the indigenous policy as a concretisation of the acknowledgement of their new status. Before the reform of the indigenous policy, the local chiefs were indeed classified in the category “Tax collectors” and received only retribution on the tax revenue they collected. After the reform, the African chiefs became a new category of the “Administrative employees” and received a fixed wage in addition to the tax retribution.
But the association policy was not equally performed, first because the reform did not occur everywhere at the same time. Senegal was the first colony to reform in 1912. Benin reformed in 1916, then Mali and Upper-Volta in 1917, then Mauritania in 1918, Niger and Guinea in 1919 and finally Ivory Coast in 1933 (much later than the rest of the federation!). The indigenous policy then differed from a colony to another. But it also differed within the colonies, because the wages paid to the African chiefs of a district depends actually on the existence of African chiefs and on their importance (their lineage, their influence, the size of their territory). If we drop the years when the association policy was not yet implemented, we find that there were on average 9 indigenous chiefs per district and that their annual wages amounted to 16 000 Fr per district. The association policy was then not just a theory! It was also a financial and administrative reality.
To measure the degree of association of the African chiefs, I calculated the mean of the wages paid in each district by year between 1910 and 1930. This measure takes into account the two differentiating factors mentioned above: the time the reform was achieved and the presence/importance of local chiefs. The average annual amount of indigenous chiefs’ wages is 3 500 Fr per district and per year over 1910-1930 (this mean includes zeros for the years with no indigenous chiefs). As the need of African chiefs depended on the number of people living in the district, I divided the average amount of wages paid to African chiefs by the population of each district. Results show that the district paid on average 42Fr per 1 000 capita to the local chiefs. This variable is a lot dispersed because its standard error represents more than 200% of its mean. The mean by terciles are respectively 0.4, 6 and 120 francs per 1 000 capita. The differences between districts are thus very significant.
The geographical distribution of the association policy (Map 10) shows that the local chiefs had been more associated to the colonial administration in Senegal, in the Saharan districts, in the Fouta-Djalon and in some of the Upper-Volta’s districts. Senegal, Upper-Volta and Fouta-Djalon were occupied by important African kingdoms before the French occupation. One of the determinants of the indigenous policy might then have been the presence of influent pre-colonial chiefs in the districts.
To conclude on the investments’ and indigenous policy, the colonial budgets’ data give evidence that both were sufficiently unequally distributed to allow us to think that they may have played a discriminating role in the districts’ development paths.
The point is now to test and measure this potential role. This would be easy if the colonial policy had not been influenced by any characteristics of the districts. But it is false that the colonial public policy was totally random. That is the reason why I will present in the next section the pre-colonial districts’ characteristics, more precisely those which could have had an influence on both colonial public policy and development path. This is in fact those characteristics that could bias the measurement of the impact of the colonial policy on the districts’ long-term development.
4. ESTIMATES OF THE IMPACT OF THE COLONIAL PUBLIC POLICY CONTROLLING FOR OBSERVABLE CHARACTERISTICS
The objective here is to identify the impact of the colonial public policy on the current development of the former colonial districts. Since the distribution of the colonial public investments and of the indigenous policy was probably linked to some districts’ characteristics that could also have played a role in their development path, the first method proposed in this section consists in calculating OLS estimates controlling for the observable characteristics of the districts at the beginning of the colonial period.
4.1. The observable characteristics of the districts
As I said in the introduction of this paper, the great advantage of limiting the study to a geographically restricted area is that the historical and geographical characteristics are right away much similar. The sources of variation are thus much fewer and easier to identify than at the worldwide level.
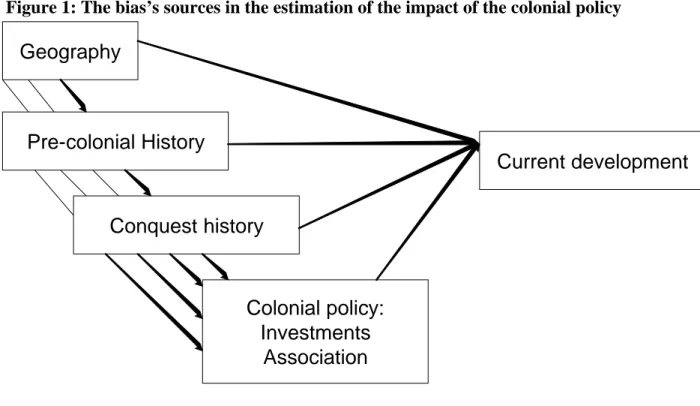
The purpose here is to identify the potential determinants of both the colonial policy and the development path of the former West African districts. These potential determinants can be classified in three groups: the geographical determinants, the determinants related to the pre-colonial history and those related to the pre-colonial conquest history. I actually consider the conquest history as the expression of some intrinsic characteristics of the districts which made them more or less attractive for the Europeans, and more or less reliant facing the colonial power. Figure 1 presents a brief formalisation of the underlying problem.
Figure 1: The bias’s sources in the estimation of the impact of the colonial policy
Geography
Pre-colonial History
Conquest history
Colonial policy:
Investments
Association
Current development
What follows presents the variables I collected that constitute the observable characteristics of the districts. All of them are at the district level. Some of the data are original ones. The data sources will be presented in time.
The geographical characteristics of the districts are obviously some important determinants of their development path, because they condition the fertility of the soil, the severity or mildness of the climate, accessibility of water, etc. The colonial policy could also have had some geographical determinants because European people could have preferred some areas for their climate, their proximity of the coasts, etc. I thus collected some basic information on the geographical characteristics of each district:
-The altitude of the main town of the district17
-The average latitude of the surveyed households of the district18
-The average longitude of the surveyed households of the district19
-The average annual precipitations in the main town of the district over the 1910-1970 period20
-A dummy for coastal borders21
-A dummy for important rivers18
4.1.2. The pre-colonial history
As an introduction, let us look at the basic characteristics of the whole region itself: at the end
of the nineteenth century, the future French West Africa is a vast territory of 4 800 000 km2
occupied by a scarce population of around 12 000 000 people22. The density was therefore
around 2.5 people per km2 only.
The pre-colonial development of the districts may have had an influence on the colonial policy (and the development path obviously). The colonial policy could actually have been oriented in favour of the more profitable districts (you need to remember that colonisation was partly motivated by economic profitability). The pre-colonial economic context has then to be taken into account. The political context could also have influenced both the colonial policy and the districts’ development paths: the association policy towards the indigenous chiefs could have been easier to build in the districts where important and influent chiefs were in place than in the stateless districts. The existence of a centralized political power could also have encouraged the colonial administration to make more investments according to the fact that those investments were perhaps more profitable in this case, as shown by Geneaioli & Rainer results23.
Information on this period was difficult to collect at the district level so I limit the proxies of the pre-colonial characteristics to a proxy of the political context, a proxy of the agricultural context and a proxy of the commercial context.
a. The political context
The pre-colonial political context can be synthesized in a simple picture on which there are two types of districts: those under a centralized political power (state societies) and those under no
17 I use information from the website rainingfall/directories of cities and towns in the world. 18 I use information from the website rainingfall/directories of cities and towns in the world. 19 I use information from the website rainingfall/directories of cities and towns in the world. 20 I use information from a database created by ORSTOM.
21 I use the 1925 colonial official maps, “Atlas des cercles de l’AOF”, Service géographique de l’AOF,
Gouvernement général de l’AOF. These maps can be found at the Documentation Française in Paris.
22 This corresponds to the French West Africa’s population around 1910. I calculated it from the censuses made
by the districts’ administrators between 1906 and 1912. These censuses are available at the National Archives in Paris.
23 Nicolas Geneaioli & Ilia Rainer, On the costs and benefits of political centralization : a lesson from African
centralized political power (stateless societies). Map 1124 indicates the identified kingdoms at the end of the nineteenth century. Some of them, like the States of Samory, can not be considered as centralized political power states because of their instability and/or youth.
I constructed a dummy for the presence of a pre-colonial centralized political power (kingdom,
empire etc.), using several historian documents25 to determinate the “state” and the “stateless
districts”. A district is classified as a “state district” if it sheltered an identified kingdom which was not too much recent (I reject the states appeared after 1850).
b. The agricultural context
West Africa was at the end of the nineteenth century a quasi-total rural area. The towns were scarce and very small: the 5 biggest towns were Saint-Louis (around 24 000 habitants), Dakar (18 400), Rufisque (12 500), Conakry (8 200) and Cotonou (4 400). Since these figures come from censuses of the 1900’s, these towns were actually smaller at the end of the pre-colonial era. The quasi-totality of the population was then rural. That is why the “agricultural development” is the most important dimension of the economic development.
The agricultural development can be measured indirectly by the density of the population in
each district around 191026. I constructed this variable from the censuses of the colonial
districts present in the French West Africa archives (série G, sous-série 22). The average
density of the French West African districts around 1910 amounted to 6.7 habitants per km2.
But the density was obviously not equally distributed: the average densities by terciles are
respectively 1, 4 and 14 habitants per km2. The pre-colonial agricultural development was
concentrated in 5 places: on the right side of the Niger Loop, on the coastal areas of Senegal, Guinea and Ivory Coast, and in the forest area of Guinea.
c. The commercial context
Local trade existed all over West Africa thanks to the Dioulas, an ethnic group of travelling retail traders. The Dioulas were (and are still) present on the whole territory, but I have no statistical information on the intensity of the commercial activities by district. Besides these local trade activities, there were some very important trade areas: the European trading counters. These trading counters had created real discontinuities in the levels of development in West Africa. That is why I simply constructed a dummy variable indicating the existence of a European counter or not.
4.1.3. The French conquest characteristics
The conquest history lasted as long as the pre-colonial political structures were still intact. This crucial period gives us much information that may be related to the colonial policy and the long term development of the districts. The characteristics of the colonial conquest could be indeed the expression of some intrinsic characteristics of the districts which can make them more or less attractive for the French power and more or less inclined to develop. I therefore collected data on the colonial conquest at the district level and constructed 5 variables.
a. The year of the colonial conquest’s beginning
The year of the colonial conquest’s beginning is defined as the year of arrival of the first military troops in a district. It varies from 1854 for some Senegalese districts to 1903 for the district of Agadez (Niger). The colonial expansion began from the west of the region, the Senegalese and the Guinean coasts. The military troops went then in the east direction as far as
24 From the “Atlas des peuples d’Afrique”, Jean Sellier, La découverte, Paris, 2003, p.104.
25 Suret-Canale (1964); Bouche (1998); Boahen (1989); Coquery-Vidrovitch, & Moniot (1993), Chailley (1968). 26 This is the earliest period we can consider according to the available census data.
the middle of the current Mali. A third attacking column went from the south of Ivory Coast to the north and joined the first two columns in Mali. Then a fourth column progressed from this point towards the east as far as the Tchad Lake, joined by a fifth column progressing from the Benin’s coasts towards the north. Between the start and the end of the colonial expansion, 50 years have passed. This makes a big difference in comparison to the length of the colonial era itself. I collected this data at the district level using the French military archives: Duboc (1939), Deloncle (1934).
The time the districts were invaded could have mattered in their future history. It could first have influenced the colonial policy because the earliest conquered districts could have been advantaged in comparison to the latest conquered ones due to the fact that the colonial power settled sooner, so potentially invested more. But the year of the colonial conquest’s beginning may also be linked to the development path of the districts because it can reflect some geographical characteristics like enclosing, or some economic potentialities explaining their attractiveness for the Europeans.
b. The resistance of the African people
The resistance of the African people against the colonial power may also be a determinant of the colonial policy as well as the districts’ development. One the one hand, resistance could have had an impact on the volume of the colonial investments, playing the role of rewards and punishments. On the other hand, resistance was probably the expression of some cultural, anthropological or political characteristics of the districts which are obviously determinants of their development.
I collected two dates to measure the length of the resistance (Crowder (1971), Deloncle (1934), Duboc (1939), Ki-Zerbo (1978), Suret-Canale (1964)): the year of arrival of the French military troops and the year of the last military intervention for the pacification of each district. The difference between these two dates defines what I call the length of the districts’ resistance. I find an average resistance of 22 years, which is much longer that we are used to be told about colonial history. But the variations of the resistance’s length are quite important: the standard error of this variable is equal to 15 years. In some areas (the district of Indénié (Ivory Coast), the former Europeans trading counters), no resistance was opposed to the colonial power, whereas the resistance lasted 74 years in the district of Adrar (in the north of Mauritania). The Nigerien districts opposed on average less resistance than the other parts of West Africa, as The Mauritanian districts are almost all in the superior tercile of this variable. c. The former African chiefs’ fate
The African chiefs had various reactions facing the colonisation: some of them accepted to sign friendship or protectorate treaties as others resisted and took the arms. Two polar situations can be distinguished: the districts whose traditional chiefs were killed or exiled on the one hand and those whose chiefs dealt with the colonial power on the other hand. This can be measured with an item of the colonial budgets: “former chiefs’ indemnities”. These indemnities were attributed to the chiefs who accepted the primacy of the colonial power. I consider then the amount of chiefs’ indemnities in each district as a measure of the collaboration between the pre-colonial and the colonial power.
The degree of collaboration between the pre-colonial and the colonial power could have influenced the colonial policy, especially the indigenous policy. In the 1920’s, when the idea of association with the African chiefs was adopted by the colonial administration, it may have been easier to recruit traditional chiefs in the districts where former chiefs had collaborated than in those where they were killed or exiled. The collaboration between traditional and colonial power may also reflect some characteristics of the political or cultural context of the districts, characteristics potentially linked to their development.
d. The European settlement
Another pre-colonial observable characteristic of the districts is the number of Europeans in 1910. 1910 is the end of the pacification and the beginning of the colonial era so the European settlement at this time is not yet the result of the colonial policy. The European settlement may have been the expression of the attractiveness of the districts as well as a determinant of the colonial policy, because the colonial administration may have more invested where Europeans were numerous.
In West Africa, very few Europeans settled in comparison to other colonies like Australia, Canada etc. In 1910, European people represented on average 0.2% of the districts’ population, that is to say 68 Europeans in each district. But the dispersion of this variable is very important: the means of the number of Europeans in the district by terciles are respectively 5, 16 and 186 Europeans. Differences are thus significant.
e. The development of modern economical activities
The early development of modern economic activities is also an expression of development potentialities of the districts: the districts where modern economic activities appeared early had potentially some positive characteristics that other districts did not have, and were potentially more attractive for the colonial investments.
The measure I use is the amount of the trading tax collected in 1914 in each district. The trading tax was introduced few years after the settlement of the colonial administration. This tax concerns all secondary and tertiary activities. The tariffs of the trading tax depend on the nature of the commercial activity and the number of employees of the firm.
The average trading tax collected in 1914 in the districts amounts to 30 cents per capita. The standard error of this variable represents 200% of its means. The means by terciles are respectively 0.2, 6 and 83 cents per capita. Dakar and Saint-Louis are far from the other districts with respectively 370 and 390 cents per capita.
All these characteristics are serious sources of endogeneity of the colonial policy and thus must be taken into account to identify the impact of the colonial policy on the current development. 4.2. The empirical strategy
The outcomes that I want to explain are those presented in section 2. The data is at the district
level and comes from national households’ surveys27. The 5 dependant variables are:
-The rate of more than 7/12-year old children attending school -The rate of less than 5-year old stunting children
-The rate of households equipped with electrical supplies, -The rate of households equipped with a private water tap and -The rate of households using a modern combustible
I want to identify the impact of the investments’ and indigenous policy on these outcomes. Our explanatory variables of interest are those presented in section 3:
-The average annual number of teachers per 100 000 capita -The average annual medical staff per 100 000 capita
-The average annual amount of public works per km2
-The average annual amount of the African chiefs’ wages per 1 000 capita
27 Senegal: ESAM II (2000). Upper-Volta: EPCV (1998). Guinea: EIBC (1994). Niger: EPCES (1995). Mali:
Concerning the impact of the investments’ policy, what interests me more specifically is the impact of the colonial investments in education on the educational performances, the impact of the colonial investments in health on the health performances and the impact of the colonial investments in infrastructures on the infrastructures’ development. The correlation between the different types of colonial investments is high, particularly between investments in education and investments in health. I will therefore measure the specific impact of a given colonial investment by controlling for the other colonial policies (other colonial investments and indigenous policy). To isolate the impact of the indigenous policy on the current performances, I also use the colonial investments as controls.
I also include another control reflecting the wealth of the districts during the colonial period: the individual tax burden. It is actually clear in the budgets that the taxation rate, which was the same for all inhabitants of a district, was calculated according to the relative wealth of the district. This measure of the wealth of the districts is then dependent on the perception the administrators had of it, but it is nevertheless an interesting proxy of the relative wealth of the districts.
The section 4.1 has underlined the endogeneity of the colonial policy: some determinants of the colonial policy are also determinants of the districts’ development. The estimators of the naïve regression of the current development on the colonial policy would then be biased. Nevertheless, I do not use an instrumentation strategy. This would have implied to find a variable correlated to the colonial policy and not to the current development. A good candidate was the educational level of the districts’ administrators. It is indeed plausible that the education’s level of the administrators influenced their financial and administrative decisions. Moreover, this variable may be not correlated to the districts’ characteristics because the administrators were affected to their district almost randomly. The federal Governor affected pragmatically an available administrator to an available district. The quality of the administrator thus did not influence the place he commanded. But the administrators were in charged only two or three years in a district. The accumulation of different administrators would then make uncertain and difficult to use the quality of the administrators as an instrumental variable for the colonial policy. As Acemoglu, Johnson and Robinson (2000) use the European mortality rate as an instrument of the European settlement, I collected the mortality rate of Europeans in each districts to instrument the colonial policies (that are in fact correlated to the European settlement). But the number of Europeans living in each district is too small to have a representative mortality rate. The quality of this variable is then very bad and this instrument can not be used.
I thus use an OLS regression of the outcomes (Y) on the colonial policy variable of interest (CP), controlling for the other colonial policy variables (OCP) and the variables which represent endogeneity’s sources of the colonial policy: the geographical (G), pre-colonial (PC) and conquest (C) variables.
Yi = α + βCPi + χOCPi + δGi + φPCi + γCi + ui (1)
Our coefficient of interest is thus β. This equation will be estimated with 100 observations (99 when the average colonial medical staff is in the specification).
4.3. OLS estimates of the impact of the colonial public policy
Each dependant variable is regressed on the colonial policy’s variable of interest, adding progressively the different groups of control variables. The last regression entails all control variables and is performed twice, one time ordinarily and one time with the reduced variables (the variables divided by their standard error). I report the two coefficients so that the size of the impact can also be interpreted in terms of percentage of standard error’s variation.
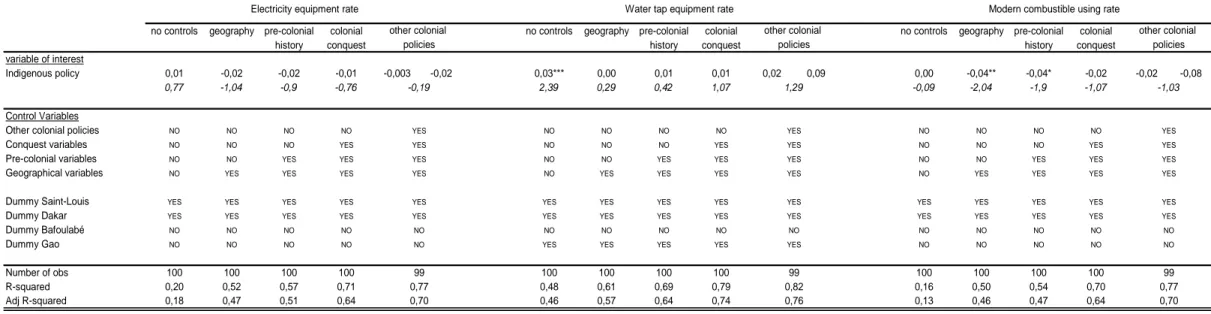
Table 5 and 6 report the results on the impact of the indigenous policy. As shown in table 5, the districts where African chiefs were more associated to the colonial administration have significantly better educational performances and worse health performances, all other things being equal. One standard deviation of the wages paid to the African chiefs would have generated an increase of 0.2 standard deviations in the school attendance rate and in the stunting rate as well. The table 6 shows that the association of African chiefs besides had no significant impact on the development of infrastructures. These results indicate that the association of African chiefs in the colonial administration had actually an ambiguous effect on the human development. It made the colonial investments in education more profitable but reduced the efficiency of the colonial investments in health. The African chiefs working in the colonial administration should thus have promoted the use of the educational equipment but discouraged the use of the medical one. The fact that the role of the African chiefs is limited to the educational and health performances indicates that education and health are partly influenced by the cultural and political environment, whereas the development of infrastructures is more a matter of physical investments.
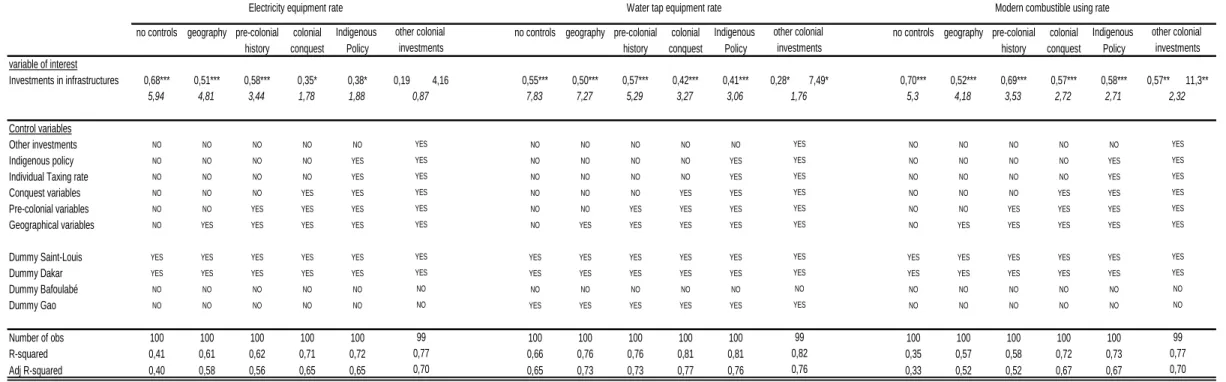
Tables 7 and 8 report the results on the impact of the colonial investments’ policy. It is clear that the districts which received more colonial investments in education have today a higher school attendance, those which received more colonial investments in health have today a lower rate of stunting children and those which received more investments in public works have today more infrastructures (except for electricity supply when the other colonial policies’ controls are included). The size of the impact of the colonial investments is important in terms of human development: one standard deviation of the number of teachers in the districts would have produced an increase of 0.44 standard deviations in the school attendance rate and a fall of 1.28 standard deviations in the rate of stunting children. But the impact of the colonial investments is particularly important in terms of infrastructures development: one standard deviation of the amount of the colonial public works would have generated an increase of 7 standard deviations in the water tap equipment rate and 12 standard deviations in the modern combustible using rate.
The colonial investments in public goods have then played a strong discriminating role among West African districts. More precisely, the early colonial investments played a discriminating role (our measures are limited to 1907-1930). 60 years later, the impact of the public investments’ policy is still perceptible. Another interesting result is that despite a long time passed, all the colonial investments are not equivalent: there is still a specific impact of the educational investments on the educational performances, all other investments being equal, and the same is true for the investments in health on health performances and for the investments in infrastructures on infrastructures development.
We can finally notice that the geographical, pre-colonial and colonial characteristics observed in this paper explain between 60% and 80% of the current districts’ performances. The colonial public investments and the indigenous policy together explain 12% of the stunting rate, 32% of the school attendance rate, and around 40% of the electricity, water tap and modern
combustible equipment rates (R2 calculated without the outliers in the sample). The colonial public policy has thus been a strong determinant of the districts’ development paths.
The inconvenient of using control variables is that we can not be sure that we control for every sources of endogeneity of the colonial policy. These results might reflect omitted variables. That is why I develop further methods to check their robustness.