HAL Id: hal-01064964
https://hal.archives-ouvertes.fr/hal-01064964
Submitted on 17 Sep 2014
HAL is a multi-disciplinary open access
archive for the deposit and dissemination of
sci-entific research documents, whether they are
pub-lished or not. The documents may come from
teaching and research institutions in France or
abroad, or from public or private research centers.
L’archive ouverte pluridisciplinaire HAL, est
destinée au dépôt et à la diffusion de documents
scientifiques de niveau recherche, publiés ou non,
émanant des établissements d’enseignement et de
recherche français ou étrangers, des laboratoires
publics ou privés.
A Simplified Model to Include Dynamic Product-User
Interaction in the Eco-Design Process The Paper Towel
Dispenser Case Study
Livier Serna, Alexandre Popoff, Dominique Millet
To cite this version:
Livier Serna, Alexandre Popoff, Dominique Millet. A Simplified Model to Include Dynamic
Product-User Interaction in the Eco-Design Process The Paper Towel Dispenser Case Study. Journal of
Industrial Ecology, Wiley, 2014, 18 (4), pp.529-543. �10.1111/jiec.12160�. �hal-01064964�
A simplified model to include more precise product-use dynamics in the product
eco-design process: The paper towel dispenser case study
Livier Serna-Mansoux, Alexandre Popoff, Dominique Millet
LISMMA, Ecodesign& Optimization of Product Research Team USTV/SUPMECA Toulon, 83000, Toulon, France
EcoSD association (www.ecosd.fr)
Abstract
For many modern products, the use phase is intensive and poses a serious environmental impact because of the energy consumed, as well as consumable resources. This could be resolved by optimizing the product environmental impact, and notably by improving the understanding of the users’ relationships with it. In this work, we propose a model framework that can be used to include the sustainable use phase and its eco-driven strategies in the environmental im-pact analysis of a product via the LCA. We propose the recognition of the dynamical, changing nature of product-user interactions in time. An indicator designated ”Mitigation Rate” of an eco-strategy is proposed to assess environmental impact of a product. This ”Mitigation Rate” acknowledges the loss in performance of eco-feedback strategies through time, enabling a more pertinent consideration of eco-feedback evolution from the beginning. It presents a methodol-ogy to understand and build different alternate models, and a case study where 4 alternative models are constructed and compared.
Keywords: Eco-design, environmental impact in product use, life-cycle assessment, sustainable behaviour, Mitigation coefficient.
1. Introduction: on product use and life-cycle assessment
As the use phase receives more attention in the analysis of environmental impact of products, the ecologically friendly product (eco-product) design needs new tools to include this dimension in its methodology. On the one hand, Life Cycle Analysis (LCA) has been the most widely spread tool to analyse product impact, even considering the difficulties related with its correct application. A thorough overview of its latest evolution can be found in Finnveden et al. (2009) and Hauschild et al. (2005). Nevertheless, the impact of the use of a product has not been quite considered to that degree of detailed calculation. We can find examples of this kind of eco-design advances in Cerdan et al. (2009), Maxwell and van der Vorst (2003), Michelini and Razzoli (2004), Nissen (1995), and Yang and Chen (2011), Kaebernick et al. (2003). As has been pointed out by Hauschild et al. (2004), if the product has been design to have low impact in manufacturing but consumes high levels of energy during use, the point of environmentally friendly design has been lost.
On the other hand, the user-centred design strategies have traditionally considered the adaptation of product archi-tecture as well as the implementation of feedback strategies to induce a correct use of the product in environmental terms. As it will be seen in the next section, ecological approaches remain limited.
The environmental impact of products has traditionally been understood as derived mainly from the phases of life-cycle related to material transformation and transportation. Inclusion of the use phase has normally been done as part of a greater checklist of criteria, with no particular highlight, such as in Vezzoli and Sciama (2006) and Waage (2007), Herrmann et al. (2005), Herrmann et al. (2007). It has increasingly been proven though, that the use-phase of products has an important role as well. Typical cases such as the shower faucet and the light bulb have been already spotted and undergone several adaptations to prevent water and energy over-consumption. Cases in other type of products can be found in Verbong et al. (2012) and Ornetzeder and Rohracher (2006).
Not only in terms of energy and resources consumption, but also in the production of by-products such as discarded packaging, or polluting materials. The central key to the understanding of the use phase importance lies in the
recognition that the main function of a product is to relate human beings to their world. In viewing the product as an agent in service of a certain ”user”, it becomes pertinent to design environmentally friendly products from the use phase and outwards to the rest of the life cycle phases
In spite of this, the simple adoption of user-centred approach when eco-designing products is not as straight for-ward as it seems. Since the use phase of a product is when individuals relate to the product the most, all the complexity of a human being becomes a relevant issue to take into account. Using a product implies not only the functional as-pects, but also the aesthetic and the symbolical. A product, when used, becomes not only the medium through which people achieve simple purposes (contain materials, transform food or drink, or enhance physical force, etc.), but also serves as an instrument of the human imagination. Several recent authors, such as Norman (2004), Krippendorff (2006) have reminded product designers this. Classical ones, such as L¨obach (1976) had already established reference basis.
Moreover, the different relationships users develop with the products they manipulate is not static, but changes in time, obeying to the dynamic nature of human behaviour, needs, habits, and skills, as works such like Vallette (2005) demonstrate.
Understanding the energy consumption of a product, for example, requires the understanding of the use phase and the particularities of the user-product interaction. Energy-saving features only work if people use the product as intended. Therefore, design strategies focusing on energy-efficient usage of products are likely to complement technological solutions, derived from engineering disciplines.
In specific terms, when addressing the environmental impact, the practical analysis of the use phase has become a challenge. In broader terms, the Life Cycle Assessment (LCA) method has been used to calculate impacts on the environment. It considers all the phases a product passes through to exist and then to be discarded. In Section 2 and 3 the general characteristics of the LCA are recalled.
Let it just be noted in this introduction that the traditional LCA considers the use phase as a fixed pattern that is not necessarily realistic. To illustrate this, we consider the example of car emissions. These are measured following the New European Driving Cycle (NEDC) in conjunction with the Emission Directive 98/69/EC (Gruden (2003)). The measurement consists of a set of 4 short cycles aimed at simulating a City driving cycle, and another longer cycle aimed at simulating an Extra Urban Driving Cycle. The total time of test is 1180 seconds and around 11 kms. This is multiplied by the total time expected for the car to run. Yet in reality, nobody drives at the same speed and under the same climate conditions all the time, and thus the approximation calculated can be deceiving.
In products in which energy and/or resources consumption is an important feature, special attention must be made to understand the different scenarios of use, and the different ways a product can be understood when addressing environmental concerns. Use, as opposed to other phenomena, cannot be calculated by means of average values. It involves change in different dimensions. And in this work, we will address change in time for user-product interaction. Our focus is the sustainable use. This is, the use of a product so that its impact on the environment can be minimized as much as possible. In order to achieve this, products usually integrate some kind of information exchange so that the user can learn to use the product in a way that will impact the less. In section 2 different ways to integrate this information exchange are revised. We then propose a model framework to explore these alternatives and guide decisions in eco-product design. The model framework is explained in Section 3, while Section 4 shows a case study to implement this model and prove its use. The case study is a paper-towel dispenser, and four alternatives are analysed. We then conclude in Section 5 with our discussion and further perspectives of study.
2. User-centred eco-design strategies, from technological to behavioural approaches
The ecological impact of use, when using the LCA, is approached in a non-realistic, simplified way. This can be understood from several points of view. It can be understood as a result of LCA being developed and further improved mainly within technical disciplines, such as mechanical engineering. This results in overlooking the human-product interaction part of the product, and how this actually contributes to overall impact. It can be further added that communication between technically driven ecological design and user-centred design is not common. Other reasons may come from the dramatical increase in data gathering technologies, yet not in data interpretation. While the inclusion of adaptive capabilities in products is growing, the uncertainties and dynamics of the user environment are also increasing. In facing the complex problem, practical analysis tends to keep to the minimal risk, thus reducing
the potential of innovative solutions. Finally, it can be understood also as a problem of expertise, as exposed by Millet et al. (2007), who recommends the LCA to be used in the development of new concepts for strategic evaluation purposes.
2.1. From user free-will to product cohersion
Eco-strategies that focus in the use phase of the product life cycle are limited, yet advancing rapidly. This could be viewed as the result of the extensive research that has been made from both side of the spectrum: on one side, the environmental assessment of products, on the other the user-production interaction.
Behaviour-driven design has understood for a time the different stages of interaction of a user with a product. Lilley (2009) has presented a comprehensive classification of them, by using the criterion of where the power of decision is (Figure 1). In the level ”eco-feedback”, the power of decision is entirely on the user side. The user decides to act (or not) upon the information received from the product about consumption. Examples of ”eco-feedback” are the notices and labels that inform users about how best to use the product. If positioned in the level ”behaviour steering”, there is more than just information flowing to the user. The product has specific components or features that facilitate or encourage a correct use (environmentally friendly in this case). Very simple examples of this are computers offering the possibility to regulate energy consumption by choosing to switch of the screen after a certain time, or in toilets with two flush modes, using more or less water. Finally, if positioned in the level ”persuasive Technology”m then the user looses liberty and power of decision. The product is configured in such a way as to only work in the conditions intended. This, according to Lilley, guarantees a change of behaviour. Examples are lights in a room that switch off automatically as well as so called ”intelligent” systems whose sensors work without the users’ direct control. Work by Wever et al. (2008) has also focused on these kinds of interactions, but levels increase to four: ”functional adaptation”, ”eco-feedback”, ”scripting”, and ”forced functionality”. The last three could be coupled with Lilley’s, while the ”functional adaptation” approach envisions the design of a product that would adapt to whatever function the user needs. This, in simple products can be achieved, yet becomes a complex problem in products with potential by-uses (such as smart-phones, which are used for many things others than call other people on the phone). Another useful approach, although not directed to eco-design, is made by Lockton et al. (2010) and King and Tester (1999). The former propose a design method centred on user behaviour, and aiming at achieving a product use in real life that would match the intentions of the development team. The latter present a general overview of what persuasive technology can do to influence behaviour.
We could say that in the feedback scope (in which the ”eco-feedback” falls) a lot has been done, yet not always from an environmental point of view. This richness could be because information can be conveyed to the user by several ways, mostly without reconfiguring the product. Nevertheless, one of the drawbacks of this is that the focus of these works is usually on consumer or the buyer, and not necessarily addressing the problems related with daily use. Interesting studies on perception have been: Goggin (1994) has studied the perception of eco-labelling, while Park and Tahara (2008) have tried to go further in the assessment of eco-design issues by focusing on the perceived quality and eco-efficiencies of consumers. Zai and Williams have studied the consumer acceptance of photovoltaic sources of energy, aiding in the design of strategies that could lead to easy adoption of environmentally friendly technologies Zhai and Williams (2012). Ornetzeder and Rohracher (2006) present a useful overview of different cases where users have been involved in the development of sustainable energies. Park et al. (2007) have studied the effect of eco-efficiency on value perception of digital cameras.
Specifically addressing use, studies that acknowledge the need of a follow-up to improve products (yet not for environmental performance improvement) can be found in Abramovici and Lindner (2011). Bonner (2009) reports insights on the relations between the user and home technology. Involving users in innovation is discussed by Peine and Herrmann (2012).
On the other levels, that involve some kind of product configuration modification, specific studies are more on the side of the companies, and thus academic reports remain limited. Yet, it can be said with relative confidence that one issue is still pending: how interaction between user and product changes in time.
3. A model to explore different eco-design strategies integrating Life Cycle Analysis
As seen in the sections before, the interaction between user and product is not something fixed, but a dynamic process. It is always changing and the assumptions made in the preliminary phases of product design (regarding use)
Figure 1: Strategies from designing sustainable behaviour. (* Lilley (2009), **Fogg (1999), ***Wever et al. (2008))
not always turn to be true. The need for a product that can adapt in time, when circumstances of use change, is more and more evident.
On the other hand, the life-cycle of a product, as stated, have been traditionally analysed considering an ”average” use, which is constant in time and not representative of reality. In products whose use phase impacts the environment in a significant way, this can result in a distorted life-cycle assessment.
Our hypothesis is that a model can be built to include the evolution of a user-product interaction in time for ecological impact calculations.
We propose the Dynamic Eco-strategy Explorer Model (DEEM) that can aid making strategic decisions in terms of the projected use of a product. Specifically, the model has the main objective of helping product development teams when designing environmentally friendly products. This help concerns the strategies to be used to achieve this environmentally friendly use and the ecological impact they would have. It has been discussed previously that eco-strategies have a limited life span. The DEEM can explore the different scenarios for the different eco-strategies considered, piloted by a criterion called Mitigation Rate, which will be explained in the subsequent subsections.
The DEEM is closely linked with the life-cycle analysis (LCA) as it will be seen. It approaches it to scenarios of use that could reflect real changes in time for the use phase. In order to calculate the necessary life-cycle analysis (LCAs), the software chosen is SimaPro (Goedkoop et al. (2010)). On the other hand, to assess the impact, a single-score method is used: the Eco Indicator 99 ( Goedkoop and Spriensma (2001)). It considers impacts on human health, as well as on ecosystem quality and resources. The Eco Indicator 99 calculates a single score that, although relatively controversial, facilitates the rapid comparison between different product/process alternatives.
3.1. Building DEEM
To construct the DEEM, we consider a global Life Cycle Analysis (LCA) calculation that takes in account the product and the consumed materials in use. It implicates in the calculations the LCA for the impact of the product’s components, the life time of the product, the Mitigation Rate for the eco-strategy, which in turn affects the quantity of any material associated with the use of the product (for example, the paper towels used in a paper towel dispenser); and the LCA of the functional unit of this material consumed in use. The formulation considered is:
GLCA= Lcap+ [LcaC∗ Cre f ∗ Nu∗ Ny∗ MR] (1)
where
GLCAis the Global LCA for the product considering the strategy,
LCAp is the LCA of the product, including any extra components added to achieve the eco-strategy, as well as the
energy consumed is the strategy considers a product modification that consumes extra energy
LCAcis the LCA of the material or resources consumed (the consumables) during use by means of the product,
MRis the Mitigation Rate,
Cre f is the Reference Consumption of the consumables per year, per user, Nuis the number of users considered, Nyis
3.1.1. Mitigation Rate
The Mitigation Rate (MR) is a projection of the performance of an eco-strategy in time. It considers an exponential
decrease regarding the eco-strategy’s success in promoting a environmentally friendly use. The MR is an evident
necessity when the eco-strategy leaves the decision power on the user’s hands (see 2.1. Nevertheless, even forced-functionality eco-strategies might loose its efficacy in time. The aim of the projection of the MR is to understand
how different eco-strategies might affect the environmental impact derived from the consumption of resources by the product (e.g., electricity) or any material that is associated with the use of the product (e.g., paper towels for a paper towel dispenser). This impact is not only related with the MR, but also with the global LCA of the product.
The projection of the MRenables the development team to know the performance needed for the eco-strategy to be
worth in environmental terms. It helps decide up to what point an eco-strategy that involves investment in product modification needs to be effective, or how efficient an eco-strategy based on the modification in the information flow needs to be.
The MRcalculation is not a fixed value that works for all cases in all circumstances. It is calculated with several
variables open to modification by the team, as will be explained. The equation used is,
MR =
Z T t0
1 − (1 − It0)e(CMR)T (2)
where
It0is the projected improvement (in relation with conditions before the eco-strategy is implemented) in consumption
levels (reduction of consumption) of consumables thanks to the implementation of the eco-strategy at time 0, CMRis the Coefficient of Mitigation Rate in eco-strategy performance,
T is the set of numbered segments in which the projected use life of the product is divided.
The calculation give out a series of data that can be graphed. It must be noted that the period of time in which the eco-strategy works could be shorter than that of the use phase of the product (considered in the LCA). If so, it should be decided if the eco-strategy will be substituted with another one.
To illustrate, let’s assume that a product with a use-life of 5 years consumes certain material or resources. An eco-strategy is projected. The development team can extract It0and CMRfrom field experiments. In a year period, the
evolution of the Mitigation Rate could be considered with an initial improvement It080% of initial improvement and
a Coefficient of Mitigation Rate in eco-strategy performance CMRof 20% (Figure 2). The whole life is segmented of
5 years is segmented in t of 60 months. Consumption will gradually tend to return to the initial levels (reference levels of consumption have been normalized to 1, as 100%).
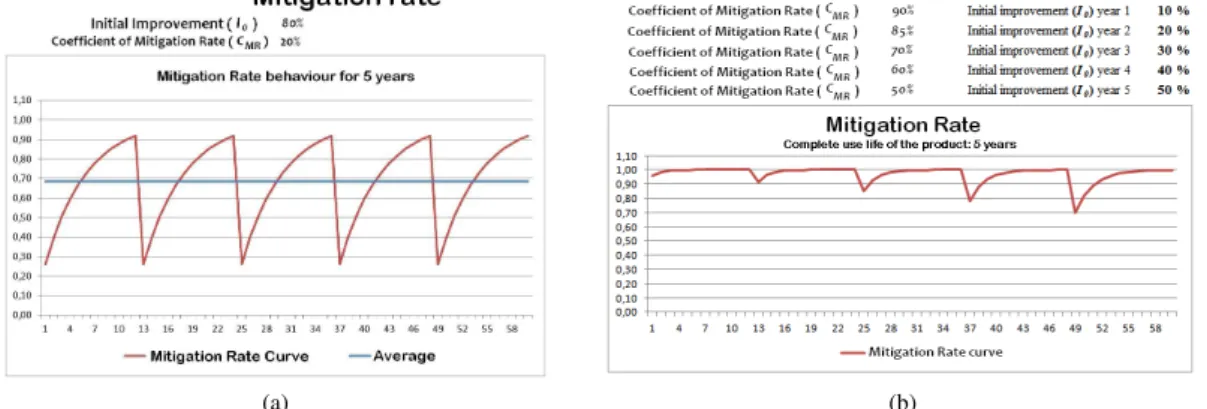
The development team can then decide to implement a new eco-strategy each year to face this eventuality. It can then project a scenario where each year a new strategy with the same performance as the first one is launched. Figure 3a shows a scenario like this.
The case shown in the scenario in Figure 3a can still be approached to the real circumstances if the fact that each time an eco-strategy is implemented, its performance can change. Figure 3b, for example, considers an optimistic scenario, in which each new launch of eco-strategy would improve little by little its performance, while succeeding in lowering its loss of efficacy through time. Adaptation of the eco-strategy must be decided at each interval by the development team. This can be achieved through the concept GULC (Serna-Mansoux et al. (2012)). Its aim is to monitor and improve environmentally friendly interaction with the product. The concept can be understood in general terms to follow four steps: 1) the calculation of the environmental impact of the product, 2) the definition of an interaction strategy for the use phase aiming at environmentally friendly performance, 3) the follow-up of the user’s actual use of the product, and 4) the improvement of the strategy to steer the user to go towards the minimum environmental impact. With the use of GULC, the curve of consumption can be followed-up, and the strategy adapted to improve performance.
The MRcan then be appreciated in terms of different scenarios and the development team can set its goals regarding
the eco-strategy. This will be illustrated in the case study presented in the next section. 3.2. The integration into the general design process
In the case of eco-design strategies and the exploration of their potentials, a reference product almost always exists. The work here presented is positioned then in the realm of a redesign process. On the other hand, redesign
Figure 2: Mitigation Rate for a year period.
(a) (b)
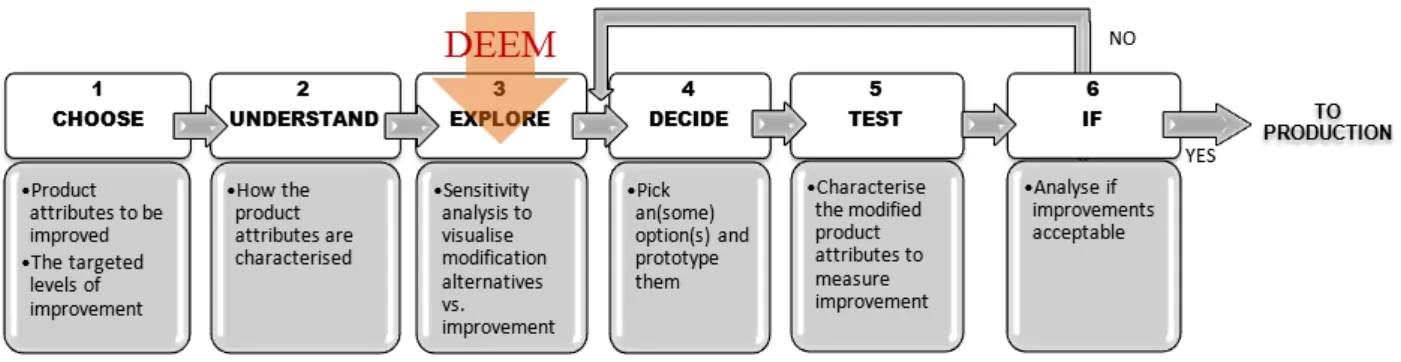
Figure 4: Redesign process and DEEM.
processes are guided by those parameters the development team chooses to take in account. A thorough overview can be found in Smith et al. (2012). In the context of eco-design, as discussed before, the objective is traditionally to lower the environmental impact of the product. We propose a general redesign method implicating the DEEM, illustrated in Figure 4. It is deployed as follows:
1 CHOOSE. In this phase, the product to be redesigned is analysed. Not all of the product’s attributes are tar-geted for improvement. Under an eco-design approach for example, those attributes related with environmental impact are chosen. It is important to emphasize though, that as a result of the bibliographical revision made, it is reminded that the attributes related with human-product interaction in use phase must be included.
2 UNDERSTAND. In this phase, the way the attributes come to be, why they have the nature they have, and how they amount for the product whole configuration is understood. This gives the necessary information and tools to be able to do the next phase. In this phase, the LCA tools like SimaPro are used.
3 EXPLORE. Different sensitivity analysis and simulated scenarios are then modelled and run. The objective is to create a solution space where different options are visualised, and the impact of the improvements targeted assessed.
4 DECIDE. Out of all the alternatives simulated, the development team can then choose those with more promise. The prototyping, whether virtual or physical, can be done only for a reduced number that fit the region of the solution space considered to be acceptable.
5 TEST. A virtual or physical prototype is tested. Normally, the development team will launch different kind of experiments, depending on what they are measuring.
6 IF. The results of the test in terms of the level of improvement first targeted will lead either to the production phase, or to the return to the solution space, if the levels are not acceptable. It must be noted that the loop can return to any point prior to the one illustrated in Figure 4.
The DEEM is used in the phase ”EXPLORE”, where the construction of the solution space and its exploration is being made.
4. The paper towel dispenser
We present the case study of the paper dispenser. The experiment consists of doing the life-cycle analysis of several alternatives of paper towel dispensers. The aim is to identify the best concepts in terms of environmental performance through out the whole product life. The different ways to deliver an eco-strategy generate different paper consumptions reductions. On the other hand, they also generate different environmental impacts when produced.
We then use the DEEM, which models both the reduction in consumption envisaged by the strategy, and the environmental impact any modification to the original product might generate. DEEM will help in choosing the best strategy based on the final balance between the two.
The four options studied are:
1. The existing paper towel. It has a certain paper consumption on average, and a certain environmental impact. We consider this product the reference point to start.
(a) (b)
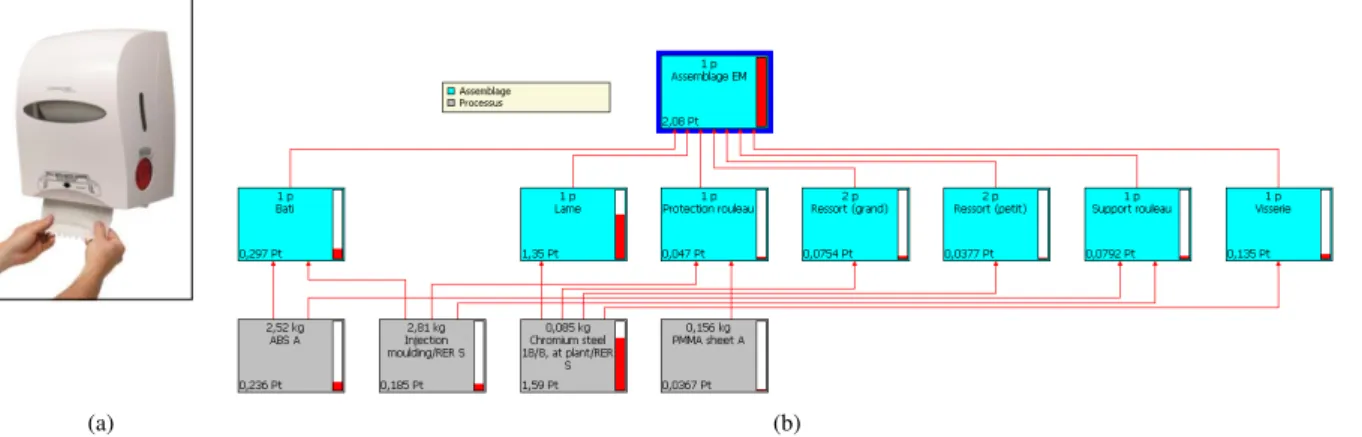
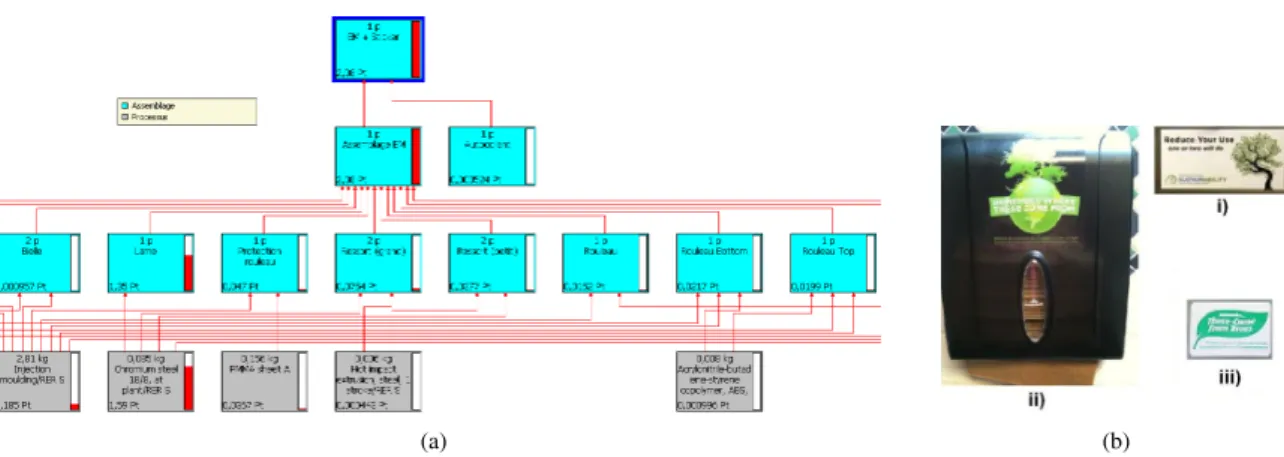
Figure 5: LCA decomposition for existing paper towel dispenser.
2. A modified paper towel with a sticker. By placing a message on the sticker, the user has feedback on the effects of over-consuming paper towels.
3. A modified paper towel with a flag. This flag is projected to move into the user’s champ of vision once he/she has consumed a minimum quantity of paper (calculated to be enough to dry the hands). The message then is more specific and works only when the user is in real conditions of wasting paper.
4. A modified paper towel with an LCD screen attached. This modification enables changing the messages from time to time. This can make the messages effective more time than a sticker, which is unchangeable.
We use then the DEEM to calculate the environmental impact of each option, following the equations presented in Section 3.
4.1. CHOOSE-UNDERSTAND. The existing paper towel
The paper towel studied works by pulling the paper towels. The artefact stops at certain length, which is measured as 1 paper towel. The user can pull the number of times he wishes, always getting a paper towel the same size. It is considered for the product to have a 5 year use life. As stated before, the tool used for LCA is SimaPro version 7.3.3. multiuser. The reference calculation model is EcoIndicator99 (EI99) (Goedkoop and Spriensma (2001)). SimaPro is used to gather all environmental impacts and summarize them in one score expressed in points. It is thus easy to compare different processes, products and services in terms of their environmental efficiency.
We have then a product (without the paper consumption taken in account) impact of 2.08 pts. The general decom-position is shown in Figure 5(b). This illustration (as the rest of this type in the article) is abbreviated, showing only the general phases of the life cycle, and not the detailed processes.
If we consider the paper consumption in account, we take an average use of 3 paper towels per person, and around 14 persons that use the dispenser a day. This average consumption has been observed in previous work made by the research group Serna-Mansoux et al. (2012). In a year, the points then amount to 5.75 pts. As can be derived, the LCA for the product plus the consumption of paper towels amounts to 7.83 pts. for the whole life of 5 years. As can be seen, in the total of points, a considerable amount comes from use. This leads to the shift in focus to the use of the product, the consumption of paper towels, and the different strategies that can be implemented in the product to minimize this. To have a reference of the minimal use targeted, it is considered a person can dry her hands with an average of 1.5 paper towels per passage. This consumption in the circumstances previously stated (14 persons once a day), would reduce the yearly impact by half (to 2.87 pts.). In order to achieve this, several options are explored. 4.2. EXPLORE. Generalities
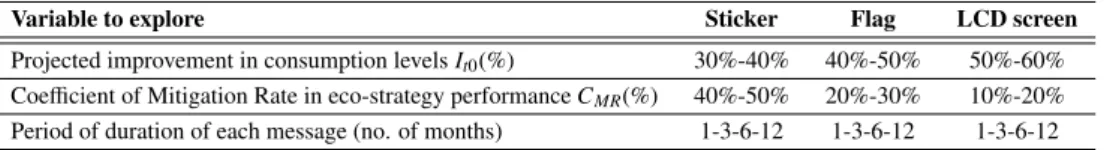
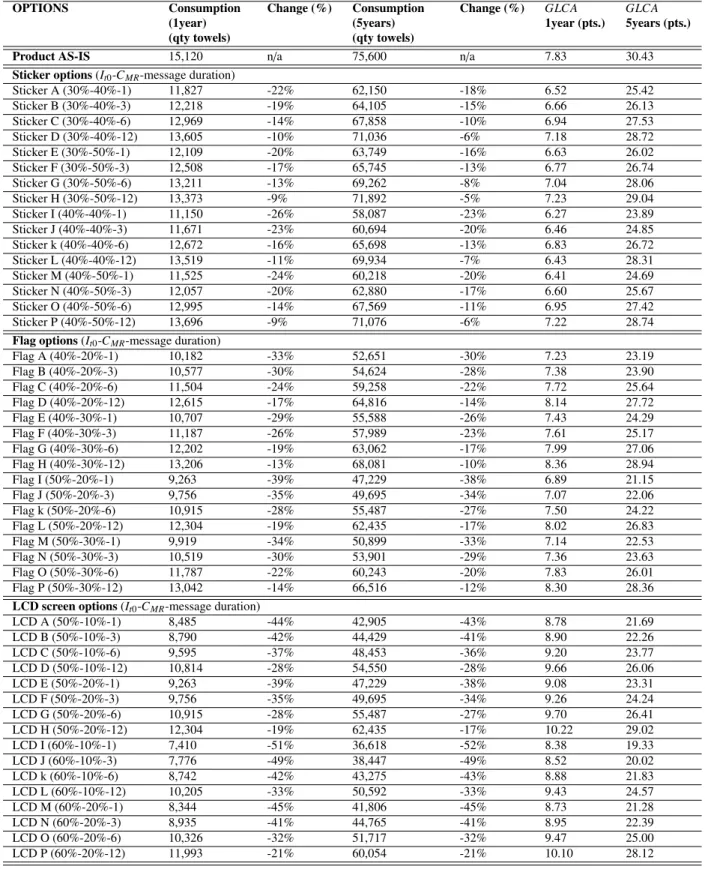
In order to compare the different alternatives, we have considered the intervals shown in TABLE 1. This explores the different scenarios an eco-strategy would result in. In particular, we consider three:
Table 1: Exploration intervals for eco-strategy alternatives.
Variable to explore Sticker Flag LCD screen Projected improvement in consumption levels It0(%) 30%-40% 40%-50% 50%-60%
Coefficient of Mitigation Rate in eco-strategy performance CMR(%) 40%-50% 20%-30% 10%-20%
Period of duration of each message (no. of months) 1-3-6-12 1-3-6-12 1-3-6-12
Strategy 1. An informative sticker is placed on the product. This does not required a modification in product architecture to accommodate extra components.
Strategy 2. An informative flag is added to the product. This implies a modification in product architecture. The flag is intended to have a mechanism that would activate it whenever the consumption reaches a certain limit.
Strategy 3. An informative LCD screen is added to the product. This, although it could be just added to existing products, should result in extra energy consumption during the use-life of the product. It will be clarified how this energy is considered for the LCA of the modified paper towel.
The intervals considered grow in terms of improvement and decrease in terms of the Mitigation Rate in eco-strategy performance CMRbecause it is considered each eco-strategy has increased potential of success in terms of the previous
one. Strategy 1, considering a sticker, it fairly limited in terms of adaptability and customisation of message. The sticker is in a fixed position with a fixed message all the time. On the other hand, the Strategy 2 considers a flag that activates whenever the limit of consumption (in this case decided to be at 1.5 paper towels) is reached. It could be then considered that the message is more focused on the persons that actually surpass the desired consumption and because of this, the potential of success could be greater. The Strategy 3 considers a LCD screen. This increases a little more the potential of success by enabling the message to be adapted in content, in time of display, and so forth. In Figure 6 the exploration is graphed in terms of the GLCA resulting of the calculations (1year vs. 5years). In the following subsections, the exploration is discussed according to the data Table 2. As for the paper towel dispenser without any eco-strategy, the consumption has been observed to be an average of 3 paper towels per person (Serna-Mansoux et al. (2012)).
4.3. EXPLORE. Strategy 1: eco-feedback via an informative sticker
We begin with the simplest solution: a sticker placed on the towel paper dispenser. This can inform, entice or even emotionally compel (by a message aimed at making the user feel guilty of excess use) a conscious consumption.
We calculate the global impact by following the equation 1.
The LCA for the product with the sticker is shown in Figure 7. As can be observed, the impact of the sticker is so small, in relation with the product (0.000524 pts.), that the overall LCA continues to be 2.08 pts., as in the product without the sticker. This first calculation, however, considers the same sticker throughout the 5 year use-life of the dispenser.
It has been proven before, in Serna-Mansoux et al. (2012), that messages loose their efficacy in time. The strategy should then consider the periodical change of the message. The Mitigation Rate can be explored in several options, shown in Table 2. The best three options of this strategy are then I, J, and M. The first two consider an improvement It0 of 40%, a Coefficient of Mitigation Rate CMR of 40%, and a change of message monthly and each 3 months
respectively. The third option M considers an improvement It0of 40%, a Coefficient of Mitigation Rate CMRof 50%,
and a change of message monthly.
4.4. EXPLORE. Strategy 2: eco-feedback via a popping flag
We explore then the option of a paper towel dispenser with a popping flag. This flag would be activated to appear with a message each time the towel consumption have reached the targeted quantity (1.5 towels) and the user activates the paper towel mechanism to have more towels. This enables the information to be directed specifically to those users that are consuming more.
Figure 6: GLCA 1year vs. 5year for eco-strategy exploration.
(a) (b)
Figure 7: LCA decomposition for paper towel dispenser with a sticker. Reference images: i)Alameda County (2012), ii)Shelton (2012), iii)Kindya (2010)
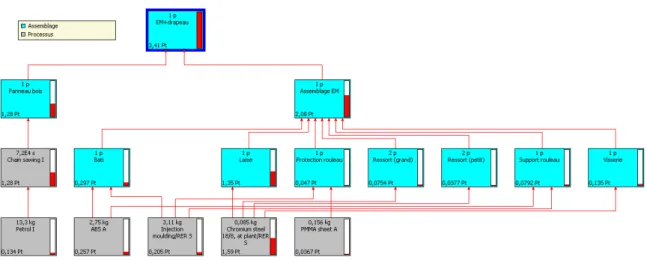
Figure 8: LCA decomposition for paper towel dispenser with a flag.
The LCA for the product with the flag is shown in Figure 8. In relation to the original product, whose LCA was 2.08 pts., the new product has increased in impact to 3.41 pts. DEEM is used here to know what kind of performance it would be needed from the eco-feedback to achieve the existing product’s Glca of 7.83 pts., or 30.43 pts. in the whole 5-year period. The exploration results are shown in Table 2. The LCA of the sticker is added to the calculation, since it is projected for the message to be changed on the flag. The flag though, remains the same, and so it is envisioned to paste a sticker with a message in it periodically.
As can be observed, an interesting phenomenon appears. In some cases (as in options D, G, H, L, and P) even if the consumption is always reduced the GLCA for the first year is higher than existing product. Nevertheless, the GLCAfor 5 years achieves lower levels than the existing product. This would mean the product should be planned to work for a medium to long term (5 years or more) to be an good choice environmentally speaking.
4.5. EXPLORE. Strategy 3: eco-feedback via an LCD screen
Considering the liberty and creativity that an LCD screen could give to the ECO-feedback, this is an interesting option to explore. This would enable the message to be constantly changed and the possibilities of reaching would theoretically be enhanced, since the LCD screen could use animation as part of the eco-feedback.
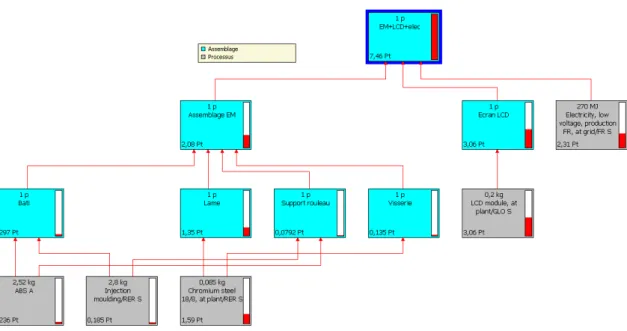
In order to calculate the environmental impact, though, this strategy has to take in consideration the energy con-sumed by the LCD screen throughout the life of the product. The considerations for the assessment are that the screen size is 4 inches, with a power of 5W. It considers also an operating span of 8 hours per day, 365 days per year throughout the 5 years life of the product. The energy mix considered for the assessment is the French one.
As can be seen in Figure 9, the LCA shows that the impact of the product with the LCD screen go up to 5.60 pts. for the first year and 7.45 pts. for the 5-year life of the product (from 2.08 pts. in the original). In the exploration Table 2 it can be observed that the LCD strategy works better if considered in a 5-year span. This is important insight that can help the development team to plan the eco-strategy.
4.6. DECIDE. Discussions on exploration
In Figure 10, the solution space is explored. As can be seen, it is divided in quadrants from the origin point of the existing product. In the lower left corner, a limit of the solution space is marked. This boundary is defined by the lowest possible consumption of paper towels (which in the beginning of the section was set at 1.5 paper towels per person), and the existing products points out of the LCA. The target then is to achieve the lowest consumption possible while keeping (at least) the same product environmental impact.
As it can be appreciated, the solution space is divided into:
I The improbable outcome quadrant. This region of the solution space is where the alternatives with a lower score in the LCA at a 5 year calculation than at one year calculation, in relation with the existing solution.
Table 2: Exploration for paper towel eco-strategies. OPTIONS Consumption (1year) Change (%) Consumption (5years) Change (%) GLCA 1year (pts.) GLCA 5years (pts.)
(qty towels) (qty towels)
Product AS-IS 15,120 n/a 75,600 n/a 7.83 30.43
Sticker options (It0-CMR-message duration)
Sticker A (30%-40%-1) 11,827 -22% 62,150 -18% 6.52 25.42 Sticker B (30%-40%-3) 12,218 -19% 64,105 -15% 6.66 26.13 Sticker C (30%-40%-6) 12,969 -14% 67,858 -10% 6.94 27.53 Sticker D (30%-40%-12) 13,605 -10% 71,036 -6% 7.18 28.72 Sticker E (30%-50%-1) 12,109 -20% 63,749 -16% 6.63 26.02 Sticker F (30%-50%-3) 12,508 -17% 65,745 -13% 6.77 26.74 Sticker G (30%-50%-6) 13,211 -13% 69,262 -8% 7.04 28.06 Sticker H (30%-50%-12) 13,373 -9% 71,892 -5% 7.23 29.04 Sticker I (40%-40%-1) 11,150 -26% 58,087 -23% 6.27 23.89 Sticker J (40%-40%-3) 11,671 -23% 60,694 -20% 6.46 24.85 Sticker k (40%-40%-6) 12,672 -16% 65,698 -13% 6.83 26.72 Sticker L (40%-40%-12) 13,519 -11% 69,934 -7% 6.43 28.31 Sticker M (40%-50%-1) 11,525 -24% 60,218 -20% 6.41 24.69 Sticker N (40%-50%-3) 12,057 -20% 62,880 -17% 6.60 25.67 Sticker O (40%-50%-6) 12,995 -14% 67,569 -11% 6.95 27.42 Sticker P (40%-50%-12) 13,696 -9% 71,076 -6% 7.22 28.74
Flag options (It0-CMR-message duration)
Flag A (40%-20%-1) 10,182 -33% 52,651 -30% 7.23 23.19 Flag B (40%-20%-3) 10,577 -30% 54,624 -28% 7.38 23.90 Flag C (40%-20%-6) 11,504 -24% 59,258 -22% 7.72 25.64 Flag D (40%-20%-12) 12,615 -17% 64,816 -14% 8.14 27.72 Flag E (40%-30%-1) 10,707 -29% 55,588 -26% 7.43 24.29 Flag F (40%-30%-3) 11,187 -26% 57,989 -23% 7.61 25.17 Flag G (40%-30%-6) 12,202 -19% 63,062 -17% 7.99 27.06 Flag H (40%-30%-12) 13,206 -13% 68,081 -10% 8.36 28.94 Flag I (50%-20%-1) 9,263 -39% 47,229 -38% 6.89 21.15 Flag J (50%-20%-3) 9,756 -35% 49,695 -34% 7.07 22.06 Flag k (50%-20%-6) 10,915 -28% 55,487 -27% 7.50 24.22 Flag L (50%-20%-12) 12,304 -19% 62,435 -17% 8.02 26.83 Flag M (50%-30%-1) 9,919 -34% 50,899 -33% 7.14 22.53 Flag N (50%-30%-3) 10,519 -30% 53,901 -29% 7.36 23.63 Flag O (50%-30%-6) 11,787 -22% 60,243 -20% 7.83 26.01 Flag P (50%-30%-12) 13,042 -14% 66,516 -12% 8.30 28.36
LCD screen options (It0-CMR-message duration)
LCD A (50%-10%-1) 8,485 -44% 42,905 -43% 8.78 21.69 LCD B (50%-10%-3) 8,790 -42% 44,429 -41% 8.90 22.26 LCD C (50%-10%-6) 9,595 -37% 48,453 -36% 9.20 23.77 LCD D (50%-10%-12) 10,814 -28% 54,550 -28% 9.66 26.06 LCD E (50%-20%-1) 9,263 -39% 47,229 -38% 9.08 23.31 LCD F (50%-20%-3) 9,756 -35% 49,695 -34% 9.26 24.24 LCD G (50%-20%-6) 10,915 -28% 55,487 -27% 9.70 26.41 LCD H (50%-20%-12) 12,304 -19% 62,435 -17% 10.22 29.02 LCD I (60%-10%-1) 7,410 -51% 36,618 -52% 8.38 19.33 LCD J (60%-10%-3) 7,776 -49% 38,447 -49% 8.52 20.02 LCD k (60%-10%-6) 8,742 -42% 43,275 -43% 8.88 21.83 LCD L (60%-10%-12) 10,205 -33% 50,592 -33% 9.43 24.57 LCD M (60%-20%-1) 8,344 -45% 41,806 -45% 8.73 21.28 LCD N (60%-20%-3) 8,935 -41% 44,765 -41% 8.95 22.39 LCD O (60%-20%-6) 10,326 -32% 51,717 -32% 9.47 25.00 LCD P (60%-20%-12) 11,993 -21% 60,054 -21% 10.10 28.12
Figure 9: LCA decomposition for paper towel dispenser with a LCD screen.
II The unacceptable strategy quadrant. This region of the solution space is where the alternatives that have both a yearly and a 5-yearly score higher than the existing solution. Independently of the fact that the eco-strategy may be helping in lowering consumption of paper towels, the overall impact is not desirable.
III The acceptable strategy quadrant. This region comprises the alternatives that have managed to keep a Glca score below the existing product (yearly, and through the 5-year use life of the product). The more the alternative is close to the lower left corner of the quadrant, the more acceptable it is.
IV The long term strategy quadrant. This region could be considered if the solutions explored in quadrant III seem difficult to achieve. In it, the alternatives that have a higher Glca score in a year’s time than the existing product, but lower in the 5-year use-life of the product. This means that in the long run, the strategy considered for the alternative results in a lower environmental impact.
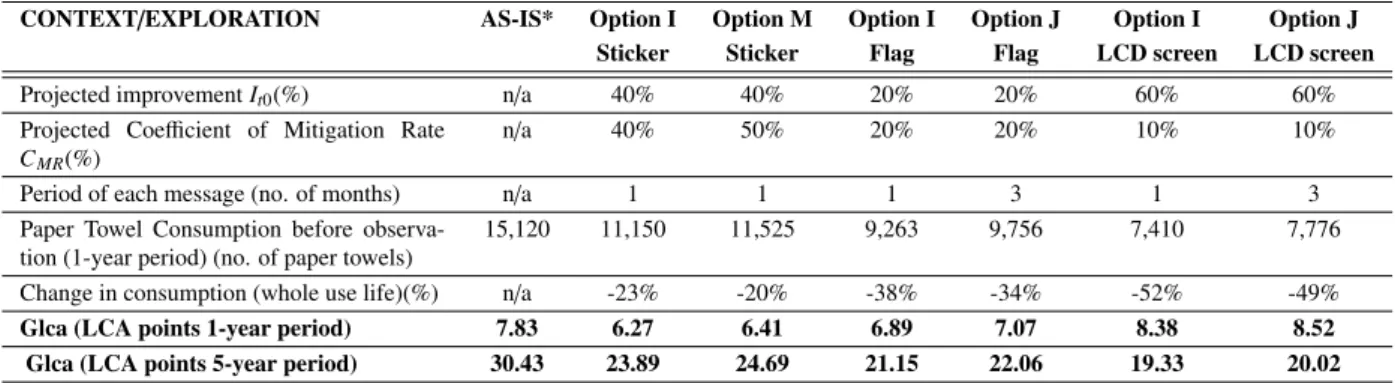
From Figure 10, we can deduce that all the options in the eco-strategy that considers a sticker are acceptable. In the flag’s case, 5 are in the quadrant IV (long-term strategy), one in the limits between quadrants III (acceptable strategy) and IV, and the rest quadrant III. As for the eco-strategy considering an LCD screen, all are are found in quadrant IV. From this we can see that the LCD screen strategy is only pertinent if considered long-term (that is, 5 years or more). From those solutions, we concentrate in the best 2 of each eco-strategy. These would be the ones that are closer to the target limit: options I and I for the sticker eco-strategy, options I and J for the flag eco-strategy, and options I and J for the LCD screen eco-strategy (Table 3).
The options for the sticker have relatively modest targets in terms of performance of the eco-feedback to be placed on the sticker. On the other hand, the best solutions for the eco-strategy that considers a LCD screen have far more ambitious levels of success in terms of the eco-feedback to be communicated. They would have to achieve a 60% improvement in consumption (which is reduction in consumption), and would need to nearly maintain this efficacy, with just 10% of loss in performance through time.
At this point the development team can discuss the feasibility of the options listed, or even of the rest of the options in the solution space quadrant that’s acceptable. Experimentation with different alternatives can be focused just in those that promise to work, thus aiding in the eco-design strategy for the product.
5. Sensitivity Analysis
A sensitivity analysis is useful in the exploration of solutions, in that is shows how the result would be affected by the variations in key parameters and their interaction. In this case, we perform a simple multi-way sensitivity analysis
Figure 10: Exploration space for eco-strategy alternatives.
Table 3: Six best options in eco-strategy alternatives.
CONTEXT/EXPLORATION AS-IS* Option I Option M Option I Option J Option I Option J Sticker Sticker Flag Flag LCD screen LCD screen Projected improvement It0(%) n/a 40% 40% 20% 20% 60% 60%
Projected Coefficient of Mitigation Rate CMR(%)
n/a 40% 50% 20% 20% 10% 10% Period of each message (no. of months) n/a 1 1 1 3 1 3 Paper Towel Consumption before
observa-tion (1-year period) (no. of paper towels)
15,120 11,150 11,525 9,263 9,756 7,410 7,776 Change in consumption (whole use life)(%) n/a -23% -20% -38% -34% -52% -49% Glca (LCA points 1-year period) 7.83 6.27 6.41 6.89 7.07 8.38 8.52
Glca (LCA points 5-year period) 30.43 23.89 24.69 21.15 22.06 19.33 20.02 *AS-IS: The product before any eco-strategy is applied.
Figure 11: Variations for Sensitivity Analysis.
with specific variations, to show the general tendency of the model.
In our case study of the paper towel dispenser we then explore further possibilities in the realms of the product lifespan, the volume of users exploiting the product and the variabilities the impact of the consumables may have.
AS Figure 11 shows, the variations we took in account are a lifespan of 2, 5, and 7 years. In terms of the volume of users, we considered 7, 14, and 28 users using the paper towel dispenser daily (once). Finally, we consider a variation of the LCA result for the environmental impact of the consumables (the paper towels) of -/+ 25
We chose for the sensitivity analysis the three best options according to Table 3, which are the options I for each alternative. The results are grouped first in terms of the product lifespan, and within each of those groups, the different options can be assessed vs. the original product. All these variations are shown in Figures 12, 13, and 14.
As can be appreciated, the LCD screen alternative will have a better performance almost always when the number of users goes up to 28. Except for the case where the product lifespan is 2 years, and the LCA for the consumables is reduced by 25%. There, the alternative considering the sticker is marginally better.
When considering 14 users (as in the original case study), we can see that the tendencies are kept throughout the variations of the LCA for the consumables. The tendencies favour the option with the sticker when the lifespan of the product is 2 years. But when the lifespan of the product is augmented, the tendency inclines towards the solution with the LCD screen. This could be understood since the option of the LCD screen is assumed to be more efficacious to reduce consumption, while the sticker option, even if the environmental impact of the implementation is not so relevant, is assumed to work less efficaciously. The fact the the LCD screen impact is distributed through more years helps too.
When few users are considered (7 users) LCD screen tends to be work in very specific cases. For example, when the lifespan of the product is projected at 2 years, the sticker option is the best performer by far. When the lifespan is extended to 5 years, the sticker option and the LCD are closer to one another in performance, but the sticker option is still marginally better. When the lifespan is extended to 7 years, and the LCA of the consumables (the paper towels) is reduced by 25%, the sticker option is better by very little. When the LCA is kept at its original level, or augmented by 25%, the solution considering the LCD screen takes a very modest lead. The flag option is always in the middle of the other two, never managing to be in the lead.
6. Discussion and perspectives
The different experimentations and results presented shows us the multiple possibilities when confronted with the eco-design problem. The difficulties in assessing with accuracy the information needed to validate all the exploration and sensitivity models become clear as well. It is evident that one of the main challenges of the eco-strategies is the prediction of its performance. This is why an approach that considers the follow-up of the user’s interactions with the product is preferred. The adaptation of the eco-strategy, as proposed by the work in (Serna-Mansoux et al., 2012) promises the optimal application of the Dynamic Eco-strategy Explorer Model (DEEM).
Figure 12: Sensitivity Analysis - Lifespan 2 years.
Figure 14: Sensitivity Analysis - Lifespan 7 years.
In conclusion, we have presented what we have called the Dynamic Eco-strategy Explorer Model (DEEM), aimed at aiding in the development of a strategy focused on the environmentally friendly use. Specifically, it considers the consumption of resources (energy, water, etc.) or consumables as the target to be reduced. This DEEM acknowledges the fact that the different eco-strategies embedded on a product can have different impacts in consumption levels. Most importantly, their efficacy in driving the user towards an eco-use can diminish in time. To consider this, a Mitigation Rateis proposed. This rate is a projection of the performance of an eco-strategy in time, and it is modelled as an exponential decrease that results in the user returning to original levels of consumption. Coupled with an LCA of the product and of the consumables, the actual utility of a strategy can be assessed. We have presented a case study, the paper towel dispenser. In this case study, we have studied different alternatives for the eco-strategy. DEEM has been used to explore the solution space and show how to determine the best options. Once these options have been pinpointed, we propose a further sensitivity analysis to enlarge the universe of possibilities to key parameters that could influence the performance of the solutions. We can appreciate how solutions change in performance depending on variations in terms of number of users, lifespan of the product, or the environmental impact (calculated via the LCA) of the consumables. The best strategy can be then understood as a combination of parameters, some of which the industry or company to which the product development team belongs can control, some of which it cannot. The panorama via our DEEM is nevertheless, rationalized, and better decisions can be taken.
References
Abramovici, M., Lindner, A., 2011. Providing product use knowledge for the design of improved product generations. CIRP Annals - Manufac-turing Technology 60, 211 – 214.
Alameda County, C., 2012. Waste reduction - paper towels. Website: http://www.acgov.org/sustain/what/wastereduction/towels.htm.
Bonner, J.V., 2009. Adding critical sensibilities to domestic communication technologies. International Journal of Human-Computer Studies 67, 215 – 221. ¡ce:title¿The family and communication technologies¡/ce:title¿.
Cerdan, C., Gazulla, C., Raugei, M., Martinez, E., i Palmer, P.F., 2009. Proposal for new quantitative eco-design indicators: a first case study. Journal of Cleaner Production 17, 1638 – 1643.
Finnveden, G., Hauschild, M.Z., Ekvall, T., Guine, J., Heijungs, R., Hellweg, S., Koehler, A., Pennington, D., Suh, S., 2009. Recent developments in life cycle assessment. Journal of Environmental Management 91, 1 – 21.
Fogg, B., 1999. Persuasive technologies. Communications of the ACM 42, 27–29.
Goedkoop, M., Schryver, A.D., Oele, M., Durksz, S., de Roest, D., 2010. Introduction to LCA with SimaPro 7. Technical Report. Pr Consultants. Goedkoop, M., Spriensma, R., 2001. The Eco-Indicator 99: A Damage Oriented Method for LIfe Cycle Impact Assessment. Technical Report. Pr
Consultants B.V., Amersfoort, The Netherlands.
Goggin, P.A., 1994. An appraisal of ecolabelling from a design perspective. Design Studies 15, 459 – 477.
Hauschild, M., Jeswiet, J., Alting, L., 2004. Design for environment - do we get the focus right? CIRP Annals - Manufacturing Technology 53, 1 – 4.
Hauschild, M., Jeswiet, J., Alting, L., 2005. From life cycle assessment to sustainable production: Status and perspectives. CIRP Annals -Manufacturing Technology 54, 1 – 21.
Herrmann, C., Bergmann, L., S., T., Halubek, P., 2007. Total life cycle management - an integrated approach towards sustainability, in: 3rd International Conference on Life Cycle Management, University of Zurich at Irchel.
Herrmann, C., Mansour, M., Mateika, M., 2005. Strategic and operational life cycle management model, methods and activities, in: Proceedings of the 12th International CIRP Seminar on LCE 2005, Laboratoire 3S.
Kaebernick, H., Kara, S., Sun, M., 2003. Sustainable product development and manufacturing by considering environmental requirements. Robotics and Computer-Integrated Manufacturing 19, 461 – 468. ¡ce:title¿Leadership of the Future in Manufacturing¡/ce:title¿.
Kindya, S., 2010. Earth week at the library end review. Website: http://blogs.scranton.edu/library/2010/05/02/earth-week-at-the-library-end-review/. University of Scranton Blog.
King, P., Tester, J., 1999. The landscape of persuasive technologies. Communications of the ACM 42, 31–38. Krippendorff, K., 2006. The semantic turn: A new foundation for design. Taylor and Francis.
Lilley, D., 2009. Design for sustainable behaviour: strategies and perceptions. Design Studies 30, 704 – 720. L¨obach, B., 1976. Industrial design: Grundlagen d. Industrieproduktgestaltung. Thiemig.
Lockton, D., Harrison, D., Stanton, N.A., 2010. The design with intent method: A design tool for influencing user behaviour. Applied Ergonomics 41, 382 – 392. ¡ce:title¿Special Section: Recycling centres and waste handling a workplace for employees and users.¡/ce:title¿.
Maxwell, D., van der Vorst, R., 2003. Developing sustainable products and services. Journal of Cleaner Production 11, 883 – 895. ¡ce:title¿Product Service Systems and Sustainable Consumption¡/ce:title¿.
Michelini, R., Razzoli, R., 2004. Product-service eco-design: Knowledge-based infrastructures. Journal of Cleaner Production 12, 415 – 428. Millet, D., Bistagnino, L., Lanzavecchia, C., Camous, R., Poldma, T., 2007. Does the potential of the use of lca match the design team needs?
Journal of Cleaner Production 15, 335 – 346.
Nissen, U., 1995. A methodology for the development of cleaner products: The ideal-eco-product approach. Journal of Cleaner Production 3, 83 – 87. European Roundtable on Cleaner Production Programs.
Norman, D.A., 2004. Emotional Design: Why we love (or Hate) everyday things. Basic Books.
Ornetzeder, M., Rohracher, H., 2006. User-led innovations and participation processes: lessons from sustainable energy technologies. Energy Policy 34, 138 – 150. ¡ce:title¿Reshaping Markets for the Benefit of Energy Saving¡/ce:title¿ ¡xocs:full-name¿Reshaping Markets for the Benefit of Energy Saving¡/xocs:full-name¿.
Park, P.J., Tahara, K., 2008. Quantifying producer and consumer-based eco-efficiencies for the identification of key ecodesign issues. Journal of Cleaner Production 16, 95 – 104.
Park, P.J., Tahara, K., Inaba, A., 2007. Product quality-based eco-efficiency applied to digital cameras. Journal of Environmental Management 83, 158 – 170.
Peine, A., Herrmann, A.M., 2012. The sources of use knowledge: Towards integrating the dynamics of technology use and design in the articulation of societal challenges. Technological Forecasting and Social Change , –.
Serna-Mansoux, L., Millet, D., Chapotot, E., Minel, S., 2012. For a sustainable dialogue: the green-use learning cycles (gulc) concept, in: 11th Biennal Conference on Engineering Systems Design and Analysis, ESDA 2012.
Shelton, S., 2012. The mainstream blog - thou shall not mislead. Website: http://sheltongrp.com/blog/?p=4186. Smith, S., Smith, G., Shen, Y.T., 2012. Redesign for product innovation. Design Studies 33, 160 – 184.
Vallette, T., 2005. Recherche d’un cadre conceptuel d’aide la conception collective innovante par l’usage: proposition de l’outil ”Glocal” pour la conception d’outils main et des quipements de travail. Ph.D. thesis. ENSAM Paris.
Verbong, G.P., Beemsterboer, S., Sengers, F., 2012. Smart grids or smart users? involving users in developing a low carbon electricity economy. Energy Policy , –.
Vezzoli, C., Sciama, D., 2006. Life cycle design: from general methods to product type specific guidelines and checklists: a method adopted to develop a set of guidelines/checklist handbook for the eco-efficient design of necta vending machines. Journal of Cleaner Production 14, 1319 – 1325. ¡ce:title¿EcoDesign: What’s happening?¡/ce:title¿.
Waage, S.A., 2007. Re-considering product design: a practical ”road-map” for integration of sustainability issues. Journal of Cleaner Production 15, 638 – 649.
Wever, E., Kujik, J.V., Boks, C., 2008. User-centred design for sustainbale behavior. International Journal of Sustainable Engineering 1, 9–20. Yang, C.J., Chen, J.L., 2011. Accelerating preliminary eco-innovation design for products that integrates case-based reasoning and triz method.
Journal of Cleaner Production 19, 998 – 1006.