Assignment of glial brain tumors in humans by
in v i v o
H-magnetic
resonance spectroscopy and multidimensional
metabolic classification
W e r n e r Roser, 1'2. Gisela H a g b e r g , 2 Irina Mader, 1 Sophie Dellas, 1 Joachim Seelig, z
Ernst W. Radue, 1 a n d W o l f g a n g Steinbrich 1
1Department of Medical Radiology, Division of Neuroradiology, University Hospital Kantonsspital, Basel, Switzerland 2Magnetic Resonance Center and Biocenter, University of Basel, Basel, Switzerland
This study presents a simple approach for the noninvasive assignment of glial brain tumors ac- cording to malignancy by single-voxel proton magnetic resonance spectroscopy at short echo times (TE ~ 50 milliseconds). Based on peak area ratios, a five-dimensional data set was obtained for each investigated subject. This vector was then projected along metabolic coordinates in a two- dimensional metabolic space. These coordinates had been determined in a previous study (Hagberg G e t al., 1995, Magn Reson Med 34" 242-252). Tumor assignment was done without any knowledge of histology by comparing the location of the new cases to the features of the previous study. All 11 investigated glioblastomas multiforme, as well as 4 of 5 astrocytomas grade II, could easily be assigned to the groups of high- and low-grade tumors, respectively. Classification was more diffi- cult in the case of a cystic astrocytoma grade II and one astrocytoma grade III. Two spectra mea- sured in normal-appearing matter of glioblastoma patients were not classified as healthy. Using single-voxel proton magnetic resonance spectroscopy at short echo times with the knowledge of a base study, a straightforward, fast, and noninvasive differential diagnosis of glial brain tumors is possible.
Keyzvords: 1H-MRS, human, glioma, malignancy, classification, ODV.
INTRODUCTION
The histological assignment of h u m a n brain tumors using different localized 1H-magnetic resonance spec- t r o s c o p y (1H-MRS) t e c h n i q u e s is a l o n g - s t a n d i n g problem. Several investigators have tried to find or
Supported by the Swiss National Science Foundation Research Grants No. 31-32533.91 (to J.S.) and 32.39773.93 (to W.S.). W.R. and E.W.R. have been supported by the Krebsliga beider Basel. A preliminary account of this work was given at the Third Annual Scientific Meeting of the International Society for Magnetic Reso- nance in Medicine, Nice, France, August 1995, abstract 1719. *To whom all correspondence should be addressed, at Paul Scherrer Institute, Department of Radiation Medicine, Proton Therapy Group, CH-5232 Villigen PSL Switzerland.
Date received: January 11, 1997; date accepted: April 8, 1997.
describe tumor-specific spectra [1]. H o w e v e r , most of these studies have been p e r f o r m e d using longer echo times (e.g., TE = 135-272 milliseconds). In those mea- surements the definition of the baseline is i m p r o v e d at the e x p e n s e of the visibility of r e s o n a n c e s h a v i n g shorter relaxation times or being strongly coupled, such as myo-inositol, glutamine, glutamate, lipids, or proteins. I m p o r t a n t additional metabolic i n f o r m a t i o n can thus be obtained using shorter TE. H o w e v e r , a diagnosis b a s e d on single peaks in short echo time MRS is still v e r y difficult because the spectral patterns of different t u m o r types s h o w some trends b u t overlap in a wide range [1-3].
Howells et al. [4,5] p r e s e n t e d a m e t h o d to i m p r o v e the spectral analysis of rat t u m o r s using a u t o m a t e d procedures. According, the information content of all metabolites t o g e t h e r can be extracted using cluster analysis b o t h with [4--6] or w i t h o u t [6,7] feature ex- t r a c t i o n t e c h n i q u e s [8]. First a p p l i c a t i o n s of this
180 W ROSER et al.
method to in vivo proton spectra of the human brain were presented by Confort-Gouny et al. [9].
The purpose of the present study was to apply the metabolic features found in a previous study of 21 healthy controls and humans with gliomas [6] to a new cohort of patients with a suspected glial brain tumor and other healthy volunteers. The new cases, investigated on a different magnetic resonance (MR) scanner, were classified by observing their location within the previous features as low-grade or high- grade gliomas or as healthy.
MATERIALS AND METHODS
Data acquisition and postprocessingThirty-five spectra of 17 patients with a suspected glial brain tumor and 9 healthy volunteers (HV) were in- vestigated at 1.5 T with a Siemens Magnetom SP 4000 MR system (Siemens Medical Systems, Erlangen, Ger- many) using the standard circularly polarized head coil. After image-guided localization, the position of the cubic volume of interest of 8 mL was chosen to be as close as possible to the center of the tumor, so that the volume of interest was filled with at least 75% tumor tissue. A STEAM sequence with an echo time of 50 milliseconds was used, the mixing and repetition times were 30 milliseconds and 1500 milliseconds, re- spectively; 256 acquisitions were performed. Water s u p p r e s s i o n was a c h i e v e d b y three c o n s e c u t i v e CHESS pulses followed by dephasing gradients [10]. None of the patients had ever received stereotaxic bi- opsy, open surgery, or radiation therapy before MRS. Between MR imaging and MRS was a delay of at least 1 day to minimize possible spectral disturbances caused by the application of the paramagnetic contrast agent. In eight patients contralateral normal-appear- ing matter was also investigated. Stereotaxic biopsy or open surgery was performed within a few days after MRS. One patient returned to MRS 3 months after radiation therapy.
Spectra were postprocessed with a correction for residual e d d y currents [11], zero-filling to 4096 data points, Gaussian filtering (time constant: 256 millisec- onds), and, if necessary, phase corrected in zero and first order after Fourier transformation. Peak areas were calculated using the standard equipment soft- ware. The resonances of lipids, proteins, and lactate (Lip) between 0.7 and 1.7 ppm; the N-acetylated com- pounds (NAA) at 2.0 ppm; macromolecules, gluta- mine, and glutamate (MGG) between 2.1 and 2.55 ppm; total creatine (Cr) at 3.0 ppm; the choline- containing compounds (Cho) at 3.2 ppm; and the reso- nance of both glycine and myo-inositol (GI) at 3.55
p p m were integrated. For quantification of the NAA peak, the upfield half of the resonance was integrated and the result multiplied by a factor of 2. Severe lipid contamination effects could be excluded by position- ing the volume of interest sufficiently apart from the skull and by applying slice selection gradients of 3 m T / m . This was necessary because the lipid reso- nances played an important role in the metabolic clas- sification (see below).
The study protocol was approved by the Ethical Committee of the Basel University Hospital. All sub- jects were informed of the purpose of the study and gave their consent.
Metabolic classification
For each measured subject the ratio of the area of each metabolite over the area of Cr was calculated. Thus, five ratios were obtained for each patient. The ratios were then projected along metabolic coordinates (ODV1, ODV2) into a two-dimensional space. These coordinates had been determined using the orthonor- mal discriminant vector method (ODV) [12] in a pre- vious study of 13 patients with the same inclusion criteria (suspected glial brain tumor, no previous therapy, biopsy, or surgery before MRS) and 8 healthy volunteers, all measured with identical measurement parameters on a different MR system, a Siemens Mag- netom Helicon GBS II at 2.0 T [6]. In this study, the coordinates shown in equation 1 permitted a separa- tion of all investigated cases into three distinct groups: healthy volunteers, low-grade gliomas (i.e., astrocy- toma and oligodendroglioma World Health Organiza- tion grade I and II), and high-grade gliomas (astrocy- toma grade III and glioblastoma multiforme):
ODV 1 = 0.4232 N A A / C r - 0.3116 M G G / C r - 0.6605 C h o / C r - 0.5348 G I / C r - 0.0372 Lip/Cr, (1) ODV 2 = 0.4422 N A A / C r - 0.3909 M G G / C r + 0.7321 C h o / C r - 0.3317 GI/Cr + 0.0748 Lip/Cr.
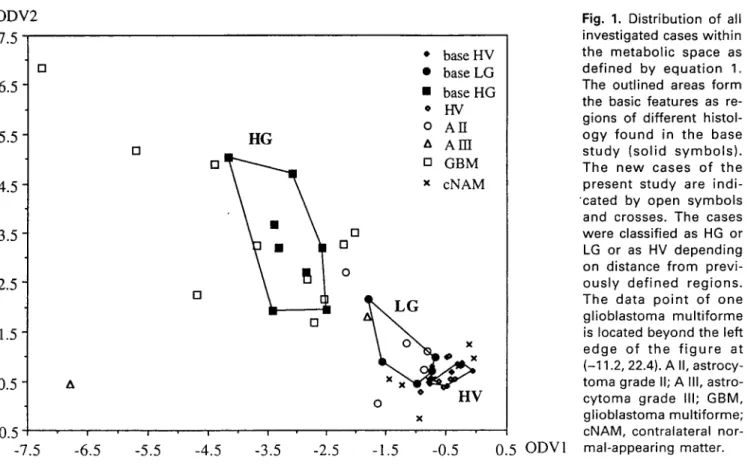
Each measured subject was thus represented by one single point in the two-dimensional metabolite space. Figure I displays the distribution of the previous cases (solid symbols) within this space. High-grade and low-grade tumors, as well as healthy volunteers, could clearly be separated by ODV.
In the present study the same coordinates were used for a histological assignment of 37 new spectra. The position of each point of the new subject group (with unknown histology, w h e n classification was done)
ODV2 7.5 [] 6.5 5.5 4.5 3.5 2.5 1.5 0.5 -0.5 -7.5 & [] I-IG [] [] n m [] I ! i i i -6.5 -5.5 -4.5 -3.5 -2.5 * base HV 9 base LG 9 base HG * H V 0 A I I a A m [] GBM x cNAM [] [] o X H V o X ! i - 1 . 5 - 0 . 5 0 . 5 0 D V 1
Fig. 1. Distribution of all
investigated cases within the metabolic space as defined by equation 1. The outlined areas form the basic features as re- gions of different histol-
o g y found in the base
s t u d y (solid s y m b o l s ) . The new cases of the present study are indi- "cated by open symbols
and crosses. The cases were classified as HG or LG or as HV depending on distance from previ- o u s l y defined regions. The data p o i n t of one glioblastoma multiforme
is located beyond the left
edge of t h e f i g u r e at (-11.2, 22.4). A II, astrocy- toma grade II; A III, astro- cytoma grade III; GBM, glioblastoma multiforme; cNAM, contralateral nor- mal-appearing matter.
was compared with the metabolic features of the pre- vious study (with known histology). The new subjects were then assigned to the group to which the distance was smallest: healthy (HV), low-grade glioma (LG), or high-grade glioma (HG). This histological assignment by MRS and ODV was then compared with the his- tology obtained afterwards by stereotaxic biopsy.
RESULTS
Stereotaxic biopsy revealed 10 glioblastomas multi- forme (GBM), two astrocytomas grade III, and five astrocytomas grade II. Metabolic coordinates were cal- culated from the spectral results, as described above. The new cases are shown in Fig. 1 (open symbols and crosses), together with the results of the base study. All 10 GBM were nearest to the high-grade gliomas of the base study. Four of five astrocytomas grade II were assigned to the LG gliomas, one to the HG. The two astrocytomas grade III were assigned as one LG and one HG. All HV were nearest to the HV group of the base study, and contralateral normal-appearing matter of tumor patients was assigned as normal in six cases and as low grade in two cases.
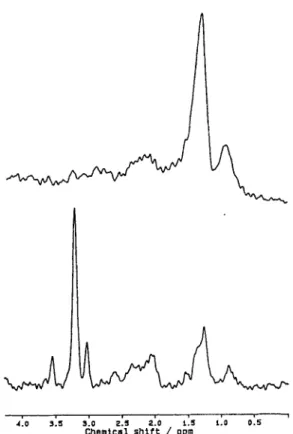
Figure 2 shows the tumor spectra of two patients
with glioblastoma multiforme. In metabolic space, the spectra shown in Fig. 2 are located at the coordinates (-11.2, 22.4) and (-3.69, 3.25), respectively (Fig. 1). Both spectra were clearly assigned to the HG gliomas, although the spectra look very different.
The patient returning for a second MRS after stereo- taxic biopsy and radiation therapy had a GBM. The spectra were located at (-2.55, 2.17) and (-2.83, 2.57) (before and after biopsy/therapy, respectively). They could be correctly assigned in both measurements to the HG group (Fig. 1).
DISCUSSION
The spectra from the glioblastoma multiforme show the largest spread within the metabolic space, indicat- ing their heterogeneous and dedifferentiated tissue. Nevertheless, all 11 investigations of GBM were as- signed correctly. Four of the five astrocytomas grade II were also assigned correctly, and the fifth was located between the features of low- and high-grade gliomas. This measurement had been performed within the cysts of a large cystic astrocytoma. Here, the integral of the choline signal was approximately as large as all of the remaining resonances together, and lipid signals
182 W ROSER et al.
Zo ,:~ s:o 2:~ ~:o i:s do o:5
Chemical s h i l l / ppm
Fig. 2. MR spectra of two different glioblastomas multi- forme. Both spectra were correctly assigned as high- grade glioma.
were also small. Thus, this case was located slightly closer to the HG group in metabolic space, inasmuch as choline has, according to equation 1, the strongest effect on the metabolic coordinates. On the other hand, the general state of the patient was not very healthy, and morphological histology, as determined by both computed tomography and MR imaging, resulted also in a high-grade glioma. Especially this case might demonstrate the problems encountered with the very limited size of stereotaxic material and thus the pos- sible usefulness of the technique presented as an ad- ditional diagnostic tool for an improved characteriza- tion of h u m a n glioma.
The assignment of the two astrocytomas grade III was most difficult. One of the astrocytomas grade III was located close to the LG group, and the other was nearer to the high-grade gliomas. At the moment we can only speculate whether this different outcome in assignment reflects the difficulties in classifying tumor histology by brain biopsy analysis or perhaps a differ- ent outcome of the patient's course.
The points of all nine HV were assigned correctly, but some were located close to the area of low-grade gliomas. This finding can be explained by the fact that the humps of lipids, proteins, and lactate were not integrated in the HV spectra of the base study. Be- MAGMA (1997) 5(3)
cause these resonances may also appear in short echo time 1H-MRS of healthy subjects [13-15], the indicated area of HV in Fig. I might have to be slightly extended to the LG area. The use of better localization sequences with shorter TE and stronger slice selection gradients to prevent lipid contamination could improve the separability of the pathology groups; these were, how- ever, not available at the time of the base study.
The use of identical measurement parameters in all investigations is crucial for the success of the pre- sented approach. The change from a main magnetic field strength of 2.0 T to 1.5 T could not be avoided in the present study, but it should have only a minor influence on the evaluated peak ratios [16]. More im- portant is the optimum choice of the volume of inter- est within the center of the tumor. The present study also clearly demonstrates that the choice of contra- or ipsilateral normal-appearing tissue as an internal ref- erence in tumor patients m a y lead to false spectral interpretations. The approach operates very well, al- though singular metabolic ratios should in principle not be used to quantitate brain metabolites [6,17].
Depending on the quantification method, absolutely quantified proton spectra of tumor tissue might be seriously influenced by altered relaxation times of the metabolites of interest. Normally, these relaxation time changes will be in the same direction for different metabolites. In this case we can partly reduce this ad- dition source of quantification error just by the use of metabolite peak ratios, as has been done in the ap- proach presented. Hence, the linear combination of metabolite peak ratios remains probably the fastest and most model-independent way to classify brain tu- mor spectra noninvasively.
CONCLUSION
Single-voxel 1H-MRS at short echo times (TE ~ 50 milliseconds) allows a differential diagnosis of glial brain tumors by the use of linear combinations of metabolic ratios plotted in a two-dimensional space. The method fails only in a few cases. A careful obser- vation of the MR images may be necessary in the cases where the assignment is ambiguous. The approach does not require a method for an absolute quantifica- tion of the metabolites if the same or very similar mea- surement parameters are used as in the base study. The change from 2.0 to 1.5 T between base and actual study had no measurable deteriorating effect on the results of the present study. The method is simple and noninvasive and can easily be performed as part of routine MR imaging within about 15 minutes. Contra- lateral normal-appearing brain matter m a y show
pathological spectra a n d s h o u l d not be taken as a ref- 9. erence in t u m o r patients.
REFERENCES
1. Negendank NW (1992) Studies of human tumors by MRS: a review. NMR Biomed 5: 303-324.
2. Bruhn H, Frahm J, Gyngell ML, Merboldt KD, Hanicke W, Sauter R, Hamburger C (1989) Noninvasive differen- tiation of tumors with use of localized H-1 MR spectros- copy in vivo: initial experience in patients with cerebral tumors. Radiology 172: 541-548.
3. Posse S, Schuknecht B, Smith ME, van Zijl PCM, Hersch- kowitz N, Moonen CTW (1993) Short echo time proton MR spectroscopic imaging. J Comput Assist Tomogr 17: 1-14.
4. Howells SL, Ma~welI RJ, Griffiths JR (1992) Classifica- tion of tumour 1H NMR spectra by pattern recognition. NMR Biomed 5: 59-64.
5. Howells SL, Maxwell RJ, Peet AC, Griffiths JR (1992) An investigation of tumor ' H nuclear magnetic resonance spectra by the application of chemometric techniques. Magn Reson Med 28: 214-236.
6. Hagberg G, Burlina AP, Mader I, Roser W, Radue EW, Seelig J (1995) In vivo proton MR of human gliomas: definition of metabolic coordinates for multi-dimension- al classification. Magn Reson Med 34;242-252.
7. Hagberg G, Mader I, Burlina AP, Roser W, Radue EW, Seelig J (1993) Cluster analysis of in vivo 1H-MR spectra of brain tumors measured with STEAM using an echotime of 50 ms (Abstract). Society of Magnetic Reso- nance in Medicine, 12th Annual Meeting, New York, vol. 2, p. 1031.
8. Fukunaga K (1990) Introduction to Statistical Pattern Rec- ognition, 2nd ed. San Diego: Academic Press.
Confort-Gouny S, Vion-Dury J, Nicoli F, Dano P, Donnet A, Grazziani N, Gastaut JL, Grisoli F, Cozzone PJ (1993) A multiparametric data analysis showing the potential of localized proton MR spectroscopy of the brain in the metabolic characterization of neurological diseases. J Neurol Sci 118: 123--133.
10. Moonen CTW, van Zijl PCM (1990) Highly effective wa- ter suppression for in vivo proton NMR spectroscopy (DRYSTEAM). J Magn Reson 88: 28-41.
11. Klose U (1990) In vivo proton spectroscopy in presence of eddy currents. Magn Reson Med 14: 26-30.
12. Hamamoto Y, Kanaoka T, Tomita S (1993) On a theoret- ical comparison between the orthonormal discriminant vector method and discriminant analysis. Pattern Recog- nition 26: 1863-1867.
13. Kauppinen RA, Niskanen T, Hakum~iki J, Williams SR (1993) Quantitative analysis of 1H NMR detected pro- teins in the rat cerebral cortex in vivo and in vitro. NMR Biomed 6: 242-247.
14. Behar KL, Rothman DL, Spencer DD, Petroff OAC (1994) Analysis of macromolecule resonances in 1H NMR spec- tra of human brain. Magn Reson Med 32: 294-302. 15. Bruhn H, Frahm J, Merboldt KD, H/inicke W, Hanefeld
F, Christen HJ, Kruse B, Bauer HJ (1992) Multiple scle- rosis in children: cerebral metabolic alterations moni- tored by localized proton magnetic resonance spectros- copy in vivo. Ann Neurol 32: 140-150.
16. Michaelis T (1992) Identifizierung und Quantifizierung von Metaboliten im menschlichen Hirn in Vivo mit Hilfe der lokalisierten NMR-Spektroskopie. Ph.D. Thesis, Uni- versity of GOttingen, Germany.
17. Mader I, Roser W, Hagberg G, Schneider M, Sauter R, Seelig J, Radd EW, Steinbrich W (1996) Clinical spectros- copy of glial brain tumors: proton CSI, metabolic maps, and single voxel spectroscopy. MAGMA 4: 139-150.