Temperature and Precipitation Affect Seasonal Patterns of Dispersing
Tobacco Thrips, Frankliniella fusca, and Onion Thrips, Thrips tabaci
(Thysanoptera: Thripidae) Caught on Sticky Traps
SHANNON C. MORSELLO,1,2RUSSELL L. GROVES,3BRIAN A. NAULT,4ANDGEORGE G. KENNEDY1
Environ. Entomol. 37(1): 79Ð86 (2008)
ABSTRACT Effects of temperature and precipitation on the temporal patterns of dispersing tobacco thrips, Frankliniella fusca, and onion thrips, Thrips tabaci, caught on yellow sticky traps were estimated in central and eastern North Carolina and eastern Virginia from 1997 through 2001. The impact that these environmental factors had on numbers of F. fusca and T. tabaci caught on sticky traps during April and May was determined using stepwise regression analysis of 43 and 38 site-years of aerial trapping data from 21 and 18 different Þeld locations, respectively. The independent variables used in the regression models included degree-days, total precipitation, and the number of days in which precipitation occurred during January through May. Each variable was signiÞcant in explaining variation for both thrips species and, in all models, degree-days was the single best explanatory variable. Precipitation had a comparatively greater effect on T. tabaci than F. fusca. The numbers of F. fusca and T. tabaci captured in ßight were positively related to degree-days and the number of days with precipitation but negatively related to total precipi-tation. Combined in a single model, degree-days, total precipitation, and the number of days with precipitation explained 70 and 55% of the total variation in the number of F. fusca captured from 1 April through 10 May and from 1 April through 31 May, respectively. Regarding T. tabaci ßights, degree-days, total precipitation, and the number of days with precipitation collectively explained 57 and 63% of the total variation in the number captured from 1 April through 10 May and from 1 April through 31 May, respectively.
KEY WORDS insect dispersal, tomato spotted wilt virus, epidemiology
Thrips infestations are known to cause economic dam-age to many crops including cabbdam-age, cotton, onion, tomato, pepper, peanut, and tobacco. Loss may be attributed directly to injury resulting from thrips feed-ing or oviposition and indirectly by transmission of plant viruses, such as Tomato spotted wilt virus (TSWV; family Bunyaviridae, genus Tospovirus) (North and Shelton 1986a, 1986b, Shelton and North 1986, Broadbent et al. 1987, German et al. 1992, Lewis 1997, Cho et al. 1995, Brecke et al. 1996, Eckel et al. 1996, Gitaitis et al. 1998, McPherson et al. 1999, Garcia et al. 2000, Nault and Speese 2002). The continual pressure of TSWV and thrips damage on the produc-tion of peanut, tobacco, and other solonaceous crops in the southeastern United States has increased inter-est in the ecology of thrips vector species (Hobbs et al. 1993, DuRant et al. 1994, Eckel et al. 1996, Prins and
Goldbach 1998, Groves et al. 2001, 2002, 2003, Wells et al. 2002, Kahn et al. 2005).
Throughout the southeastern United States, the western ßower thrips, Frankliniella occidentalis (Per-gande), and the tobacco thrips, Frankliniella fusca (Hinds), are considered important vectors of TSWV (Morgan et al. 1970, McPherson and Beshear 1990, Salguero Navas et al. 1991, Cho et al. 1995). The role of the onion thrips, Thrips tabaci Lindeman, as a com-petent vector has been disputed over the last few years (Wijkamp et al. 1995), but recent studies indicate that at least some populations transmit TSWV effectively and could play a role in the primary spread of TSWV in Europe and in the United States (Chatzivassiliou et al. 1999, 2002, Cabrera-LaRosa and Kennedy 2007). The seasonal population dynamics and dispersal of thrips vector species in the southeast and mid-Atlantic regions of the United States also have been described on several noncrop and crop host plants during the cropping season (Barbour and Brandenburg 1994, Chamberlin et al. 1992, Eckel et al. 1996, Groves et al. 2003, Kahn et al. 2005, McPherson et al. 1992, 1999, Nault et al. 2003).
In North Carolina, where F. fusca is the predomi-nant early-season vector of TSWV, both the virus and 1Department of Entomology, North Carolina State University,
Raleigh, NC 27695.
2Corresponding author, e-mail: shannon_[email protected]. 3Department of Entomology, University of Wisconsin-Madison, Madison, WI 53706.
4Department of Entomology, Cornell University, New York State Agricultural Experiment Station, 630 W. North Street, Geneva, NY 14456.
its thrips vectors overwinter on winter hosts growing in and around agricultural Þelds (Cho et al. 1995, Groves et al. 2001, 2002). Populations of F. fusca over-wintering on winter weeds typically begin to increase in April and peak in late May (Groves et al. 2001, 2003, S.C.M. and G.G.K., unpublished data). The popula-tions on crops, such as tobacco, tomato, and pepper, typically peak in late May and early June (Eckel et al. 1996). In a 4-yr study, Groves et al. (2003) observed peaks in the numbers of dispersing F. fusca adults caught on yellow sticky traps during May or early June, although the numbers of F. fusca varied among locations and years. They also observed that the sea-sonal patterns of TSWV-spread corresponded with the number of F. fusca caught on yellow sticky traps. Factors affecting the numbers of F. fusca caught on yellow sticky traps during the period when they are dispersing from their winter hosts and infest crops have not been quantiÞed.
Temperature and rainfall have long been viewed as major factors affecting population dynamics of thrips. Davidson and Andrewartha (1948b) re-ported that the abundance of adult Thrips imaginis Bagnall found in ßowers during spring was deter-mined largely by natural population growth, the inßuence of weather throughout the season on thrips multiplication rate, and the inßuence of cur-rent weather on thrips activity. Temperature inßu-ences population dynamics principally because it affects the developmental rate of insects (Logan et al. 1976). Rainfall tends to negatively affect thrips populations (Bailey 1933, 1934) because heavy pre-cipitation events can kill larvae (Kirk 1997) and suppress dispersal (Lewis 1963). In contrast, rainfall may positively impact thrips population growth and dispersal by delaying senescence of host plants (S.C.M. and G.G.K., unpublished data), allowing more time for thrips to proliferate and ultimately colonize crops. Based on these studies, we would expect dispersing thrips populations to be positively affected by increasing temperature and negatively affected by heavy rainfall throughout the spring. However, we also expect the negative effect of heavy rainfall might be at least partially offset by a positive effect of frequent rain resulting from de-layed senescence of noncrop hosts.
Our study was conducted to determine and quan-tify the effects of temperature and rainfall on the numbers of F. fusca and T. tabaci caught on yellow sticky traps in spring. Frankliniella occidentalis was not included in our analyses because too few spec-imens were collected. Using thrips aerial trapping data collected during the spring seasons of 1997 through 2001, we evaluated the inßuence of tem-perature (developmental degree-days), the amount of precipitation, and the number of days in which precipitation occurred on the numbers of F. fusca and T. tabaci caught on our traps during the period 1 April through 31 May, when the populations are dispersing from their winter hosts and infest sum-mer hosts, including newly planted crops.
Materials and Methods
Aerial Trap Collection. From 1997 to 2001, thrips spring dispersal was monitored along Þeld borders at 21 locations in central and eastern North Carolina and eastern Virginia. Trapping was initiated before the crops were planted. In North Carolina, the Þelds were planted to tobacco, soybean, or cotton during the trapping period. In Virginia, the Þelds were planted to tomato (Fig. 1). Traps in North Carolina consisted of cylindrical yellow (John Deere Yellow model 981; Spray Products, Norristown, PA) PVC pipe (7.5 cm length by 2.5 cm diameter) wrapped with Tanglefoot-coated plastic wrap (Great Lakes Integrated Pest Management, Vestaburg, MI) and fastened to a wooden dowel 1 m above the soil. At each location, four traps, separated by 10 m, were arranged in a linear pattern along one side of the Þeld to avoid interference with any cultural prac-tices. Any vegetation within an area of ⬇0.4 m2
surrounding each trap was removed. Between 1 April and 31 May, traps were replaced at⬇7-d in-tervals. Recovered traps were returned to the lab-oratory where the coated plastic was removed from the PVC cylinder and sandwiched between two pieces of transparent plastic wrap (S.C. Johnson & Son, Racine, WI) (Groves et al. 2003).
In Virginia, yellow sticky cards (7.6 cm by 12.7 cm, both sides exposed) were fastened to trellis supports in the center of tomato Þelds and adjusted weekly to the height of the canopy. At each Þeld location, cards were placed in three rows, and the middle row had one card and was ßanked by rows that each had two cards (Þve cards total). Rows containing cards were sepa-rated by⬎10 m. All cards were within 20 m of Þeld edges. Traps were replaced at 7-d intervals and re-turned to the laboratory for processing (Nault et al. 2003). Data from Virginia traps were multiplied by 0.31 per trap to adjust for the larger surface area of the traps used in Virginia.
Thrips Identification. When 25 or fewer adult thrips per trap were collected on a trap, all thrips were identiÞed to species. When there were⬎25 thrips on a trap, the total number of adult thrips was counted, and a random subsample of 25 thrips was removed for identiÞcation to species. The propor-tion of each species within the subsample was mul-tiplied by the total number of thrips captured on that trap to estimate the total number of each spe-cies present on the trap. Individual thrips recovered for identiÞcation were removed from the plastic wrap by soaking in HistoClear solvent (National Diagnostics, Atlanta, GA) for 10 min. A microscope slide was prepared for each trap collection (ⱕ25 thrips per slide) using CMC-10 (Masters Chemical Co., Elk Grove, IL) as a clearing and mounting medium. Species of adult thrips mounted on slides were determined using a key to adult thrips of Tere-brantia suborder (Palmer et al. 1992). Voucher specimens are held at the North Carolina State Uni-versity museum and Eastern Shore Agricultural Re-search and Extension center near Painter.
Weather Data. All sites were assigned weather data based on proximity to the nearest National Oceanic and Atmospheric Administration (NOAA; http://cdo.ncdc.noaa.gov/dly/DLY) weather
sta-tion (Table 1; Fig. 1). Daily degree-day data were estimated by averaging daily high and low temper-ature observations and subtracting the lower devel-opmental threshold values of 10.5⬚C for F. fusca and
Fig. 1. Aerial trap collection intervals for the 21 sample sites and locations of the NOAA weather stations in central and eastern North Carolina and eastern Virginia. Value in parentheses corresponds to the position on the map. **Thrips tabaci was not collected at these sites.
11.5⬚C for T. tabaci (Edelson and Magaro 1988, Lowry et al. 1992).
{(Daily high T [⬚C] ⫹ Daily low T [⬚C])/2}
⫺ Developmental Threshold (⬚C) ⫽ DD (for day) Degree-days were summed from 1 January through 10 May and from 1 January through 31 May each year at each weather station. The date 10 May was chosen because most spring planted crops at risk from F. fusca or TSWV are planted by this time and would be vul-nerable to infestation and TSWV. Additionally, the number of dispersing F. fusca and T. tabaci would still be increasing. The date 31 May also was chosen be-cause the majority of the spring dispersal of F. fusca has generally occurred in North Carolina (Groves et al. 2003). Recorded precipitation was summed as total precipitation and as the number of days with precip-itation from 1 January through 10 May and from 1 January through 31 May. Total precipitation and the number of days with precipitation data were analyzed for correlation to determine whether both could be included as independent variables in a regression anal-ysis with the total number of F. fusca and T. tabaci as the dependent variable using SAS for Windows (ver-sion 9.1; PROC CORR; SAS Institute 2005). No sig-niÞcant correlation was detected between total pre-cipitation and the number of days with prepre-cipitation in data used for F. fusca and T. tabaci analyses (r⫽ 0.212, N⫽ 44, P ⫽ 0.166 and r ⫽ 0.206, N ⫽ 29, P ⫽ 0.284, respectively).
Regression Analysis. For each species on each sam-pling date, the total number of thrips was averaged across all traps located within a site. For each site, the number of F. fusca and T. tabaci captured between 1 April and 10 May and 1 April and 31 May were re-corded. In some years and at some sites, T. tabaci were not identiÞed or not collected; consequently, only 38
site-years of data (18 sites) were used in the analyses for T. tabaci. Frankliniella fusca were captured at all sites (21) in all years, resulting in 43 site-years of data, all of which were included in the analyses for F. fusca. Data on the total number of dispersing thrips were log-transformed, based on an inspection of residuals (SAS 9.1; PROC PLOT; SAS Institute 2005), to stabi-lize variance before stepwise regression. Stepwise re-gression (SAS 9.1; PROC REG; SAS Institute 2005) was used to test for relationships between the total number of F. fusca or T. tabaci captured between 1 April and 10 May and 1 April and 31 May and the independent variables degree-days, total precipitation, and the number of days with precipitation from 1 January to 10 May and 1 January to 31 May, respectively.
Results
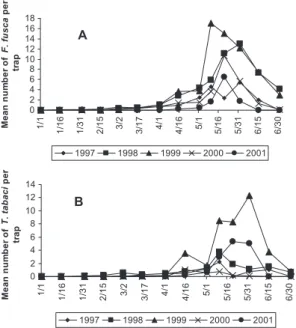
Seasonal aerial trapping from 1997 through 2001 showed very little movement of both F. fusca and T.
tabacifrom January through March of each year (Fig. 2, A and B). During early April and May, movement increased for either F. fusca or T. tabaci and, on av-erage, peaked between 10 and 31 May each year. The magnitude and the timing of the peak ßights varied greatly among individual sites and years.
Frankliniella fusca. Seventy percent of the total variation in the number of F. fusca adults captured between 1 April and 10 May each year was explained by a regression model that included degree-days (DD), total precipitation (PRECIP), and the number of days with precipitation (DP) as independent vari-ables (F⫽ 30.50; df ⫽ 3, 40; P ⫽ ⬍0.001; Table 2) in the following equation:
Ln F. fusca (1 April Ð 10 May) count⫽ 0.013(DD) Ð 0.045(PRECIP)⫹ 0.060(DP) Ð 3.831
Table 1. NOAA weather stations and trapping intervals for all 21 collection sites
Station
no. State County Station name Nearest city
Distance from station
Site
no. Sites Year
1 NC Wake Raleigh State Raleigh 9.0 mi S 1 Balla 1997
2 NC Johnston SmithÞeld Angier 14.2 mi W 2 Parsona 1997
2 NC Johnston SmithÞeld Angier 17.2 mi W 3 Fish 1997Ð1999
2 NC Johnston SmithÞeld Angier 13.0 mi W 4 Jonesa 1997Ð1999
2 NC Harnett SmithÞeld Angier 21.1 mi W 5 Hone 1998Ð1999
3 NC Granville Oxford AG Oxford ⬍1.0 mi N 6 Oxford 1998Ð1999
4 NC Onslow Hofmann Forest Maysville ⬍1.0 mi S 7 Mays 1998Ð2000
4 NC Jones Hofmann Forest Pollocksville 5.1 mi N 8 Poll 1998Ð2000
5 NC Duplin Willard 4 SW Wallace 12.3 mi E 9 Lawt 1998Ð1999
5 NC Duplin Willard 4 SW Wallace 10.7 mi NE 10 Light 1998Ð2000
5 NC Pender Willard 4 SW Wallace 12.8 mi E 11 Holl 1999Ð2000
5 NC Duplin Willard 4 SW Wallace 12.0 mi NE 12 Shol 2000
6 VA Accomack Painter 2W Melfa 1.0 mi NW 13 Bob 2001
6 VA Accomack Painter 2W Melfa 6.0 mi SE 14 Cust 2000Ð2001
6 VA Accomack Painter 2W Melfa 14.0 mi SE 15 Mach 2000Ð2001
6 VA Accomack Painter 2W Melfa 1.8 mi SW 16 Mar 2000Ð2001
6 VA Accomack Painter 2W Melfa 15.5 mi SE 17 New2 2000Ð2001
6 VA Accomack Painter 2W Melfa 15.0 mi SE 18 New7 2000Ð2001
7 VA Accomack Wallops Parksley 6 mi SW 19 Buzz 2000Ð2001
7 VA Accomack Wallops Parksley 9 mi S 20 Park 2000Ð2001
7 VA Accomack Wallops Parksley 6.5 mi SW 21 Somm 2000Ð2001
Degree-days alone accounted for 61% of the total variation, PRECIP explained an additional 5%, and DP explained the Þnal 4%. The total number of F. fusca captured between 1 April and 10 May was positively related to DD and DP but negatively related to PRECIP from 1 January to 10 May.
Results for the number of F. fusca adults captured between 1 April and 31 May were similar to those captured between 1 April and 10 May except that the regression model explained only 55% of the total vari-ation (F⫽ 16.39; df ⫽ 3, 40; P ⫽ ⬍0.001; Table 2). The estimated regression equation is as follows:
Ln F. fusca (1 April Ð 31 May) count⫽ 0.007(DD) Ð 0.034(PRECIP)⫹ 0.040(DP) Ð 1.531 Degree-days alone accounted for 46% of the total variation, PRECIP explained an additional 5%, and DP explained the Þnal 4%. The total number of F. fusca
captured between 1 April and 31 May was positively related to total DD and DP but negatively related to PRECIP from 1 January to 31 May.
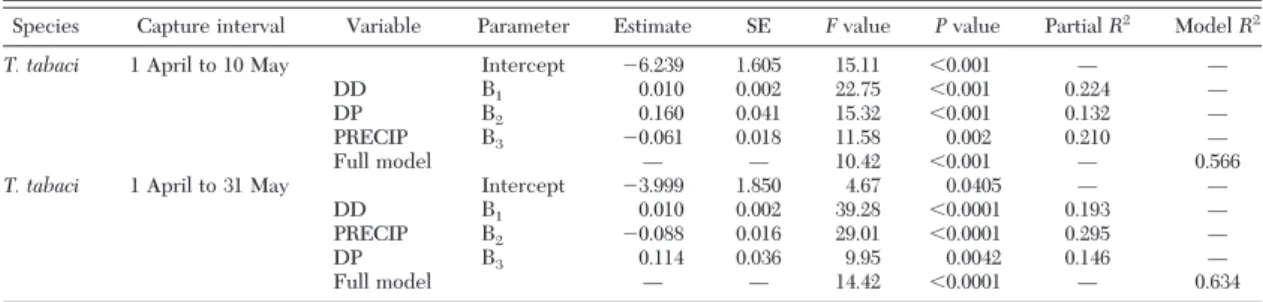
Thrips tabaci. Fifty-seven percent of the total vari-ation in the number of T. tabaci adults captured be-tween 1 April and 10 May each year was explained by a regression model that included DD, PRECIP, and DP as independent variables (F⫽ 10.42; df ⫽ 3, 24; P ⫽ ⬍0.001; Table 3) in the following equation:
Ln T. tabaci (1 April Ð 10 May) count⫽ 0.010(DD) ⫹ 0.160(DP) Ð 0.061(PRECIP) Ð 6.239 Degree-days alone accounted for 22% of the total vari-ation, DP explained an additional 13%, and PRECIP ex-plained the Þnal 21%. The total number of T. tabaci captured between 1 April and 10 May was positively related to total DD and DP but negatively related to PRECIP from 1 January to 10 May.
Results for the number of T. tabaci adults captured between 1 April and 31 May from 38 site-years of data were similar to those captured between 1 April and 10 May, except now the regression model explained 63% of the total variation (F⫽ 14.42; df ⫽ 3, 25; P ⫽ ⬍0.001; Table 3). The estimated regression equation is as fol-lows:
Ln T. tabaci (1 April Ð 31 May) count⫽ 0.010(DD) Ð 0.088(PRECIP)⫹ 0.114(DP) Ð 3.999 Degree-days alone accounted for 19% of the total variation, PRECIP explained an additional 29%, and DP explained the Þnal 15%. The total number of T.
tabacicaptured between 1 April and 31 May was pos-itively related to total DD and DP but negatively related to PRECIP from 1 January to 31 May.
Discussion
In our study from 1997 to 2001, the numbers of dispersing F. fusca and T. tabaci caught on yellow sticky traps in spring peaked, on average, between 10 and 31 May each year (Fig. 2, A and B). This is con-sistent with previous surveys that have described thrips populations as smaller during the winter, in-creasing rapidly with large peak ßights during the spring, followed by an abrupt decline in numbers associated with senescence of winter hosts (Davidson 0 2 4 6 8 10 12 14 16 18 1/1 1/16 1/31 2/15 3/2 3/17 4/1 4/16 5/1 5/16 5/31 6/15 6/30 Me an n um be r o f F. fu sc a pe r tr ap 1997 1998 1999 2000 2001 0 2 4 6 8 10 12 14 1/ 1 1/16 1/31 2/15 3/ 2 3/17 4/ 1 4/16 5/ 1 5/16 5/31 6/15 6/30 Me an n um be r o f T. ta ba ci pe r tr ap 1997 1998 1999 2000 2001 A B
Fig. 2. Mean number of (A) F. fusca captured at each date over 21 Þeld locations and (B) T. tabaci captured at each date over 18 Þeld locations in central and eastern North Carolina and eastern Virginia from 1997 through 2001. Values are means across all sites within a year.
Table 2. Regression statistics for populations of F. fusca related to degree-days (DD), total precipitation (PRECIP), and days with
precipitation (DP)
Species Capture interval Variable Parameter Estimate SE Fvalue Pvalue Partial R2
Model R2
F. fusca 1 April to 10 May Intercept ⫺3.831 1.065 12.94 ⬍0.001 Ñ Ñ
DD 〉1 0.013 0.001 82.05 ⬍0.001 0.607 Ñ
PRECIP 〉2 ⫺0.045 0.014 10.22 0.003 0.047 Ñ
DP 〉3 0.060 0.025 5.58 0.023 0.042 Ñ
Full model Ñ Ñ 30.50 ⬍0.001 Ñ 0.696
F. fusca 1 April to 31 May Intercept ⫺1.531 1.167 1.72 0.197 Ñ Ñ
DD 〉1 0.007 0.001 44.66 ⬍0.001 0.464 Ñ
PRECIP 〉2 ⫺0.034 0.013 7.27 0.010 0.051 Ñ
DP 〉3 0.040 0.022 3.29 0.077 0.037 Ñ
and Andrewartha 1948b, Andrewartha and Birch 1954, North and Shelton 1986 a, b, Shelton and North 1986, McPherson et al. 1992, DuRant et al. 1994, Cho et al. 1995, Eckel et al. 1996, Gitaitis et al. 1998, Moriones et al. 1998, Groves et al. 2003).
The varying number of thrips captured on yellow sticky traps throughout the spring season is, no doubt, inßuenced by many factors beyond weather, includ-ing trap attractiveness relative to surroundinclud-ing vege-tation, host plant composition, thrips population size and proportion of the population that is dispersing, behavior, and agricultural practices. However, long-term weather variables are able to explain a majority of the year to year and location to location variation observed in spring trap catches spanning nearly 300 miles from north to south and 150 miles from west to east over a 5-yr period in Virginia and North Carolina, despite of the collective impact of any other factors. Regression analyses determined that temperature, measured as degree-days accumulated from 1 January, was the single most inßuential factor positively affect-ing F. fusca and T. tabaci populations. Presumably, increasing temperatures in the spring inßuenced both thrips population growth rate and the suitability of their winter annual host plants by affecting when the plants senesce. Degree-days accumulated between 1 January and 10 May explained 61% of the variation about the total number of F. fusca captured between 1 April and 10 May. When the trapping interval was extended to 31 May, degree-days was still the single best explanatory variable, explaining 46% of the total variation in F. fusca captures. The 15% reduction in explanatory power reßects the fact that degree-days continued to accumulate throughout the period of analysis, but in some years and locations, thrips trap catches peaked and began to declined before 31 May; therefore, the power of cumulative degree-days to estimate the total number of adult F. fusca declines after the population peaks. Although degree-days summed from 1 January was also the best explanatory variable for the number of T. tabaci captured between 1 April and 10 May and 1 April and 31 May, it explained only 22 and 19%, respectively. Part of the disparity between the power of degree-days to explain variation in captures of dispersing F. fusca and T. tabaci in spring may result from differences in the host plant prefer-ences of these two species. Groves et al. (2002) ob-served that spring dispersal of T. tabaci in eastern
North Carolina occurred over a longer period of time and extended later into the spring than was the case for F. fusca. Moreover, reproducing populations of T.
tabacioccurred on fewer plant species than F. fusca, with the majority of immature T. tabaci collected from biennial or perennial plant species that are less likely to senesce in response to increasing springtime tem-peratures than winter annual species, which are the predominant winter and spring hosts of F. fusca. Therefore, to the extent that yellow sticky trap catches reßect the size of the dispersing thrips population, it is possible that the observed effect of temperature on spring dispersal of T. tabaci primarily reßects the di-rect effect of temperature on population growth rate, whereas the effect of temperature on F. fusca reßects not only its inßuence on population growth rate but also a strong effect on the timing of host plant senes-cence.
In these models, both the amount and frequency of precipitation were important. The total number of F.
fuscaand T. tabaci captured were negatively affected by total precipitation but positively affected by the number of days with precipitation. We expected these results based on previous studies. Hard or prolonged precipitation events can kill young thrips larvae and depress the population (Kirk 1997), as well as suppress dispersal of adult thrips (Lewis 1963). In contrast, precipitation can promote plant growth and delay senescence of winter hosts, allowing for increased production of thrips over a longer period (S.C.M. and G.G.K., unpublished data).
Precipitation had a relatively greater effect on T.
tabaci than F. fusca. The combined effects of total precipitation and the number of days with precipita-tion accounted for only 9% of the total variaprecipita-tion in the
F. fuscamodels versus 34 Ð 44% of the total variation explained by the T. tabaci models. After accounting for the effect of degree-days in both F. fusca models, total precipitation and the number of days with precipita-tion accounted for an addiprecipita-tional 5 and 4% of the total variation, respectively. After accounting for the effect of degree-days in the regression model for the total number of T. tabaci captured between 1 April and 10 May, the number of days with precipitation explained an additional 13% and total precipitation explained the Þnal 21% of the total variation. In the regression model for the total number of T. tabaci captured between 1 April and 31 May, total precipitation explained an
Table 3. Regression statistics for populations of T. tabaci related to degree-days (DD), total precipitation (PRECIP), and days with
precipitation (DP)
Species Capture interval Variable Parameter Estimate SE Fvalue Pvalue Partial R2
Model R2
T. tabaci 1 April to 10 May Intercept ⫺6.239 1.605 15.11 ⬍0.001 Ñ Ñ
DD 〉1 0.010 0.002 22.75 ⬍0.001 0.224 Ñ
DP 〉2 0.160 0.041 15.32 ⬍0.001 0.132 Ñ
PRECIP 〉3 ⫺0.061 0.018 11.58 0.002 0.210 Ñ
Full model Ñ Ñ 10.42 ⬍0.001 Ñ 0.566
T. tabaci 1 April to 31 May Intercept ⫺3.999 1.850 4.67 0.0405 Ñ Ñ
DD 〉1 0.010 0.002 39.28 ⬍0.0001 0.193 Ñ
PRECIP 〉2 ⫺0.088 0.016 29.01 ⬍0.0001 0.295 Ñ
DP 〉3 0.114 0.036 9.95 0.0042 0.146 Ñ
additional 29%, and the number of days with precip-itation explained the Þnal 15% of the total variation, after accounting for the effect of degree-days.
Temperature and precipitation have varying effects on thrips populations. With increasing temperature throughout the spring, there is increased thrips activ-ity, development, and population growth up to the point when winter hosts begin to senesce and thrips ßights decline (Lowry et al. 1992, Lewis 1997, Kirk 1997). Dry weather favors thrips population growth (Bailey 1933, 1934, 1944, Fennah 1965, Evans 1967). Franssen and Huisman (1958) reported that infesta-tions of Thrips angusticeps Uzel during rainy and cool seasons were signiÞcantly lower than those during dry and hot seasons, presumably because of high larval mortality and slower population growth rates (Kirk 1997). Warm temperatures may be required before thrips ßight can occur. Lewis (1963) described a tem-perature threshold for take-off by Limothrips
cerea-lium(Haliday) that was above their developmental threshold. In this situation, large populations of thrips can develop during spring while temperatures ßuctu-ate between developmental and ßight thresholds. Once temperature increases above the ßight thresh-old, thrips dispersal may occur en masse. However, direct rain or heavy dew can prevent thrips take-off as their wing setae become saturated (Kirk 1997), de-spite conducive temperatures for ßight. Thrips pop-ulations tend to recover slowly after rain events be-cause of high larval mortality, but adults and late stage juveniles, after maturity, will ultimately ßy when en-vironmental conditions become favorable again (Cho et al. 1989, Kirk 1997, Lewis 1997, Groves et al. 2001). As suggested by our models, a portion of the negative effect of precipitation can be offset by the positive effects on host plants, including delayed senescence of winter hosts, enabling them to provide a suitable hab-itat for thrips growth and reproduction over a longer period.
Groves et al. (2003) previously reported temporal similarities between the numbers of dispersing F. fusca caught on yellow sticky traps and the spread of TSWV in eastern North Carolina. Our results showing that temperature and precipitation variables account for 55 and 63% of the variation in the total number of dis-persing F. fusca and T. tabaci caught on yellow sticky traps in spring suggests that it may be possible to develop weather-based models to predict the near-term risk of thrips ßights and TSWV, although addi-tional research is needed. Because our analyses indi-cate that speciÞc weather variables affect thrips species differently, species-speciÞc models that in-clude degree-days, amount of rainfall, the number of rainfall events, and perhaps other variables would have to be developed. Weather-based models based on the work of Davidson and Andrewartha (1948a, 1948b) and incorporating a more complex set of weather variables have been used with success as part of an early-warning system to predict damaging pop-ulations of thrips in apples in the Adelaide Hills area of Australia (Kirk 1997).
Acknowledgments
Assistance with statistical analyses by C. Brownie (De-partment of Statistics, North Carolina State University) was greatly appreciated. This work was supported, in part, by the E. G. Moss and Phillip Morris Foundations and grants from the North Carolina Tobacco Research Commission and USDA Southern Regional IPM Program.
References Cited
Andrewartha, H. G., and L. C. Birch. 1954. The distribution and abundance of animals. University Chicago Press, Chi-cago, IL.
Bailey, S. F. 1933. The biology of the bean thrips. Hilgardia 7: 467Ð522.
Bailey, S. F. 1934. A winter study of the onion thrips in California. CADA Bull. 23: 149 Ð152.
Bailey, S. F. 1944. The pear thrips in California. University of California, College of Agriculture, Agricultural Exp. Station Bull. 687.
Barbour, J. D., and R. L. Brandenburg. 1994. Vernal infu-sion of thrips into North Carolina peanut Þelds. J. Econ. Entomol. 87: 446 Ð 451.
Brecke, B. J., J. E. Funderburk, I. D. Teare, and D. W. Gorbet. 1996. Interaction of early-season herbicide injury, to-bacco thrips injury, and cultivar on peanut. Agron. J. 88: 14 Ð18.
Broadbent, A. B., W. R. Allen, and R. G. Foottit. 1987. The association of Frankliniella occidentalis (Pergrande) (Thysanoptera: Thripidae) with greenhouse crops and the tomato spotted wilt virus in Ontario. Can. Entomol. 119: 501Ð503.
Cabrera-LaRosa J. C., and G. G. Kennedy. 2007. Thrips tabaciand tomato spotted wilt virus: inheritance of vector competence. Entomol. Exp. Appl. 124: 161Ð166. Chamberlin, J. R., J. W. Todd, R. J. Beshear, A. K. Culbreath,
and J. W. Demski. 1992. Overwintering hosts and wing-form of thrips, Frankliniella spp., in Georgia (Thysan-optera: Thripidae): implications for management of spot-ted wilt disease. Environ. Entomol. 21: 121Ð128. Chatzivassiliou, E. K., T. Nagata, N. I. Katis, and D. Peters.
1999. Transmission of tomato spotted wilt tospovirus by
Thrips tabaci populations originating from leek. Plant
Pathol. 48: 700 Ð706.
Chatzivassiliou, E. K., D. Peters, and N. I. Katis. 2002. The efÞciency by which Thrips tabaci populations transmit
Tomato spotted wilt virusdepends on their host
prefer-ence and reproductive strategy. Phytopathology 92: 603Ð 609.
Cho, J. J., R.F.L. Mau, T. L. German, R. W. Hartmann, L. S. Yudin, D. Gonsalves, and R. Provvidenti. 1989. A mul-tidisciplinary approach to management of tomato spotted wilt virus in Hawaii. Plant Dis. 73: 375Ð383.
Cho, K., C. S. Eckel, J. F. Walgenbach, and G. G. Kennedy. 1995. Overwintering of thrips (Thysanoptera: Thripi-dae) in North Carolina. Environ. Entomol. 24: 58 Ð 67. Davidson, J., and H. G. Andrewartha. 1948a. Annual trends
in a natural population of Thrips imaginis (Thysan-optera). J. Anim. Ecol. 17: 193Ð199.
Davidson, J., and H. G. Andrewartha. 1948b. The inßuence of rainfall, evaporation and atmospheric temperature on ßuctuations in the size of a natural population of Thrips
imaginis(Thysanoptera). J. Anim. Ecol. 17: 200 Ð222.
DuRant, J. A., M. E. Roof, and C. L. Cole. 1994. Early season incidence of thrips (Thysanoptera) on wheat, cotton, and three wild host plant species in South Carolina. J. Agric. Entomol. 11: 61Ð71.
Eckel, C. S., K. Cho, J. F. Walgenbach, G. G. Kennedy, and J. W. Moyer. 1996. Variation in thrips species composi-tion in Þeld crops and implicacomposi-tions for tomato spotted wilt epidemiology in North Carolina. Entomol. Exp. Appl. 78: 19 Ð29.
Edelson, J. V., and J. J. Magaro. 1988. Development of onion thrips, Thrips tabaci Lindeman, as a function of temper-ature. Southwest. Entomol. 13: 171Ð176.
Evans, D. E. 1967. Insecticide Þeld trials against the coffee thrips (Diarthrothrips coffeae Williams) in Kenya. Turri-alba 17: 376 Ð380.
Fennah, R. G. 1965. The inßuence of environmental stress on the cacao tree in predetermining the feeding sites of the cacao thrips, Selenothrips rubrocinctus (Giard) on leaves and pods. Bull Entomol. Res. 56: 333Ð349. Franssen, C.J.H., and P. Huisman. 1958. The biology and
control of Thrips angusticeps Uzel. (In Dutch.) Verslagen Landbouwkundige Onderzoekingen 64: 1Ð104. Garcia, L. E., R. L. Brandenburg, and J. E. Bailey. 2000.
Incidence of tomato spotted wilt virus (Bunyaviridae) and tobacco thrips in Virginia-type peanuts in North Carolina. Plant Dis. 84: 459 Ð 464.
German, T. L., D. E. Ullman, and J. W. Moyer. 1992. To-spoviruses: diagnosis, molecular biology, phylogeny, and vector relationships. Annu. Rev. Phytopathol. 30: 315Ð 348.
Gitaitis, R. D., C. C. Dowler, and R. B. Chalfant. 1998. Ep-idemiology of tomato spotted wilt in pepper and tomato in southern Georgia. Plant Dis. 82: 752Ð756.
Groves, R. L., J. F. Walgenbach, J. W. Moyer, and G. G. Kennedy. 2001. Overwintering of Frankliniella fusca (Thysanoptera: Thripidae) on winter annual weeds in-fested with tomato spotted wilt virus and patterns of virus movement between susceptible hosts. Phytopathology 91: 891Ð 899.
Groves, R. L., J. F. Walgenbach, J. W. Moyer, and G. G. Kennedy. 2002. The role of weed hosts and tobacco thrips, Frankliniella fusca, in the epidemiology of tomato spotted wilt virus. Plant Dis. 86: 573Ð582.
Groves, R. L., J. F. Walgenbach, J. W. Moyer, and G. G. Kennedy. 2003. Seasonal dispersal patterns of
Fran-kliniella fusca (Thysanoptera: Thripidae) and tomato
spotted wilt virus occurrence in central and eastern North Carolina. J. Econ. Entomol. 96: 1Ð11.
Hobbs, H. A., L. L. Black, R. N. Story, R. A. Valverde, W. P. Bond, J. M. Gratti Jr., D. O. Schaeffer, and R. R. Johnson. 1993. Transmission of tomato spotted wilt virus from pepper and three weed hosts by Frankliniella fusca. Plant Dis. 77: 797Ð799.
Kahn, N. D., J. F. Walgenbach, and G. G. Kennedy. 2005. Summer weeds as hosts for Frankliniella occidentalis and
Frankliniella fusca(Thysanoptera: Thripidae) and as
res-ervoirs for tomato spotted wilt tospovirus in North Caro-lina. J. Econ. Entomol. 98: 1810 Ð1815.
Kirk, W.D.J. 1997. Distribution, abundance and population dynamics. In T. Lewis (ed.), Thrips as crop pests. CAB, Oxon, United Kingdom, pp. 217Ð257.
Lewis, T. 1963. The effect of weather on emergence and take-off of overwintering Limothrips cerealium Haliday (Thysanoptera). Ann. Appl. Biol. 51: 489 Ð502. Lewis, T. 1997. Flight and dispersal. In T. Lewis (ed.),
Thrips as crop pests. CAB, Oxon, United Kingdom, pp. 175Ð196.
Logan, J. A., D. J. Wolkind, S. C. Hoyt, and L. K. Tanigoshi. 1976. An analytical model for description of temperature
dependent rate phenomena in arthropods. Environ. Entomol. 5: 1130 Ð1140.
Lowry, V. K., J. W. Smith, and F. L. Mitchell. 1992. Life-fertility tables for Frankliniella fusca (Hinds) and F.
oc-cidentalis(Pergande) (Thysanoptera: Thripidae) on
pea-nut. Ann. Entomol. Soc. Am. 85: 744 Ð754.
McPherson, R. M., and R. J. Beshear. 1990. Thrips fauna in Georgia ßue-cured tobacco plant beds and Þelds. J. En-tomol. Sci. 25: 559 Ð561.
McPherson, R. M., R. J. Beshear, and A. K. Culbreath. 1992. Seasonal abundance of thrips (Thysanoptera: Suborders Terebrantia and Tubulifera) in Georgia ßue-cured to-bacco and impact of management on the incidence of tomato spotted wilt virus. J. Entomol. Sci. 27: 257Ð268. McPherson, R. M., H. R. Pappu, and D. C. Jones. 1999.
Occurrence of Þve thrips species on ßue-cured tobacco and impact on spotted wilt disease incidence in Georgia. Plant Dis. 83: 765Ð767.
Morgan, L. W., J. W. Snow, and M. J. Peach. 1970. Chemical thrips control; effects on growth and yield of peanuts in Georgia. J. Econ. Entomol. 63: 1253Ð1255.
Moriones, E., J. Aramburu, J. Riudavats, J. Arno, and A. Lavina. 1998. Effect of plant age at time of infection by tomato spotted wilt tospovirus on the yield of Þeld-grown tomato. Eur. J. Plant Pathol. 104: 295Ð300.
Nault, B. A., and J. Speese, III. 2002. Major insect pests and economics of fresh-market tomato in eastern Virginia. Crop Prot. 21: 359 Ð366.
Nault, B. A., J. Speese, III, D. Jolly, and R. L. Groves. 2003. Seasonal patterns of adult thrips dispersal and implica-tions for management in eastern Virginia tomato Þelds. Crop Prot. 22: 505Ð512.
North, R. C., and A. M. Shelton. 1986a. Colonization and intraplant distribution of Thrips tabaci (Thysanoptera: Thripidae) on cabbage. J. Econ. Entomol. 79: 219 Ð223. North, R. C., and A. M. Shelton. 1986b. Ecology of
Thysan-optera within cabbage Þelds. Environ. Entomol. 15: 520Ð526. Palmer, J. M., L. A. Mound, and G. J. du Haeume. 1992. IIE guides to insects of importance to man, vol. 2. Thysan-optera In C. R. Betts (ed.), International Institute of Entomology. CAB International, Wallingford, United Kingdom, 73 pp.
Prins, M., and R. Goldbach. 1998. The emerging problem of Tospovirus infection and nonconventional methods of control. Trends Microbiol. 6: 31Ð35.
Salguero Navas, V. E., J. E. Funderburk, R. J. Beshear, S. M. Olson, and T. P. Mack. 1991. Seasonal patterns of
Fran-kliniellaspp. (Thysanoptera: Thripidae) in tomato
ßow-ers. J. Econ. Entomol. 84: 1818 Ð1822.
SAS Institute. 2005. SAS 9.1.3 intelligence platform: single-user installation guide. SAS Institute, Cary, NC. Shelton, A. M., and R. C. North. 1986. Species composition
and phenology of Thysanoptera within Þeld crops adja-cent to cabbage Þelds. Environ. Entomol. 15: 513Ð519. Wells, M. L., A. K. Culbreath, J. W. Todd, A. S. Csinos, B.
Mandal, and R. M. McPherson. 2002. Dynamics of spring tobacco thrips (Thysanoptera: Thripidae) populations: implications for tomato spotted wilt virus management. Environ. Entomol. 31: 1282Ð1290.
Wijkamp, I., N. Almazara, R. Goldbach, and D. Peters. 1995. Distinct levels of speciÞcity in thrips transmission of to-spoviruses. Phytopathology 85: 1069 Ð1074.
Received for publication 5 April 2007; accepted 11 September 2007.