A
daf-16;let-418 let-418 let-418C
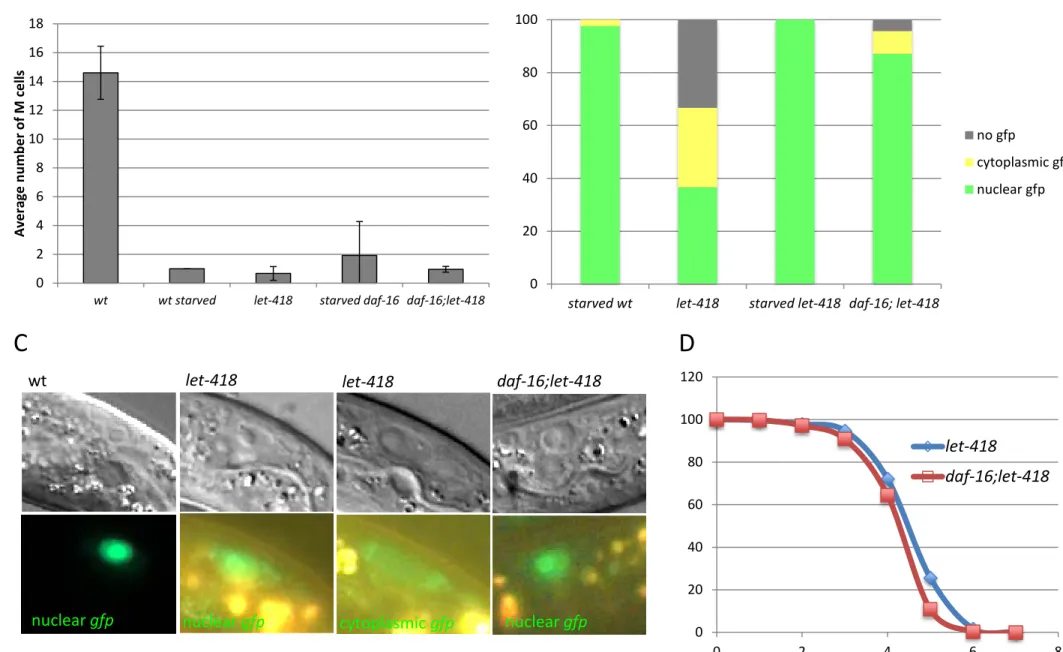
nuclear gfp nuclear gfp cytoplasmic gfp 0 20 40 60 80 100starved wt let-418 starved let-418 daf-16; let-418
no gfp
cytoplasmic gfp nuclear gfp
Figure S1 : daf-16 – let-418 genetic interaction. (A) Number of M cell descendants was scored in the indicated
genotypes. (B) hlh-8::gfp expression was monitored in the indicated genotypes and the pattern of gfp expression was scored according to the DIC and fluorescent pictures in (C). (D) Survival assay of the indicated genotypes in fed conditions.
nuclear gfp wt 0 2 4 6 8 10 12 14 16 18
wt wt starved let-418 starved daf-16 daf-16;let-418
Av era ge n umb er of M ce lls
B
0 20 40 60 80 100 120 0 2 4 6 8 let-418 daf-16;let-418D
0% 20% 40% 60% 80% 100% adult > early L1 L1
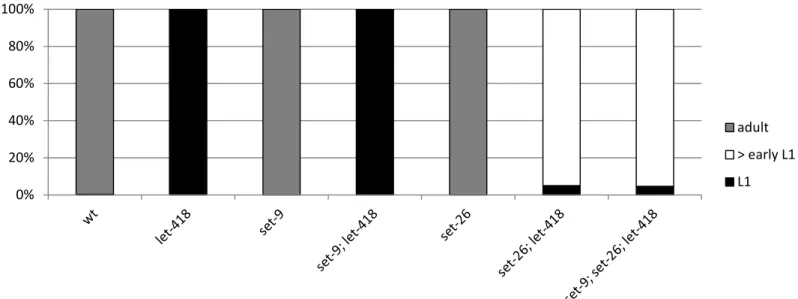
Figure S2: Lack of set-26 activity suppresses the developmental arrest of let-418 mutant. set-26 and set-9 exhibit 97% sequence identity at the level of the nucleotide sequence. To test if both gene belong to the suppressors, we generated double and triple mutant combinations and we monitored the number of L1 larvae and developing worms in the progeny. Only mutation in 26 can suppress the let-418 developmental arrest. Allele used:
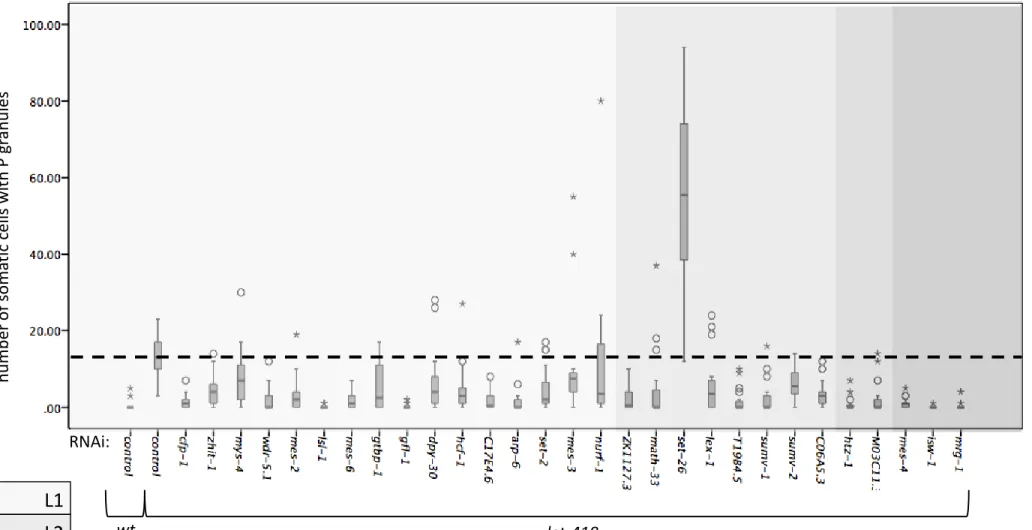
L2 L3 L4 L1 wt RNAi: num be r o f s om ati c c ells w ith P g ran ule s let-418
Figure S3: Suppression of let-418 ectopic P granule expression. All 29 RNAi clones were tested for their ability to suppress let-418 ectopic P granule expression and all of them except set-26 show a suppression effect. Y axis: discrete values for P-granule positive cells.
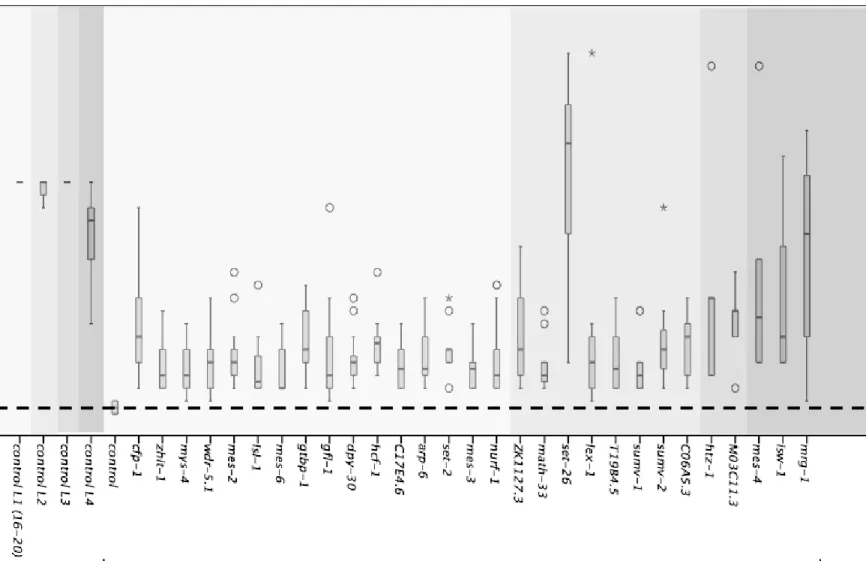
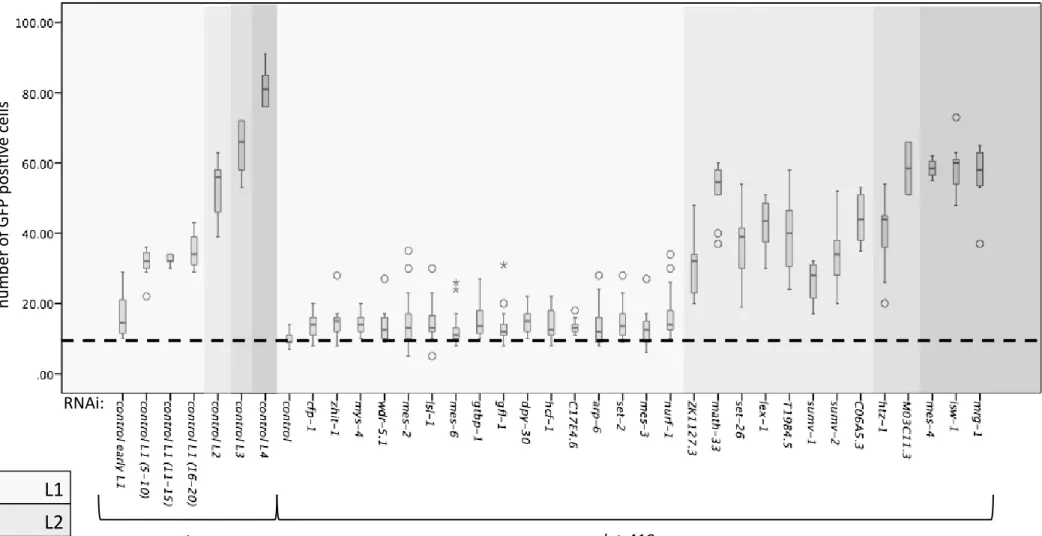
L2 L3 L4 L1 wt let-418 RNAi: nu mb er of G FP p os itiv e c ells
Figure S4: Suppression of let-418 associated M cell mitotic arrest. All 29 RNAi clones were tested for their ability to suppress M cell mitotic arrest and all them induced M cell mitotic division.
L2 L3 L4 L1 wt let-418 RNAi: nu mb er of G FP p os itiv e c ells
Figure S5: Suppression of let-418 associated V cell mitotic arrest. All 29 RNAi clones were tested for their ability to suppress V cell mitotic arrest and all them induced V cell mitotic division.
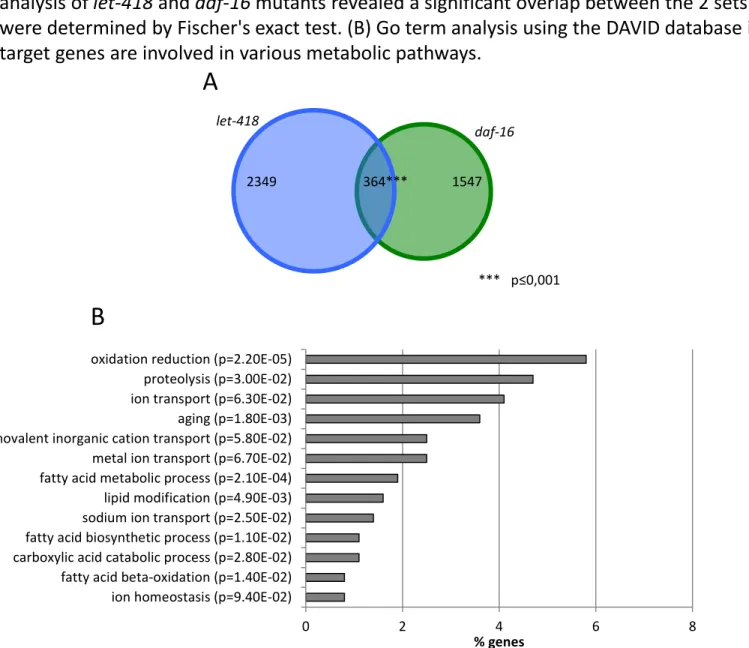
let-418 1547 364*** 2349 daf-16 0 2 4 6 8
ion homeostasis (p=9.40E-02) fatty acid beta-oxidation (p=1.40E-02)
carboxylic acid catabolic process (p=2.80E-02)fatty acid biosynthetic process (p=1.10E-02)
sodium ion transport (p=2.50E-02)lipid modification (p=4.90E-03)
fatty acid metabolic process (p=2.10E-04)metal ion transport (p=6.70E-02)
monovalent inorganic cation transport (p=5.80E-02)aging (p=1.80E-03)
ion transport (p=6.30E-02)proteolysis (p=3.00E-02)
oxidation reduction (p=2.20E-05)
% genes
*** p≤0,001
Figure S6 : DAF-16 and LET-418 share common target genes involved in metabolic pathways. Transcriptome analysis of let-418 and daf-16 mutants revealed a significant overlap between the 2 sets of target genes. P-values were determined by Fischer's exact test. (B) Go term analysis using the DAVID database indicates that common target genes are involved in various metabolic pathways.
A
Figure S7: Overexpression of DAF-16 target in let-418 mutant is only partially dependent on DAF-16. mRNA level of
dct-3, W08A12.4 and fbxa-165 was measured by qRT-PCR and represented as the log10 of fold induction. Total mRNA
was isolated from L1 animals of the indicated genotype. ama-1 was used to normalize.
-2 -1.5 -1 -0.5 0 0.5 1 1.5 2
wt let-418 daf-16 daf-16;let-418
Lo g r el at iv e ex pr es sio n
dct-3 mRNA level
-2 -1.5 -1 -0.5 0 0.5 1 1.5 2wt let-418 daf-16 daf-16;let-418
Lo g r el at iv e ex pr es sio n
W08A12.4 mRNA level
-2 -1.5 -1 -0.5 0 0.5 1 1.5
wt let-418 daf-16 daf-16;let-418
Lo g r el at iv e ex pr es sio n