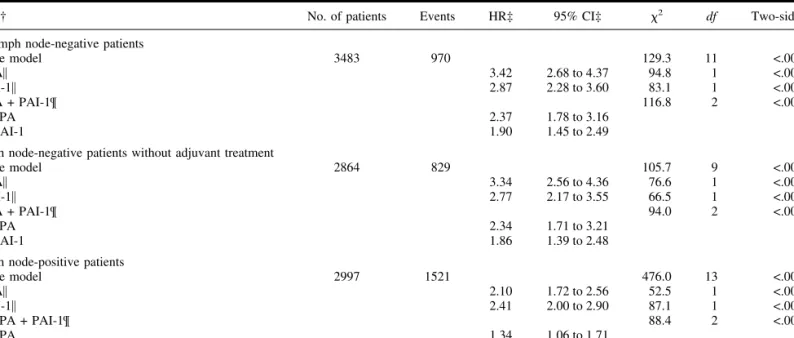
Pooled Analysis of Prognostic Impact of Urokinase-Type Plasminogen Activator and Its Inhibitor PAI-1 in 8377 Breast Cancer Patients
Texte intégral
Figure


Documents relatifs
Kaplan-Meier analysis for 6 different EM gene sets (24 genes) from HMLER and HMLE cell lines ( S2 Table ) in luminal B (epithelial) and basal (mesenchymal) breast cancer pa-
A partir de ce schéma, Devillard montre les interactions possibles dans une équipe. Ainsi, soit les flux vont dans le même sens, et la dynamique d’équipe fonctionne ; soit les flux
L’archive ouverte pluridisciplinaire HAL, est destinée au dépôt et à la diffusion de documents scientifiques de niveau recherche, publiés ou non, émanant des
This local heat release rate fluctuation model is well suited to rapidly conduct a linear stability analysis of the system dynamics and may be used to ease the prediction
We compared fold-change expression of defense-related gene in the same samples measured by the 96.96 dynamic array with those obtained from the “BioMolChem” chip with the
Methods have been proposed for the specific case of digital holographic microscopy [2, 3], but these allow optimal amplitude and phase reconstruction only in the plane where
This study was part of a study of benzene concentrations in upstream petroleum workers’ blood and urine (Kirkeleit et al. 2007 ) where exposure levels and quantitative
Pour terminer, voici un survol des résultats obtenus dans les deux autres études majeures parues dans le domaine des nouveaux anticoagulants oraux utilisés en FA pour la
