Health motivation and product design determine consumers’
visual attention to nutrition information on food products
Vivianne HM Visschers*, Rebecca Hess and Michael Siegrist
ETH Zurich, Institute for Environmental Decisions, Consumer Behavior, Universitaetstrasse 22 CHN 75.2, 8092 Zurich, Switzerland
Submitted 3 September 2009: Accepted 24 November 2009: First published online 26 January 2010 Abstract
Objective: In the present study we investigated consumers’ visual attention to nutrition information on food products using an indirect instrument, an eye tracker. In addition, we looked at whether people with a health motivation focus on nutrition information on food products more than people with a taste motivation. Design: Respondents were instructed to choose one of five cereals for either the kindergarten (health motivation) or the student cafeteria (taste motivation). The eye tracker measured their visual attention during this task. Then respondents completed a short questionnaire.
Setting: Laboratory of the ETH Zurich, Switzerland.
Subjects: Videos and questionnaires from thirty-two students (seventeen males; mean age 24?91 years) were analysed.
Results: Respondents with a health motivation viewed the nutrition information on the food products for longer and more often than respondents with a taste motivation. Health motivation also seemed to stimulate deeper processing of the nutrition information. The student cafeteria group focused primarily on the other information and did this for longer and more often than the health motivation group. Additionally, the package design affected participants’ nutrition information search.
Conclusions: Two factors appear to influence whether people pay attention to nutrition information on food products: their motivation and the product’s design. If the package design does not sufficiently facilitate the localization of nutrition information, health motivation can stimulate consumers to look for nutrition infor-mation so that they may make a more deliberate food choice.
Keywords Nutrition information Visual attention Health motivation Package design
Nutrition information on food products, such as labels and claims, comprise one of the means that help con-sumers to interpret products’ nutritional value. Various scholars therefore have studied how consumers interpret
nutrition labels and claims(1–6). However, few
observa-tional studies have examined whether and how
con-sumers perceive nutrition labels and claims (e.g.
references 7 and 8). Food products also include other nutrition information on their packaging, such as the ingredients list and a front-of-package label (FOP), which none of the other studies considered. We therefore aimed to study consumers’ visual attention towards all nutrition information on food products, using an indirect measure. When asked directly, many consumers report obser-ving nutrition labels and claims; sometimes as many as 71 % say they do so (e.g. references 9 and 10). Several demographical variables, such as being female and having a higher education level, as well as concepts related to motivation such as nutrition importance and health con-sciousness, appear mainly to determine this behaviour
(e.g. references 3, 9–12). The self-report method, how-ever, has insufficient construct validity. Consumers may answer in a socially desirable way or may have difficulty in estimating the frequency of nutrition information use during shopping, as this is determined mainly by habits
and external cues which are difficult to verbalize(13).
Two studies in more realistic shopping situations indicated that consumers showed little interest for
nutri-tion labels and health symbols on products(7,8).
Partici-pants’ attention to nutrition labels(7), but not to health
symbols(8), increased impressively when they were
instructed to look for healthy food items. However, these studies also have some methodological limitations: (i) the research method used, a think-aloud protocol, made participants aware of their actual behaviour; (ii) only small samples were tested; and (iii) there was little control over the experimental situation. Nevertheless, these studies revealed considerable dissimilarities between consumers’ self-reported and observed nutrition infor-mation use.
S
Public
Health
Moorman(14) observed consumers in the supermarket before and after the implementation of a new nutrition labelling system. One of her findings was that motivated consumers looked more often at food products after the new labelling than before, and more than less-motivated consumers. It was however impossible to determine what kind of information the respondents perceived on the food products. The new labels could also have made other information (e.g. price or ingredients) more difficult to find, so that respondents needed more time to perceive the products.
In sum, previous studies examining whether con-sumers perceive nutrition information and what type of information they look at have serious methodological shortcomings. Studies using indirect measurements are needed to overcome them. The eye tracker is a promising instrument in this respect because it makes it possible to observe consumers in a more realistic, but controlled, setting, without revealing the purpose of the study.
To the best of our knowledge, only two other studies have utilized an eye tracker to examine consumers’ visual
attention to nutrition labels(5,15). The aim of both studies was
to compare various labels, and the respondents were directly presented with the nutrition labels. This is not very realistic, because nutrition labels are usually presented in the midst of other verbal and graphic information on a package, which can distract consumers from the labels.
In an eye tracker study related to brand management, motivation appeared to increase the duration of respon-dents’ visual attention on the products and to decrease the number of switches between the products, which
implied deeper information processing(16). That study
thus also indicated that motivation may increase nutrition information use.
In the present study, we aimed to examine the fol-lowing two issues by means of an eye tracker: (i) how much attention do consumers pay to nutrition informa-tion on food products compared with other informainforma-tion while making a food choice? and (ii) does a health motivation lead to more nutrition information use?
Method Participants
Forty-two students of the University of Zurich and the ETH Zurich participated in the present study, for which they received CHF 20 ($US 19). We excluded ten participants from the analyses as their eye-tracker videos contained more than 30 % missing data (see Data analysis). Of the remaining thirty-two respondents, seventeen were males
(53 %) and their mean age was 24?91 (SD5?14) years.
Design, procedure and materials
The experiment included two conditions (health v. taste motivation) using a between-subjects design with random
distribution of respondents over the two conditions. Upon arrival in our laboratory, participants were seated at a desk. The experimenter first explained the purpose of the study and the eye tracker’s functioning. We used the
iViewXTM HED4 eye tracker (SensoMotoric Instruments,
Berlin, Germany). This is a so-called head-mounted sys-tem: it is installed on the head so that participants can move and observe ‘real’ products. The output is a video from the respondent’s viewpoint in which his/her visual gaze is depicted.
The participants read and signed the informed consent form, in which they agreed that their eye movements could be recorded; all data would be treated anon-ymously; and they could stop the experiment at any point. The experimenter then calibrated the eye tracker using a 9-point calibration panel.
The participants were asked to read one of two assign-ment texts. They had to imagine that they had to advise either a kindergarten (health motivation) or a student cafe-teria (taste motivation) about which cereal out of five to buy. The kindergarten was looking for a product for pre-school children. We expected that the association with children would motivate respondents to look for a healthy product. The other text stated that the student cafeteria was planning to offer breakfast from next semester on. Because our student sample would be the target group of this facility, we expected it to select the tastiest product. There was no time limit to make the food choice.
The experimenter then started the video recording of the eye tracker and presented the five cereals from which the respondents should choose one. The products were Kellogg’s Original Cornflakes, Kellogg’s Special K, Kellogg’s Frosties, Coop Naturaplan Bioflakes and Prix Garantie Cornflakes (see Fig. 1). These products are sold at the two largest food retailers in Switzerland. The products varied in their nutritional value, amount of presented information, target group, brand type, type of claims, design, presence of an FOP and price.* All products included a nutrition table, the product’s name, brand name, ingredients and allergy information, price, expiry date, storage advice and infor-mation about product provenance.
As soon as respondents had selected a product, the experimenter stopped the video and asked them to complete a questionnaire with three items: familiarity with the chosen product (yes/no), the importance of offering tasty food and the importance of offering healthy food for the kindergarten/student cafeteria (7-point Likert scales; higher scores indicated greater importance). These two items served as manipulation checks. Lastly, we asked for the demographics age and gender. At the end, the respondents were thanked, paid and debriefed about the experiment.
S
Public
Health
Nutrition
* More information about the products and their characteristics, which had to be omitted due to limited space, can be acquired from the corresponding author.
Data analysis
The data of the eye tracker were analysed as follows. First, the experimenter coded all forty-two videos in the analysis software Interact Version 8.50 (Mangold International GmbH, Arnstorf, Germany) by indicating which of the areas of interest (AOI) the participant’s gaze was directed at and for how long. We defined nineteen AOI of which fourteen were package-related AOI (see Fig. 2). All infor-mation on the packages was categorized into AOI, whereby the various nutrition and health information elements were labelled with separate AOI. We also assigned a separate AOI to each product (five product AOI).
An AOI was coded when the gaze of the respondent rested for 3 frames (i.e. 120 ms) or more on the predefined area. The observer coded a product AOI for the duration of the respondent’s gaze on a product. At the same time, several package-related AOI could be assigned con-secutively. If the gaze was missing for 8 frames or more (i.e. 320 ms), the code ‘missing’ was given. Videos in which more than 30 % of the total duration was coded as missing were eliminated from the data set.
We used the SPSS statistical software package version 16 (SPSS Inc., Chicago, IL, USA) to calculate the descriptive statistics of the eye-tracker videos and to analyse the questionnaire items. Unless stated otherwise, we analysed the relative durations and relative number of gazes per package-related AOI, and similarly per product AOI. The relative duration per package-related AOI was the absolute duration per package-related AOI divided by the total duration on all package AOI. The relative duration per product AOI was the absolute duration per product AOI divided by the complete video duration. We calculated two similar relative variables for the relative count using the number of gazes.
As we had a small sample and the eye-tracker data were not normally distributed, we calculated the 95 % confidence intervals around the medians using the bootstrapping method with replacement (1000
sam-ples)(17). This was done with SYSTAT software version 12
(SYSTAT Software Inc., Chicago, IL, USA).
Every third video was also coded by a second observer to check the data quality. We calculated the reliability between the two observers using Cohen’s kappa, which was sub-stantial (k 5 0?76, n 1694 for product AOI; k 5 0?72, n 626 for package-related AOI) (e.g. reference 18).
Results
General description
The median net duration of the seventeen videos of the kindergarten condition and the fifteen videos of the stu-dent cafeteria was 109?70 s (interquartile range (IQR) 76?08, 172?72). The net video duration did not include reading the assignment, unintentional gazes at the start and end of the video, and the product choice. The median number of items which the respondents looked at per video was 196?00 (IQR 144?00, 243?25). After removal of the videos with more than 30 % missing data, 13?5 % (median; IQR 7?97, 22?24 %) of the video durations were coded as missing. A majority of the respondents (nineteen of the thirty-two) reported not having been familiar with the cereals they chose.
Manipulation checks
We conducted Mann–Whitney tests to analyse whether the assignment affected respondents’ importance rating of healthy food for the kindergarten/student cafeteria and,
S
Public
Health
Nutrition
Fig. 1 The five cereals presented in the study: Prix Garantie Cornflakes, Kellogg’s Original Cornflakes, Naturaplan Bioflakes, Kellogg’s Frosties and Kellogg’s Special K
similarly, for the importance of tasty food. The effects of the assignment were in the expected direction and seemed to confirm our manipulation’s success. Respon-dents in the student cafeteria condition considered tasty food to be marginally more important (median 5 7) than
those in the kindergarten condition (median 5 6,
U 5 91?50, P 5 0?07, one-tailed). Healthy food was sig-nificantly more important in the kindergarten condition (median 5 7) than in the student cafeteria condition (median 5 6, U 5 83, P 5 0?03, one-tailed).
Respondents tended to need more absolute time to choose a product for the kindergarten (median 5 146?09 s, 95 % CI 85?12, 205?64 s) than for the student cafeteria (median 5 102?45 s, 95 % CI 79?44, 127?84 s), but this dif-ference was not significant. The total absolute number of gazes did not differ between the kindergarten condition (median 5 196?39, 95 % CI 130?00, 288?00) and the student cafeteria condition (median 5 199?34, 95 % CI 169?00, 226?00). The mean duration per gaze also tended to be longer in the kindergarten condition (median of mean gaze duration 5 0?663 s, 95 % CI 0?529, 0?864 s) than in the
student cafeteria condition (median of mean gaze dura-tion 5 0?539 s, 95 % CI 0?412, 0?568 s). Longer mean gaze
duration may indicate deeper information processing(16).
Effect of assignment over all products
We first examined which package-related AOI our respondents primarily perceived. The kindergarten group mainly looked at the nutrition table (Fig. 2). It also paid a great deal of attention to the text, design, advertisements and ingredients/allergy information. Moreover, this group looked longer at the nutrition table (marginal effect for relative count) and more often at the ingredients/allergy information than the student cafeteria group. The latter group focused mainly on the design, and then on the advertisements, text and nutrition table. Additionally, these respondents looked longer at the logo/symbol and more often at the design of the product (marginal effect for duration) than the respondents of the kindergarten condition. In short, the assignment, and thus the type of motivation, seemed to affect what kind of package-related AOI participants perceived. The health motivation
S
Public
Health
Nutrition
0·35 0·25 0·30 0·20 0·15 0·10Median relative gaze count
Median relative gaze duration 0·05
0 0·35 0·25 0·30 0·20 0·15 0·10 0·05 0 FOP†
General health information† Health claim†
Ingredients allergy†Legend %DV/FOP†
Nutrition claim†Nutrition table†Advertisement*
Package-related AOI
Design* Logo/symbol*
Price*
Product name*Quality claim* Text*
Fig. 2 Median relative gaze durations and median relative gaze counts, with their 95 % CI represented by vertical bars, for each package-related area of interest (AOI) for the kindergarten condition ( ) and the student cafeteria condition ( ). Data determined from analysis of eye-tracker videos obtained from thirty-two students (seventeen males; mean age 24?91 years), Zurich, Switzerland. FOP, front-of-package label; DV, daily value; *AOI expresses other information; yAOI expresses nutrition information
seemed to result in more interest in detailed nutrition information, whereas the taste motivation may have led to more attention to easy graphic information.
The package-related AOI were then categorized into related (‘nutrition’) information and nutrition-unrelated (‘other’) information, based on whether they provided information about health and the product’s nutritional value (Fig. 2). These two groups of variables were first used to examine whether the assignment affected respondents’ visual attention to nutrition information compared with other information. The respondents in the student cafeteria condition looked significantly longer and more often at other items (44 % for relative duration and 40 % for relative count, respectively) than at nutrition information (20 % and 16 % respectively, Figs 3 and 4).
Moreover, this group looked more often at other items than the respondents of the kindergarten condition (33 %), but not longer. The latter group mainly regarded nutrition items and did this significantly longer (42 %) and more often (25 %) than the student cafeteria group.
The mean gaze durations showed a trend that the kin-dergarten respondents spent more time on nutrition infor-mation per gaze (median of mean gaze duration 51?144 s, 95 % CI 0?725, 1?493 s) than the student cafeteria respondents (median of mean gaze duration 5 0?620 s, 95 % CI 0?489, 0?792 s). The mean gaze durations of the other information did not differ between the two conditions (median of mean gaze duration 5 0?561 s, 95 % CI 0?520, 0?643 s and median of mean gaze duration 5 0?533 s, 95 % CI 0?443, 0?606 s, respectively). This implies that the kindergarten condition
S
Public
Health
Nutrition
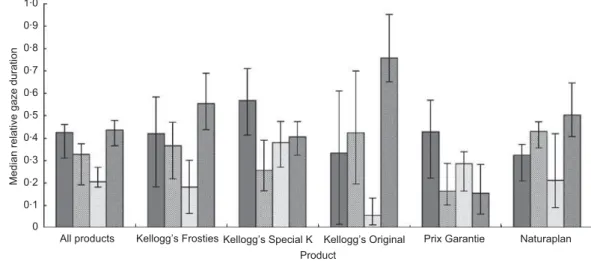
1·0 0·9 0·8 0·7 0·6 0·5 0·4 0·3 0·2 0·1 0 All productsMedian relative gaze duration
Kellogg’s Frosties Kellogg’s Special K Kellogg’s Original Product
Prix Garantie Naturaplan
Fig. 3 Median relative gaze durations, with their 95 % CI represented by vertical bars, for the nutrition information and the other information over all products and per product, for the kindergarten condition ( , nutrition information; , other information) and the student cafeteria condition ( , nutrition information; , other information). Data determined from analysis of eye-tracker videos obtained from thirty-two students (seventeen males; mean age 24?91 years), Zurich, Switzerland
1·0 0·9 0·8 0·7 0·6 0·5 0·4 0·3 0·2 0·1 0 All products
Median relative gaze count
Kellogg’s Frosties Kellogg’s Special K Kellogg’s Original Product
Prix Garantie Naturaplan
Fig. 4 Median relative gaze counts, with their 95 % CI represented by vertical bars, for the nutrition information and other information over all products and per product, for the kindergarten condition ( , nutrition information; , other information) and the student cafeteria condition ( , nutrition information; , other information). Data determined from analysis of eye-tracker videos obtained from thirty-two students (seventeen males; mean age 24?91 years), Zurich, Switzerland
did not balance respondents’ attention for the two types of information; rather it seemed to increase respondents’ attention to nutrition information compared with the other information and with the taste motivation.
Effect of assignment on each product
We then analysed whether the respondents of the two conditions perceived nutrition items and other items dif-ferently for each of the five products. The participants in the student cafeteria condition looked significantly longer and more often at other items than at nutrition items of Kellogg’s Frosties, Kellogg’s Original Cornflakes and Naturaplan Bioflakes (for relative duration only a mar-ginal difference, Figs 3 and 4). They also showed equally long and just as frequent attention to nutrition items as to other items on Kellogg’s Special K and Prix Garantie Cornflakes. The respondents in the kindergarten condi-tion regarded the nutricondi-tion informacondi-tion of Kellogg’s Special K significantly longer than the other information. Additionally, this group looked more often at other items on Naturaplan Bioflakes than at its nutrition items. Our results thus confirmed that not only the assignment but also the package type affected respondents’ visual atten-tion to nutriatten-tion items and other items.
Finally, we wanted to find out whether all respondents had perceived the information about the product’s nutritional value on each of the five products. We there-fore checked whether each participant had taken at least one look at either the nutrition table and/or the FOP of
each product and we used the x2test to analyse whether
condition and product type affected respondents’ notice of them or at least one of the two. Overall, more than twenty-one of the thirty-two respondents perceived at least one of the two information items on the five pro-ducts (see Table 1, Nutrition table or FOP). It appeared that most respondents spotted the nutrition table or the FOP on Naturaplan Bioflakes and this was significantly
more often than on the other products (x2(4) 5 9?23,
P 5 0?06). The majority of the respondents appeared to find the nutrition table in both assignments and this did
not differ between the five products (all x2,6?23, all
P . 0?18, Table 1, Nutrition table). In the student cafeteria condition, more respondents missed the FOP on Kellogg’s Frosties, Kellogg’s Special K and Kellogg’s Original Corn-flakes, whereas most respondents noticed the FOP on
Naturaplan Bioflakes (x2(3) 5 13?05, P 5 0?005). This effect
was mainly present in the student cafeteria condition
(x2(3) 5 12?00, P 5 0?007). Respondents may thus have
found the nutrition table and the FOP more easily on Naturaplan Bioflakes than on the Kellogg’s products.
Discussion
To the best of our knowledge, the present study is the first to examine consumers’ visual attention to nutrition
S
Public
Health
Nutrition
Table 1 Numbe r o f respon dents w h o neve r looked at and look ed at least on ce at the nutritio n table , front-of-packa ge label (FO P) or eithe r o n e of them, per produ ct and conditi on. Data determi ned from analys is of eye-tracke r videos obtai ned from thirty-two studen ts (sev enteen males; mea n age 24 ?91 year s), Zu rich, Switzerl and Nutrition table FOP Nut rition ta ble or FO P Product Absolut e gaze cou nt St udent cafete ria Kin derga rten Ov erall St udent cafete ria Kin derga rten Ov erall St udent cafete ria Kin derga rten Ov era ll Kellog g’s Frostie s 0 7 6 13 11 12 23 6 5 11 . 1 8 11 19 4 5 9 9 12 21 Kellog g’s Special K 0 9 6 15 8 9 17 5 5 10 . 1 6 11 17 7 8 15 10 12 22 Kellog g’s Origina l C ornflak es 0 8 4 1 2 9 10 19 5 3 8 . 1 7 13 20 6 7 13 10 14 24 Prix Garant ie Corn flakes * 0 5 6 11 NA NA NA 5 6 11 . 1 1 0 1 12 1 N A N A N A 1 0 1 12 1 Naturapla n Bioflak es 0 3 4 7 2 7 9 1 1 2 . 1 1 2 1 32 5 1 3 1 02 3 1 4 1 63 0 NA, not applicable. *Prix Garantie Cornflakes do not include an FOP.information on food products using an indirect measure. Our results indicate that at least 66 % of the respondents perceived the nutrition label and/or FOP of each product (see Table 1, student cafeteria condition, for Kellogg’s Frosties). This finding seems to agree with that of self-report studies, which revealed similar rates of nutrition label use (e.g. references 9 and 10).
Noting the nutrition information does not imply that respondents also process and consider it in their food choice, especially if the product also includes other infor-mation that distracts people’s attention. We therefore ela-borate further on the implications of motivation and product design for nutrition information use in the following.
If consumers have a taste motivation, their visual attention to the other information on food products appears to overshadow their attention to the nutrition information. Our results also indicate that health moti-vation can stimulate people’s attention for nutrition information and may lead to deeper information proces-sing than taste motivation, especially of nutrition infor-mation. The health motivation namely resulted in longer mean gaze durations than the taste motivation, for the same amount of information.
The type of package appeared to affect people’s notice of and attention to nutrition information. First, products with a simpler design, such as Naturaplan Bioflakes and Prix Garantie Cornflakes, attracted respondents’ attention more easily to the nutrition information. More respon-dents noticed, for example, the FOP on Naturaplan Bioflakes. Second, the balance of nutrition and other information on the package seemed to play an important role. Products that mainly included nutrition information, such as Prix Garantie Cornflakes and Kellogg’s Special K, seemed to attract relatively more of people’s attention to the nutrition information than the other products. Thus, products with a simple design or with mainly nutrition information may help consumers to find the nutrition information. Products with a more crowded design or with mainly other information (i.e. Naturaplan Bioflakes) are not recommended to stimulate the use of nutrition information. A health motivation may then facilitate the detection of nutrition information.
To our knowledge, our study is the first to use an eye tracker to investigate consumers’ visual attention to nutrition information while observing several food pro-ducts. Our results of course do not indicate that con-sumers with a health motivation are also more likely to consider more nutrition information in their actual food choices. Further research is needed to investigate this interesting question.
The setup of our experiment was more realistic than
the setup in previous studies(5,7,8,14,15), but it also had a
few drawbacks. We had to code the output of the mobile eye tracker subjectively, which may have affected our findings. However we had two observers code the videos using the same protocol; they showed reasonable
agreement. Moreover, the mobile eye tracker is sensitive to head movements so that we had many missing frag-ments in the videos. Additionally, results from eye tracker studies do not indicate whether the respondents under-stood the information they perceived correctly.
To conclude, two factors appear to direct consumers’ attention towards nutrition information on food products: health motivation and package design. An interesting implication of our results for, e.g., health educators and dietitians would be to prime people with a health goal before going shopping. Food producers may want to consider their products’ design if they want to help con-sumers finding the nutrition information on their products.
Acknowledgements
The study reported in this paper received no specific grant from any funding agency in the public, commercial or not-for-profit sectors. The authors had no conflicts of interest in writing this paper. V.H.M.V. together with M.S. developed the ideas and the study setup. V.H.M.V. supervised the data collection, analysed the data and wrote most of the paper. R.H. had an advisory role during the setup of the experiment and data analysis. The authors would like to thank Fabienne Brigger, Rahel Fischbacher and Dominique Gartenmann for the data collection and for coding the eye-tracker videos.
References
1. Geiger CJ, Wyse BW, Parent CR et al. (1991) Review of nutrition labeling formats. J Am Diet Assoc 91, 808–812, 815.
2. Grunert K & Wills J (2007) A review of European research on consumer response to nutrition information on food labels. J Public Health 15, 385–399.
3. Williams P (2005) Consumer understanding and use of health claims for foods. Nutr Rev 63, 256–264.
4. Visschers VHM & Siegrist M (2009) Applying the evalu-ability principle to nutrition table information. How reference information changes people’s perception of food products. Appetite 52, 505–512.
5. Jones G & Richardson M (2007) An objective examination of consumer perception of nutrition information based on healthiness ratings and eye movements. Public Health Nutr 10, 238–244.
6. Cowburn G & Stockley L (2005) Consumer understanding and use of nutrition labelling: a systematic review. Public Health Nutr 8, 21–28.
7. Higginson CS, Rayner M, Draper S et al. (2002) The nutrition label – which information is looked at? Nutr Food Sci 32, 92–99.
8. Rayner M, Boaz A & Higginson C (2001) Consumer use of health-related endorsements on food labels in the United Kingdom and Australia. J Nutr Educ 33, 24–30.
9. Guthrie JF, Fox JJ, Cleveland LE et al. (1995) Who uses nutrition labeling, and what effects does label use have on diet quality? J Nutr Educ 27, 163–172.
10. Nayga RM Jr, Lipinski D & Savur N (1998) Consumers’ use of nutritional labels while food shopping and at home. J Consum Aff 32, 106–120.
S
Public
Health
11. Satia JA, Galanko JA & Neuhouser ML (2005) Food nutrition label use is associated with demographic, behavioral, and psychosocial factors and dietary intake among African Americans in North Carolina. J Am Diet Assoc 105, 392–402.
12. Neuhouser ML, Kristal AR & Patterson RE (1999) Use of food nutrition labels is associated with lower fat intake. J Am Diet Assoc 99, 45–53.
13. Dijksterhuis A, Smith PK, van Baaren RB et al. (2005) The unconscious consumer: effects of environment on con-sumer behavior. J Consum Psychol 15, 193–202.
14. Moorman C (1996) A quasi experiment to assess the consumer and informational determinants of nutrition
information processing activities: the case of the Nutrition Labeling and Education Act. J Public Policy Mark 15, 28–44.
15. Goldberg JH, Probart CK & Zak RE (1999) Visual search of food nutrition labels. Hum Factors 41, 425–437.
16. Pieters R & Warlop L (1999) Visual attention during brand choice: the impact of time pressure and task motivation. Int J Res Mark 16, 1–16.
17. Mooney CZ & Duval RD (1993) Bootstrapping: A Nonpara-metric Approach to Statistical Inference. Newbury Park, CA: Sage.
18. Landis JR & Koch GG (1977) The measurement of observer agreement for categorical data. Biometrics 33, 159–174.