HAL Id: hal-02338970
https://hal.archives-ouvertes.fr/hal-02338970
Submitted on 30 Oct 2019
HAL is a multi-disciplinary open access archive for the deposit and dissemination of sci-entific research documents, whether they are pub-lished or not. The documents may come from teaching and research institutions in France or abroad, or from public or private research centers.
L’archive ouverte pluridisciplinaire HAL, est destinée au dépôt et à la diffusion de documents scientifiques de niveau recherche, publiés ou non, émanant des établissements d’enseignement et de recherche français ou étrangers, des laboratoires publics ou privés.
Why Are Saccharides Dehydrated in the Presence of
Electrolytes? Insights from Molecular Modeling and
Thermodynamic Measurements
Johanne Teychené, Hélène Roux De-Balmann, Laurent Maron, Sylvain Galier
To cite this version:
Johanne Teychené, Hélène Roux De-Balmann, Laurent Maron, Sylvain Galier. Why Are Saccharides Dehydrated in the Presence of Electrolytes? Insights from Molecular Modeling and Thermodynamic Measurements. ACS Central Science, ACS Publications, 2018, 4 (11), pp.1531-1536. �10.1021/acs-centsci.8b00610�. �hal-02338970�
OATAO is an open access repository that collects the work of Toulouse researchers and makes it freely available over the web where possible
Any correspondence concerning this service should be sent
This is an author’s version published in: http://oatao.univ-toulouse.fr/24556
To cite this version:
Teychené, Johanne and Roux-de Balmann, Hélène and Maron, Laurent
and Galier, Sylvain Why Are Saccharides Dehydrated in the Presence of
Electrolytes? Insights from Molecular Modeling and Thermodynamic
Measurements. (2018) ACS Central Science, 4 (11). 1531-1536. ISSN
2374-7943
Official URL: https://doi.org/10.1021/acscentsci.8b00610
Why Are Saccharides Dehydrated in the Presence of Electrolytes?
Insights from Molecular Modeling and Thermodynamic
Measurements
Johanne Teychené,*,† Hélène Roux-de Balmann,‡ Laurent Maron,*,‡ and Sylvain Galier†
†Laboratoire de Genie Chimique, Université de Toulouse, CNRS, INP, UPS, Toulouse, France ‡Université de Toulouse, INSA Toulouse, 135 Avenue de Rangueil, 31077 Toulouse Cedex, France
*S Supporting Information
ABSTRACT: The mechanisms governing the interactions of neutral polar solutes with ions in aqueous solutions are still poorly understood, despite the importance of this phenom-enon in many fields (chemistry, physicochemistry, biology, food industries). In order to go further through the understanding of the molecular mechanisms governing the ions’ specific effects, this paper presents a generic method dealing with the characterization and understanding of interactions between saccharides and ions in aqueous systems. For that, an original approach combining a computational technique and experimental measurements (thermodynamic properties) is proposed to explain and rationalize the
relationship between the solute hydration and the physical chemistry of the ions in solution (cation/anion, charge, size, and hydration). These relationships make it possible to evaluate the hydration state of a saccharide, a polar neutral molecule, according to the ionic composition, from the knowledge of the ions’ hydration properties. This work proposes new insight into molecular mechanisms governing the polar neutral solute/ion interactions and a new understanding of the hydration phenomenon in electrolytic solutions.
M
ore than a century ago, Hofmeister found a particular ordering of ions in the ability of salts to precipitate egg white.1His main conclusion was that the salts’ effectiveness in precipitating proteins is related to the ions’ capacity to order water. Today this phenomenon refers to hydration. An important point that he highlights is that ions cannot be considered as isolated species in water. The salting-out effect is a ubiquitous phenomenon in chemistry, biochemistry, biophysics, and food.2Despite the understanding of a crucial specific effect of ions in the development of such areas, the influence of cations and anions on polar neutral solutes is still poorly understood.In order to contribute to the understanding of the molecular level mechanisms governing the ions’ specific effects on biocompounds, this paper deals with the characterization and the understanding of interactions between saccharides and electrolytes. Indeed, studies of the interactions between saccharides and electrolytes have been attracting renewed interest over the last 20 years.3−9
Up to now, the influence of the electrolyte on the saccharide hydration state has been interpreted using the structural hydration model,10based on the cosphere concept developed by Gurney.11According to this model, the influence of the solute on the structure of water is the solute is represented by a shell of water surrounding the solute. The overlap of the hydration cosphere of the saccharide and of the ions (saccharide/ion interactions) then leads to the saccharide dehydration. More
recently, the influence of the electrolyte on the saccharide hydration has been characterized by the molar volume. The study has highlighted that the dehydration mechanism results from multiple interactions taking place at the molecular scale (saccharide/ions; ions/water).12 Therefore, the link between the saccharide hydration state and the ions’ properties (cation/ anion, charge, size, and hydration) needs to be deepened.
Effects observed at the macroscopic scale, such as changes in apparent molar volume, result from nanoscale phenomena. Thus, it is necessary to develop new complementary approaches to characterize the systems at the microscopic scale. Molecular modeling, and more precisely quantum mechanics, are particularly adapted for describing systems at this scale.
In this context, the objective of this work is to go further through the understanding of the mechanisms that govern polar neutral solutes hydration as a function of the ionic composition. The original methodology envisaged is based on experimental and theoretical approaches at different scales. The fundamental approach proposed consists, on the one hand, of characterizing the hydration properties of the ions by using quantum mechanics. On the other hand, it relies on the study of the relationship between the hydration properties of saccharides,
based on experimental measurements, and the ion properties obtained.
In our previous work, a systematic volumetric study of saccharides (xylose, glucose, and sucrose) in the presence of various electrolytes (LiCl, NaCl, KCl, Na2SO4, K2SO4, CaCl2, MgCl2, MgSO4) has been carried out from density
measure-ments at 298.15 K.12From this data, the saccharide hydration number at infinite dilution nH(expressed in molecules of water
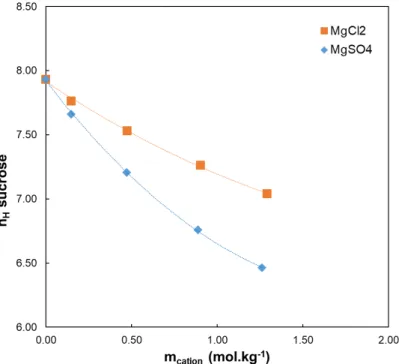
per molecule of solute), which explicitly reveals the solute hydration degree, has been calculated for different ionic compositions. The results are given in Supporting Information, in Table S1. First of all, for an infinite dilution in water, saccharide hydration numbers are 3.9, 4.7, and 7.9 for the xylose, glucose, and sucrose respectively (Table S1). These values match the number of hydroxyl groups present in each saccharide (4, 5, and 8 for the xylose, glucose, and sucrose respectively). On the other hand, for an infinite dilution in the various electrolytes, the saccharide hydration number decreases with the increase of the electrolyte molality (for instance, see sucrose inFigures S1 and S2in Supporting Information). This phenomenon depends on the electrolyte nature. With regard to the impact of the cation, the saccharides dehydration increases according to the following sequence (Figure S1):
< < < <
+ + + + +
Li Na K Mg2 Ca2
Concerning the impact of the anion, the saccharides dehydration increases according to the following sequence (Figure S2):
<
− −
Cl SO42
Whatever the ion (cation or anion), saccharides are further dehydrated in the presence of divalent ions than in the presence of monovalent ones. That can be attributed to stronger attractive electrostatic interactions between the hydrophilic groups of the saccharides and the divalent ions. These interactions govern the dehydration phenomenon. Moreover, for a given ion valence, previous work has highlighted that saccharides dehydration increases with the decrease of the ion free energy of hydration, i.e., lower ion−water interactions. Thus, ion−water interactions have to be considered for a better understanding of the saccharide hydration properties in the presence of various ions.12
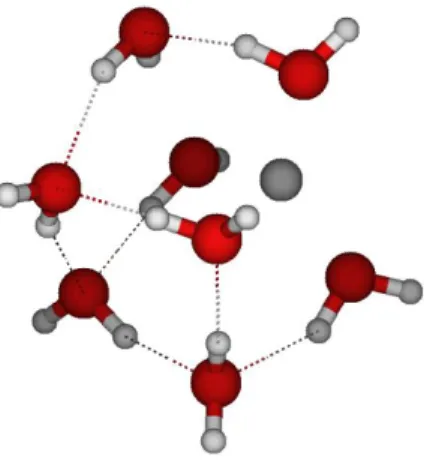
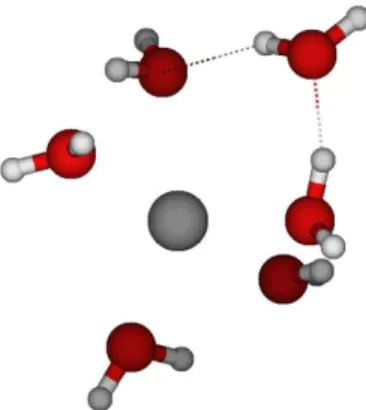
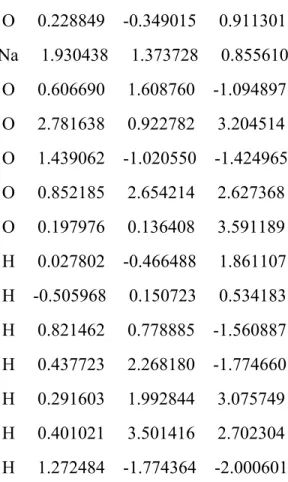
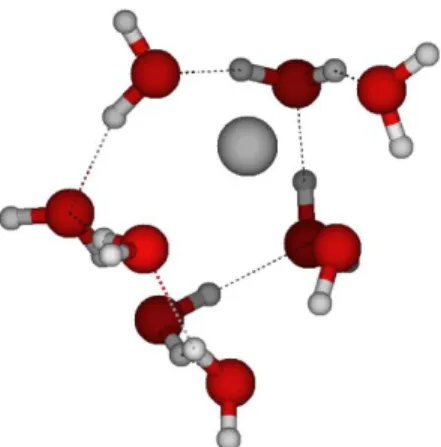
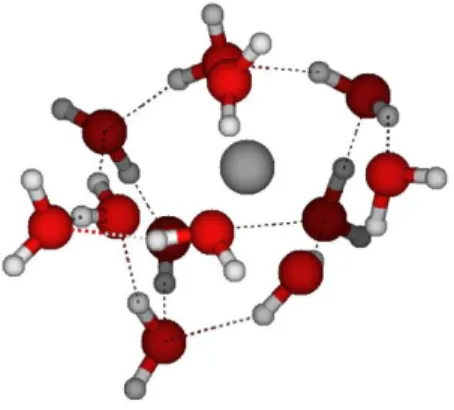
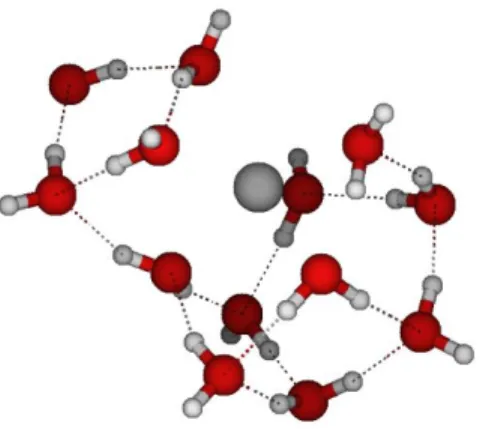
Ions hydration properties were carried out at the density functional theory (DFT) level of theory, the B3PW91 functional13 and 6-31++G** basis sets with the Gaussian 09 suite of programs (seeSupporting Information). The water-shell around the solutes is obtained using the methodology proposed by Castro et al.14for mercury compounds and also by Zhao et al.15for samarium complexes. In summary, the solvation shell is constructed in a stepwise manner by adding one water molecule at a time. At each step, a full geometry optimization of the system is performed without any symmetry constraints. The coor-dinates of the optimized hydrated structures andfigures showing the spatial water molecules arrangement are provided in
Supporting Information.
The solvation enthalpy of the ionΔHwis calculated as the
difference between the enthalpy of the complex (Hcomplex) and those of the two separated fragments, namely, the ion (Hion) and
the water cluster (Hhyd.shell).
ΔHW =Hcomplex−Hion−Hhyd.shell (1)
The ion first-hydration shell is considered to be complete when the interaction energy between the ion and the water reaches a plateau, i.e., is stable with respect to water addition, as defined by eq 1. On these structures, the ion coordination number is thus defined as the number of water molecules directly bonded to the central ion in itsfirst layer of solvation sphere. In the following, a water molecule is considered in direct interaction with the ion, if the bond length is shorter than the sum of the van der Waals radii of the atom in interaction.16In addition, in the case of anions, hydrogen bonds have to be established between the hydrogen of the water molecule and the anion.
The structural parameters of the ions hydration shell, i.e., the ion coordination number, its optimized coordinated water structure, and the average distance between the ion and the water molecules, are listed inTable 1. For comparison, other results from molecular modeling are also reported.17−26One can state that our values are consistent with the literature, indicating the validity of our approach and assumptions.
Concerning the cation, the number of water molecules belonging to thefirst solvation shell depends on the nature of the cation. The optimized building blocks, corresponding to thefirst observed plateau of theΔHw= f (water number) curve for the
different cations, reveal that 4, 5, 6, 6, and 8 water molecules are respectively involved in thefirst hydration sphere of Li+, Na+, K+, Ca2+, and Mg2+ (Table 1). Interestingly, the coordination
number of the monovalent cations can be ranked according to the sequence: Li+< Na+< K+and for the divalent cations: Mg2+
< Ca2+. For a monovalent cation, the K+coordination number is larger than those of Li+and Na+, as expected from the larger size of K+ compared to Li+ and Na+. Indeed, because of steric hindrance, smaller ions, such as Li+ for monovalent cations
(Mg2+ for divalent cations), have fewer coordinated water
molecules than other ions of identical valence. Moreover, the shorter M+−water distance is found for Li+. This shorter
distance is associated with the radial expansion of the valence orbital of the cation and indicates that the cation−water interaction involves atomic orbital overlap contributions. Therefore, the shortest is the distance, the largest is the overlap, and as a result, the strongest is the water−cation interaction. Likewise, both the coordination number and the cation−water distance of Mg2+ are lower than those of Ca2+. Comparing
monovalent and divalent cations having the same coordination number, for instance, K+and Mg2+, the Mg2+−water distance is shorter than the K+−water one. This is again associated with the lowest radial expansion of the orbital of divalent metals with respect to monovalent ones. Using the same argument as before, this means that the cation−water interactions are stronger with Mg2+than with K+.
Concerning the anion hydration properties, the coordination numbers of Cl−and SO42−are respectively 5 and 9. The sulfate
anion, which is a polyatomic molecule, is a highly hydrated anion, with a very compact water shell, compared to Cl−. Unlike the water−cation interactions where bonding is essentially due to orbital overlap, the water−anion interactions are mainly hydrogen bonds. For monatomic anions such as Cl−, that leads to a competition between the water network formation and the solvation of the anion. The consequence of this competition is that the structure of the water network around Cl−is relaxed.
To evaluate the role of the electrolyte on the saccharide hydration state, the influence of the cations and anions will be first quantified separately.
Consideringfirst the effect of the cation, the possible existence of correlations between the cation coordination number and the saccharide hydration number in electrolyte solutions was investigated. The experimental saccharide hydration numbers, calculated for different electrolytes containing either Cl− or SO42− and for a given cation molality (1 mol·kg−1), are
represented as a function of the computed coordination number of the cations (Figure 1). The saccharides are all the more
dehydrated as the cations coordination number (i.e., the number of water molecules directly interacting with the cation) increases (Figure 1). The large saccharide dehydration observed in the presence of divalent ions can be attributed to the lowest radial expansion of the orbital of divalent metals with respect to monovalent ones, as previously mentioned. This means that the interactions between cations and the oxygen of the saccharide hydroxyl groups are stronger with divalent cations than with monovalent ones. As a consequence, saccharides are more dehydrated. Moreover, focusing on the electrolyte bearing a Cl− counteranion, the saccharide hydration number decreases linearly with the increase of the cation coordination number (linear regression coefficient >0.95 for the three saccharides). The existence of this linear relation indicates that the presence of Cl− has a weak impact on the saccharide hydration. This is further highlighted by the extrapolation of the saccharide coordination number from this linear relationship. Indeed, it is noteworthy that the saccharide hydration numbers, obtained by extrapolation of the straight line to CN = 0, which represents the hydration state of each saccharide in pure water, are very close to the values determined from the saccharide apparent molar volumes. For instance, the glucose hydration number, obtained by extrapolation is 4.75 (electrolyte at 0.15 mol·kg−1), compared to the value obtained from the saccharide apparent molar volumes which is 4.72. Furthermore, the saccharide hydration numbers, for cations having the same coordination number (K+ and Mg2+), are close. For example, the hydration number of
xylose with KCl is 3.56, which is very close to the value of 3.51 Table 1. Structural Parameters of the Ion Hydration Shella
aValues obtained in the present work are reported in thefirst row of the table. CN: coordination number, optimized structure: water cluster coordinated to the ion, d: average distance between ion and coordinated water molecules.
Figure 1.Saccharide hydration numbers (nHsaccharide) versus the
coordination numbers (CN cation) of different electrolytes containing Cl−(filled symbols) and SO42−(empty symbols) for a given cation
molality (1 mol·kg−1).
determined in the presence of MgCl2. A stronger difference between the sucrose hydration number in the presence of KCl (nH= 7.27) and of MgCl2(nH= 7.19) is, however, observable.
Indeed, sucrose is more sensitive to the dehydration caused by the presence of the divalent cations because of its large number of hydroxyl groups. Besides, the saccharide dehydration increases with the number of hydrophilic groups contained in each saccharide. Indeed, the straight slopes for xylose, glucose, and sucrose are−0.08, −0.11, and −0.13, respectively (Figure 1).
Hence, in the presence of Cl−, the fact that the saccharides are all the more dehydrated than the cation coordination number is important (i.e., increase of the number of water molecules contained in the first coordination shell of the cation). That means that the greater the cation coordination number is, the more it can create interactions with the saccharide. The saccharide−water interactions that hydrated the hydrophilic groups of the saccharides are then replaced by saccharide− cation interactions. Equally, the cation−water interactions are replaced by cation-hydrophilic group interactions. Both saccharide and cation are dehydrated. It appears that the anion Cl−has a weak impact on the saccharide hydration. In the presence of the chloride anion, interactions in solution are then governed by the cation−saccharide interactions. To our best knowledge, such a conclusion has never been reported to date. In a second step, the anion influence was studied.Figure 1
shows that the saccharide dehydration effect is much larger with electrolyte containing the sulfate ion than the chloride anion. The sulfate anion promotes saccharide dehydration. On the one hand, the larger influence of the sulfate ion is linked to its higher charge (divalent anion) that creates more hydrogen bonds with the saccharides. On the other hand, it can be correlated with its greater coordination number (9) compared to the chloride ion (5) and the shorter anion−water distance (Table 1). For sulfate electrolytes with monovalent cations (Na+ and K+), the
saccharide hydration number also decreases linearly with the increase of the coordination numbers of the cations. Furthermore, the divalent cations remain the most dehydrating component compared to monovalent cation. However, for cations having the same coordination number (K+and Mg2+),
unlike the results obtained in the presence of Cl−, the saccharide hydration numbers are different. Indeed, the sucrose hydration number is 7.00 in the presence of K2SO4 and 6.65 in the
presence of MgSO4. That shows the strong impact of the sulfate
anion on the saccharide hydration. Hence, in order to evaluate possible synergistic effects of anion and cation on the saccharide hydration, the possible existence of a correlation between the saccharide hydration numbers (nH) and the total coordination
numbers of the ions of the electrolyte (CNtotal = CNcation +
CNanion) is studied (Figure 2). The CNtotaltakes into account the
stoichiometric coefficients of the electrolyte ions. For example, the CNtotof Na2SO4is twice the CN of Na+to which the CN of
SO42− is added (see Table 1), meaning a total coordination number (CNtotal) of 19.
In the presence of SO42−, the saccharides hydration numbers
decrease linearly with the increase of the total coordination number of the ions (linear regression coefficients > 0.94). This is indicative of the effect of SO42−on the saccharide dehydration. As in the presence of Cl−, the saccharide dehydration increases with the saccharides’ hydrophilic groups number, which is consistent. Indeed, the straight slopes for xylose, glucose, and sucrose are−0.02, −0.03, and −0.05, respectively.
Finally, in order to take into account the influence of the electrolyte concentration and since it was demonstrated that Cl− exhibits a weak influence on the dehydration, a generalized coordination number is defined by including the molality of ions in electrolyte as follows:
= ·m
CN CN
for chloride electrolytes total cation cation
(2)
= ·m + ·m
CN CN CN
for sulfate electrolytes
total anion anion cation cation
(3)
with CNcationor CNanion: cation or anion coordination numbers,
respectively, and mcationor manion: cation or anion molality (mol·
kg−1).
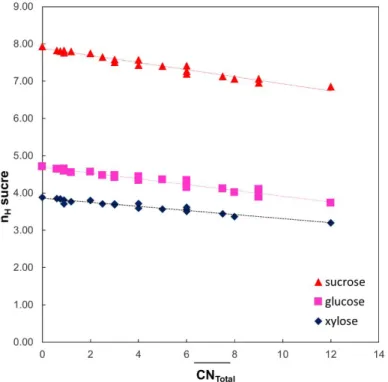
The evolution of the saccharide hydration number in sulfate electrolytes, for various ionic composition, is represented in
Figure 3 as a function ofCNtotal. The one concerning Cl− is presented inFigure S3.
For each saccharide and regardless of the electrolyte concentration, saccharide hydration numbers decrease linearly withCNtotal, which is remarkable. The total cation coordination number reflects then the ions’ ability to form direct interactions with the saccharide hydroxyl groups. It takes into account the proportions of the cations and anions of the solution and the number of opportunities for ions to interact with saccharides.
Moreover, the relationships established enable the determi-nation of the saccharide hydration numbers from the knowledge of the ions properties.
This work constitutes a new approach, which allows the understanding of mechanisms governing the ions’ specific effects on polar neutral molecules. More precisely, it deals with phenomena governing saccharide hydration, as a function of the physical chemistry properties of ions in solution (cation or anion charge, size, and hydration). To this end, an original method-ology based on the combination of experimental measurements (molar volume) and computational technique has been used.
From experimental data, the saccharide hydration number has been calculated in various electrolytes, for different ionic compositions. Ions hydration properties were computed using
Figure 2.Saccharide hydration numbers (nHsaccharide) versus the
total coordination numbers of electrolytes (CNtotal) containing SO42−
theoretical methods (DFT). Saccharide and ions properties obtained from these two complementary methods were then put in parallel, in order to rationalize the relation between the saccharide hydration number in electrolyte solution and the hydration properties of ions.
The influence of the cations and anions on the saccharide hydration has been quantified separately.
The study of the influence of cations highlights that saccharide dehydration increases with the increase of the cation coordination number (i.e., the number of water molecules directly interacting with the cation), whatever the cation valence. Divalent cations have a larger impact on the saccharide dehydration than monovalent ones. That can be attributed to the lowest radial expansion of the orbital of divalent metal with respect to monovalent ones. Interactions between cations and the oxygen of the saccharide hydroxyl groups (the cation− oxygen interaction involving in atomic orbital overlap) are therefore stronger with divalent cations than with monovalent ones. This causes higher saccharide dehydration. For a given cation valence, the cation coordination number increases with the size of the cation. That allows the cation to create more saccharide−cation interactions and then to further dehydrate the saccharide. The cation coordination number reflects the ions’ ability to form direct interactions with the saccharide hydroxyl groups.
Concerning the influence of the anion on the saccharide hydration, this work has highlighted that Cl− has weak interactions with saccharides. Then, the saccharide hydration number only depends on the cation coordination number. In sharp contrast, SO42−has strong interactions with saccharides. In this case, the saccharide hydration number depends on the coordination number of both cations and of anions of the electrolyte.
Relationships established in this work make possible to evaluate the hydration state of a polar neutral solute, a saccharide, as a function of the ionic composition, from the knowledge of the ions’ hydration properties.
The results of the scaling up may be transferable to other polar and neutral biomolecules. It would be interesting to study what would become of the relationships obtained with molecules having a charged or hydrophobic part.
■
METHODSApparent molar volumes of saccharides, VΦ,S, which characterize the hydration state of the solute, have been determined in ref12. At infinite dilution, the apparent molar volumes, Vϕ,S0 , are equal
in value to the standard partial molar volumes. The partial molar volume of a nonelectrolyte can be divided in two terms: the intrinsic molar volume of the nonhydrated solute, Vint, and the
electrostriction partial molar volume, Velect, due to the interaction of the nonelectrolyte with water (shrinkage in volume):27
° = + Φ
V S Vint Velec (4)
The positive intrinsic volume is given by the size of the solute molecule, and for a given temperature, it is considered that it remains at the same magnitude in water and aqueous salt solutions. The interaction term Velectis variable and depends on
the interactions between the solute molecule and surrounding the water molecules (hydration shell).
The hydration number nH(or solvation number, expressed in molecules of water per molecule of solute) explicitly reveals the hydration degree of a solute in water. The hydration number can be calculated from the volumetric properties using the following equation:28,29 = − n V V V ( ) H e0 b0 elec (5)
where Ve0is the molar volume of electrostricted water, and Vb0is
the molar volume of bulk water. The value of (Ve0− V b
0) is about
−3.3 cm3·mol−1 at 298.15 K.28,29
The Velec values can be
obtained from rearrangement ofeq 4as follows:
= Φ −
Velec V0S Vint (6)
The intrinsic volume Vintfor saccharides is calculated from the
crystal molar volume (eq 7).
=i k jjj y{zzz V M d 0.7 0.634 int cryst (7)
where M is the molar mass of saccharide, 0.7 is the packing density for molecules in organic crystals, and 0.634 is the packing density for random packed spheres. The crystal density (dcryst) determined by single-crystal X-ray diffraction is 1.52 g·
cm−3for the xylose,301.56 g·cm−3for the glucose,31and 1.59 g· cm−3for the sucrose.32The obtained nHvalues are reported in
Table S1(Supporting Information).
Safety. No unexpected or unusually high safety hazards were encountered.
■
ASSOCIATED CONTENT*S Supporting Information
The Supporting Information is available free of charge on the
ACS Publications websiteat DOI:10.1021/acscentsci.8b00610. Supplementary figures; tabulated values of saccharides hydration numbers at infinite dilution; Gaussian full references; computational details;13,33,34 electronic en-ergies, enthalpies, and Cartesian coordinates of the
Figure 3.Saccharide hydration numbers (nHsaccharide) versus the
total coordination numbers of electrolytes containing SO42−(CNtotal)
for different electrolyte molalities (0.25, 0.5, 1 mol·kg−1).
stationary points on the potential energy surfaces and optimized water structure surrounding ions (PDF)
■
AUTHOR INFORMATION Corresponding Authors *(J.T.) E-mail:teychene@chime.ups-tlse.fr. *(L.M.) E-mail:laurent.maron@irsamc.ups-tlse.fr. ORCID Johanne Teychené:0000-0002-2997-4744 Laurent Maron:0000-0003-2653-8557 NotesThe authors declare no competingfinancial interest.
■
ACKNOWLEDGMENTSThis research has been realized thanks to the Chemical Laboratory of Toulouse (University Toulouse, 3 Paul Sabatier, Toulouse, France) and supported by an MESR grant.
■
REFERENCES(1) Vlachy, N.; Jagoda-Cwiklik, B.; Vácha, R.; Touraud, D.; Jungwirth, P.; Kunz, W. Hofmeister series and specific interactions of charged headgroups with aqueous ions. Adv. Colloid Interface Sci. 2009, 146 (1− 2), 42−47.
(2) Kunz, W. Specific ion effects in colloidal and biological systems. Curr. Opin. Colloid Interface Sci. 2010, 15 (1−2), 34−39.
(3) Zhuo, K.; Wang, J.; Yue, Y.; Wang, H. Volumetric properties for the monosaccharide (D -xylose, D -arabinose, D -glucose, D -galactose) − NaCl − water systems at 298.15 K. Carbohydr. Res. 2000, 328, 383− 391.
(4) Seuvre, A. M.; Mathlouthi, M. Solutions properties and solute-solvent interactions in ternary sugar-salt-water solutions. Food Chem. 2010, 122, 455−461.
(5) Parke, S. A.; Birch, G. G.; Dijk, R. Some taste molecules and their solution properties. Chem. Senses 1999, 24, 271−279.
(6) Warmińska, D. Volumetric and acoustic properties of D-mannitol in aqueous sodium or magnesium chloride solutions over temperature range of 293.15−313.15 K. Carbohydr. Res. 2012, 349, 44−51.
(7) Banipal, P. K.; Singh, V.; Aggarwal, N.; Banipal, T. S. Hydration behaviour of some mono-, di-, and tri-saccharides in aqueous: Volumetric and rheological approach. Food Chem. 2015, 168, 142−150. (8) Thirumaran, S.; George, G.; Bakkiyalakshmi, P. Acoustical Behaviour of Disaccharide (Sucrose) in Aqueous Alkali Metal Halides at Varying Temperatures. Chem. Sci. Trans. 2014, 3 (1), 323−331.
(9) Palani, R.; Kalavathy, S. Volumetric compressibility and transport studies on molecular interactions of mono, di and tri saccharides in aqueous sodium butyrate mixtures at 303.15 K. Pelagia Res. Libr. 2011, 2, 146−155.
(10) Desnoyers, J. E.; Arel, M.; Perron, G.; Jolicoeur, C. J. Phys. Chem. 1969, 73 (11), 3346−3351.
(11) Gurney, R. W. Ionic Proccesses in Solution; McGraw-Hill Book Company: New York, 1953.
(12) Teychene, J.; Roux-de Balmann, H.; Galier, S. Role of the triple Solute/Ion/Water interactions on the saccharide hydration: a volumetric approach. Carbohydr. Res. 2017, 448, 118−127.
(13) Becke, A. D. Density-functional thermochemistry. III. The role of exact exchange. J. Chem. Phys. 1993, 98 (7), 5648−5652.
(14) Castro, L.; Dommergue, A.; Renard, A.; Ferrari, C.; Ramírez-Solís, A.; Maron, L. Theoretical study of the solvation of HgCl2,
HgClOH, Hg(OH)2and HgCl3: A density functional theory cluster
approach. Phys. Chem. Chem. Phys. 2011, 13 (37), 16772−16779. (15) Zhao, X.; Perrin, L.; Procter, D.; Maron, L. The role of H2O in the
electron transfer−activation of substrates using SmI2: Insights from DFT. Dalton Transactions 2016, 45, 3706−3710.
(16) Batsanov, S. S. Van der Waals Radii of Elements. Inorg. Mater. 2001, 37 (9), 871−885.
(17) Ohrn, A.; Karlstrom, G. A. Combined Quantum Chemical Statistical Mechanical Simulation of the Hydration of Li+, Na+, F−and
Cl−. J. Phys. Chem. B 2004, 108, 8452−8459.
(18) Loeffler, H. H.; Rode, B. M. The hydration structure of the lithium ion. J. Chem. Phys. 2002, 117, 110−117.
(19) Rempe, B. S.; Pratt, L. R.; Hummer, G.; Kress, J. D.; Martin, R. L.; Redondo, R. The Hydration Number of Li+in Liquid Water. J. Am.
Chem. Soc. 2000, 122, 966−967.
(20) Bankura, A.; Carnevale, V.; Klein, M. L. Hydration structure of salt solutions from ab initio molecular dynamics. J. Chem. Phys. 2013, 138, 014501.
(21) Fuoco, A.; Galier, S.; Roux-de Balmann, H.; De Luca, G. Correlation between Computed Ion Hydration Properties and Experimental Values of Sugar Transfer through Nanofiltration and Ion Exchange Membranes in Presence of Electrolyte. Computation 2018, 6 (42), 1−11.
(22) Varma, S.; Rempe, S. B. Coordination numbers of alkali metal ions in aqueous solutions. Biophys. Chem. 2006, 124, 192−199.
(23) Ikeda, T.; Boero, M.; Terakura, K. Hydration properties of magnesium and calcium ions from constrained first principles molecular dynamics. J. Chem. Phys. 2007, 127, 074503.
(24) León-Pimentel, C. I.; Amaro-Estrada, J. I.; Hernández-Cobos, J.; Saint-Martin, H.; Ramírez-Solís, A. Aqueous solvation of Mg(II) and Ca(II): A Born-Oppenheimer molecular dynamics study of micro-hydrated gas phase clusters. J. Chem. Phys. 2018, 148 (14), 144307.
(25) Schwenk, C. F.; Loeffler, H. H.; Rode, B. M. Molecular dynamics simulations of Ca2+ in water: Comparison of a classical simulation
including three-body corrections and Born− Oppenheimer ab initio and density functional theory quantum mechanical/molecular mechanics simulations. J. Chem. Phys. 2001, 115, 10808.
(26) Tongraar, A.; Rode, B. M. Ab initio QM/MM dynamics of anion−water hydrogen bonds in aqueous solution. Chem. Phys. Lett. 2005, 403, 314−319.
(27) Friedman, H. L.; Krishnan, C. V. Studies of hydrophobic bonding in aqueous alcohols: Enthalpy measurements and model calculations. J. Solution Chem. 1973, 2 (2), 119−140.
(28) Shekaari, H.; Kazempour, A. Dehydration effect of ionic liquid, 1-pentyl-3-methylimidazolium bromide, on the aqueous d-glucose solutions: Thermodynamic study. J. Taiwan Inst. Chem. Eng. 2012, 43 (4), 650−657.
(29) Millero, J. F.; Lo Surdo, A.; Shin, C. The Apparent Molal Volumes and Adiabatic Compressibilities. J. Phys. Chem. 1978, 82 (7), 784−792.
(30) Weast, C. Handbook of Chemistry and Physics, 68th ed.; CRC Press, 1987.
(31) McDonald, T. R.; Beevers, C. The crystal and molecular structure ofα-glucose. Acta Crystallogr. 1952, 5, 654−659.
(32) Charalambous, G. Handbook of Food and Beverage Stability: Chemical, Biochemical, Microbiological, and Nutritional Aspects; Academ-ic Press: Orlando, 1986.
(33) Ditchfield, R.; Hehre, W. J.; Pople, J. A. Self-Consistent Molecular-Orbital Methods. IX. An Extended Gaussian-Type Basis for Molecular-Orbital Studies of Organic Molecules. J. Chem. Phys. 1971, 54, 724−728.
(34) Frisch, M. J.; Pople, J. A.; Binkley, J. S. Self-Consistent Molecular Orbital Methods. 25. Supplementary Functions for Gaussian Basis Sets. J. Chem. Phys. 1984, 80, 3265−3269.
Supporting information for:
Why saccharides are dehydrated in presence of electrolyte?
Insights from molecular modeling and thermodynamic
measurements.
Johanne Teychené*[a], Hélène Roux-de Balmann[a], Laurent Maron**[b], Sylvain Galier[a]
[a] Université de Toulouse, INPT, UPS, Laboratoire de Génie Chimique, F-31062 Toulouse cedex 09, France. CNRS, Laboratoire de Génie Chimique, F-31062 Toulouse cedex 09, France.
[b] Université de Toulouse, INSA Toulouse, 135 Avenue de Rangueil, 31077 Toulouse Cedex, France. * corresponding author: teychene@chime.ups-tlse.fr
** corresponding author: laurent.maron@irsamc.ups-tlse.fr
Figures...2
Tables...3
Gaussian 09 full reference. ...7
Computational details ...7
Electronic energies, enthalpies and cartesian coordinates of the stationary points on the potential energy surfaces...8
Figures
Figure S1: Sucrose hydration number (nH) versus the cation molality (mcation) for electrolytes containing Cl- (figure S1-a) and SO42- (Figure S1-b).
Figure S2: Sucrose hydration number (nH) versus the cation molality (mE) for electrolytes containing Cl- and SO42-.
Figure S3: Saccharide hydration number (nH) versus 𝑪𝑵𝒕𝒐𝒕𝒂𝒍 for electrolytes containing Cl-. ; CN cation : cation coordination number et mcation : cation molality.
Tables
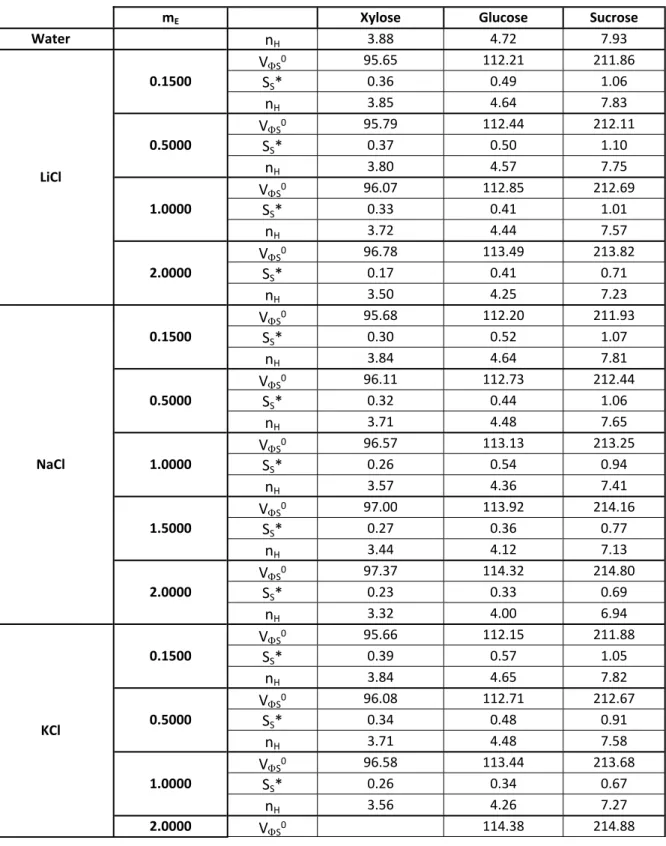
Table S1: Infinite-dilution apparent molar volumes 𝑽𝟎𝝓,𝑺 (cm3.mol−1) of the saccharides in electrolyte solutions, electrolyte molality mE (mol.kg-1), slopes (SS*) (cm3.kg.mol−2) and saccharide hydration numbers at infinite dilution (nH) at 298.15K.
mE Xylose Glucose Sucrose
Water nH 3.88 4.72 7.93 VS0 95.65 112.21 211.86 SS* 0.36 0.49 1.06 0.1500 nH 3.85 4.64 7.83 VS0 95.79 112.44 212.11 SS* 0.37 0.50 1.10 0.5000 nH 3.80 4.57 7.75 VS0 96.07 112.85 212.69 SS* 0.33 0.41 1.01 1.0000 nH 3.72 4.44 7.57 VS0 96.78 113.49 213.82 SS* 0.17 0.41 0.71 LiCl 2.0000 nH 3.50 4.25 7.23 VS0 95.68 112.20 211.93 SS* 0.30 0.52 1.07 0.1500 nH 3.84 4.64 7.81 VS0 96.11 112.73 212.44 SS* 0.32 0.44 1.06 0.5000 nH 3.71 4.48 7.65 VS0 96.57 113.13 213.25 SS* 0.26 0.54 0.94 1.0000 nH 3.57 4.36 7.41 VS0 97.00 113.92 214.16 SS* 0.27 0.36 0.77 1.5000 nH 3.44 4.12 7.13 VS0 97.37 114.32 214.80 SS* 0.23 0.33 0.69 NaCl 2.0000 nH 3.32 4.00 6.94 VS0 95.66 112.15 211.88 SS* 0.39 0.57 1.05 0.1500 nH 3.84 4.65 7.82 VS0 96.08 112.71 212.67 SS* 0.34 0.48 0.91 0.5000 nH 3.71 4.48 7.58 VS0 96.58 113.44 213.68 SS* 0.26 0.34 0.67 1.0000 nH 3.56 4.26 7.27 KCl 2.0000 VS0 114.38 214.88
SS* 0.28 0.53
nH 3.98 6.91
mE Xylose Glucose Sucrose VS0 95.76 112.37 212.07 SS* 0.36 0.50 1.03 0.1500 nH 3.81 4.59 7.76 VS0 96.17 112.92 212.84 SS* 0.34 0.49 0.97 0.4744 nH 3.69 4.42 7.53 VS0 96.66 113.56 213.73 SS* 0.34 0.41 0.79 0.9024 nH 3.54 4.23 7.26 VS0 97.04 114.35 214.46 SS* 0.30 0.21 0.72 MgCl2 1.2907 nH 3.42 3.99 7.04 VS0 95.91 112.48 211.95 SS* 0.32 0.47 1.11 0.1492 nH 3.77 4.55 7.80 VS0 96.38 113.20 213.21 SS* 0.33 0.44 0.88 0.4911 nH 3.62 4.34 7.42 VS0 97.23 114.12 214.28 SS* 0.31 0.39 0.76 0.9652 nH 3.37 4.06 7.09 VS0 97.68 115.10 215.00 SS* 0.29 0.19 0.77 CaCl2 1.4231 nH 3.23 3.76 6.87
mE Xylose Glucose Sucrose VS0 96.15 112.82 212.34 SS* 0.30 0.45 1.12 0.1500 nH 3.69 4.45 7.68 VS0 96.97 114.05 214.40 SS* 0.42 0.38 0.76 0.5000 nH 3.45 4.08 7.06 VS0 97.64 114.90 215.64 SS* 0.34 0.26 0.53 0.7500 nH 3.24 3.82 6.68 VS0 98.18 115.49 216.39 SS* 0.25 0.19 0.53 Na2SO4 1.0000 nH 3.08 3.64 6.45 VS0 112.68 212.73 SS* 0.49 0.93 0.1500 nH 4.49 7.56 VS0 113.41 213.58 SS* 0.42 0.83 0.3000 nH 4.27 7.31 VS0 97.35 114.23 214.60 SS* 0.23 0.27 0.67 K2SO4 0.5000 nH 3.33 4.02 7.00 VS0 95.86 112.45 212.40 SS* 0.42 0.54 1.00 0.1472 nH 3.78 4.56 7.66 VS0 96.73 113.57 213.90 SS* 0.29 0.41 0.72 0.4703 nH 3.52 4.22 7.21 VS0 97.61 114.63 215.38 SS* 0.23 0.25 0.54 0.8880 nH 3.25 3.90 6.76 VS0 115.43 216.36 SS* 0.23 0.43 MgSO4 1.2614 nH 3.66 6.46
Gaussian 09 full reference.
Gaussian 09, Revision D.01, M. J. Frisch, G. W. Trucks, H. B. Schlegel, G. E. Scuseria, M. A. Robb, J. R. Cheeseman, G. Scalmani, V. Barone, G. A. Petersson, H. Nakatsuji, X. Li, M. Caricato, A. Marenich, J. Bloino, B. G. Janesko, R. Gomperts, B. Mennucci, H. P. Hratchian, J. V. Ortiz, A. F. Izmaylov, J. L. Sonnenberg, D. Williams-Young, F. Ding, F. Lipparini, F. Egidi, J. Goings, B. Peng, A. Petrone, T. Henderson, D. Ranasinghe, V. G. Zakrzewski, J. Gao, N. Rega, G. Zheng, W. Liang, M. Hada, M. Ehara, K. Toyota, R. Fukuda, J. Hasegawa, M. Ishida, T. Nakajima, Y. Honda, O. Kitao, H. Nakai, T. Vreven, K. Throssell, J. A. Montgomery, Jr., J. E. Peralta, F. Ogliaro, M. Bearpark, J. J. Heyd, E. Brothers, K. N. Kudin, V. N. Staroverov, T. Keith, R. Kobayashi, J. Normand, K. Raghavachari, A. Rendell, J. C. Burant, S. S. Iyengar, J. Tomasi, M. Cossi, J. M. Millam, M. Klene, C. Adamo, R. Cammi, J. W. Ochterski, R. L. Martin, K. Morokuma, O. Farkas, J. B. Foresman, and D. J. Fox, Gaussian, Inc., Wallingford CT, 2016.
Computational details
All DFT calculations were performed with Gaussian 09. Geometries were fully optimized in gas phase at 298.15 K and 1 atm, without symmetry constraints at the DFT level employing the hybrid density functional B3PW91[13]. For the Li, Na, K, Mg, Ca, H, O, Cl et S atoms, a double-zeta 6-31G[33] basis set augmented by a polarization function[34] were used.
Electronic energies, enthalpies and cartesian coordinates of the stationary points on the potential energy surfaces.
Li+ (H 2O)n
Li+ (H 2O)
Figure S4 : Li+ optimized structure with 1 water molecule.
E = -83.706570 H = -83.705626 Li -0.111316 0.000000 -0.109711 O 0.093477 0.000000 1.728684 H 0.925639 0.000000 2.219358 H -0.609240 0.000000 2.391623 Li+ (H 2O)2
Figure S5 : Li+ optimized structure with 2 water molecules.
E = -152.844745 H = -152.843800
Li -0.974695 0.000096 0.568741 H 1.227958 0.000043 1.972358 H 0.062564 -0.000087 2.979450 O -2.219997 0.000230 -0.888932 H -2.016761 -0.000009 -1.832399 H -3.183108 -0.000234 -0.825908 Li+ (H 2O)3
Figure S6 : Li+ optimized structure with 3 water molecules.
E = -229.251831 H = -229.250887 O -0.015661 0.000316 1.767236 Li -0.797324 0.000013 -0.022581 O -2.737018 -0.000043 -0.251573 H 0.921694 0.003662 1.991296 H -0.484930 -0.003957 2.609044 H -3.222397 0.000064 -1.084201 H -3.407319 0.000842 0.440933 O 0.369696 -0.000051 -1.588111 H 1.333484 -0.000302 -1.595281 H 0.102808 -0.000086 -2.514286
Li+ (H 2O)4
Figure S7 : Li+ optimized structure with 4 water molecules.
E = -305.646717 H = -305.645773 O -0.136238 0.251761 1.702928 Li -0.999037 -0.423053 0.037620 O 0.214014 -0.077729 -1.507242 O -2.729947 0.505090 -0.303377 H -0.057550 1.161152 2.009550 H 0.118122 -0.304697 2.446731 H -2.944744 0.974517 -1.116444 H -3.417021 0.738008 0.329778 H 1.043779 0.408212 -1.452921 H 0.203796 -0.493199 -2.375882 O -1.332949 -2.376930 0.256510 H -0.699965 -3.098257 0.177410 H -2.204750 -2.786135 0.268660
Li+ (H 2O)5
Figure S8 : Li+ optimized structure with 5 water molecules.
E = -382.034409 H = -382.033465 O 0.818674 -0.353806 2.164514 Li -0.579747 -0.331782 0.769583 O -2.770497 -0.297458 -1.415445 O -1.535313 -2.005701 0.340495 O -0.239573 0.638633 -0.918007 H 1.576102 0.237735 2.228437 H 0.956786 -1.039675 2.826480 H -3.453102 -0.286575 -2.096229 H -3.098431 0.221642 -0.663555 H 0.522887 0.651599 -1.504413 H -1.021674 0.430446 -1.462768
H -1.216760 -2.899761 0.183774 H -2.097410 -1.760251 -0.418302 O -2.329587 0.743057 1.203984 H -2.222827 1.693479 1.337045 H -2.851702 0.429746 1.953232 Li+ (H 2O)6
Figure S9 : Li+ optimized structure with 6 water molecules.
E = -458.426216 H = -458.425272 O 0.818674 -0.353806 2.164514 Li -0.579747 -0.331782 0.769583 O -1.535313 -2.005701 0.340495 O -0.239573 0.638633 -0.918007 O -2.329587 0.743057 1.203984 O -2.770497 -0.297458 -1.415445 H 1.576102 0.237735 2.228437
H 0.956786 -1.039675 2.826480 H -3.453102 -0.286575 -2.096229 H -3.098431 0.221642 -0.663555 H 0.522887 0.651599 -1.504413 H -1.021674 0.430446 -1.462768 H -1.216760 -2.899761 0.183774 H -2.097410 -1.760251 -0.418302 H -2.222827 1.693479 1.337045 H -2.851702 0.429746 1.953232 O -0.328571 -1.170157 -0.716679 H 0.219259 -0.791961 -1.394432 H -1.033652 -1.664124 -1.118371 Li+ (H 2O)7
Figure S10 : Li+ optimized structure with 7 water molecules.
E = -534.817476 H = -534.816532
O 1.267867 -1.730082 2.266237 Li 0.105597 -1.119374 0.781848 O -0.727542 0.777359 -1.815988
O 1.035367 -1.135429 -0.972838 O -1.697216 -1.908177 0.716444 O -3.060269 -0.166446 -0.885643 O -2.983125 1.569231 1.042557 H 2.217084 -1.881884 2.211940 H 0.992714 -2.032065 3.137948 H -3.894755 -0.287194 -1.352311 H -3.207707 0.514214 -0.162876 H -0.743801 1.459815 -2.495749 H -1.652272 0.446208 -1.694956 H -1.899103 -2.846332 0.653436 H -2.315901 -1.439258 0.114612 H -3.466597 1.455071 1.867534 H -2.036419 1.456038 1.250643 H 1.321227 -1.884808 -1.503688 H 0.548122 -0.530396 -1.565564 O -0.262386 0.929407 0.815696 H -0.326617 1.120988 -0.152082 H 0.435036 1.494700 1.168060 Li+ (H 2O)8
Figure S11 : Li+ optimized structure with 8 water molecules. E = -611.204611 H = -611.203667 O 1.500144 -1.216588 1.567900 Li -0.428585 -0.979776 1.606160 O -1.365364 -2.094219 0.169051 O 1.203842 -1.648857 -1.020402 O -0.331697 1.005299 0.911500 O -0.376644 0.698804 -1.723824 O -2.890308 -0.153512 -0.984986 O -2.943566 1.174151 1.387008 H 1.626137 -1.390287 0.596943 H 2.127166 -1.766497 2.046266 H -3.703922 -0.279124 -1.486461 H -3.112418 0.378793 -0.183328 H -0.244658 1.361206 -2.411353 H -1.322599 0.440140 -1.739082 H -1.814468 -2.890255 0.475493 H -2.034933 -1.556581 -0.310639
H -3.444380 1.972049 1.592094 H -1.994588 1.425363 1.307635 H 0.388824 -2.160357 -0.898874 H 0.900721 -0.847125 -1.476662 H -0.208723 1.036551 -0.072044 H 0.478567 1.347343 1.309410 O -1.817035 -0.806213 2.992647 H -1.827033 -0.855346 3.952799 H -2.467139 -0.133826 2.719425 Li+ (H 2O)9
Figure S12 : Li+ optimized structure with 9 water molecules.
E = -687.593539 H = -687.592595 O 0.675643 -3.177079 1.664390 Li -0.567893 -1.693651 1.464221 O -1.648918 -0.869320 2.935401 O -1.713868 -1.985469 -0.094443 O -0.622210 2.116917 0.442156
O 2.879162 -1.833719 1.106277 O -1.416401 1.477811 -1.934439 O -2.879376 1.247528 1.592296 O -3.452683 0.047319 -0.781116 H 1.594448 -2.856308 1.476838 H 0.742179 -3.899364 2.294255 H -4.370067 -0.100514 -1.035711 H -3.455061 0.494321 0.097331 H -1.605858 2.090416 -2.652054 H -2.238277 0.977605 -1.751387 H -1.527979 -2.656738 -0.756770 H -2.391939 -1.382350 -0.456904 H -3.428748 1.903219 2.036893 H -2.067652 1.717370 1.268681 H 3.344410 -1.969438 0.274406 H 2.362511 -1.014915 1.006961 H -0.856448 1.967902 -0.526668 H -0.228905 2.994155 0.511697 H -2.201417 -1.385655 3.530676 H -2.201922 -0.133239 2.604148 O 0.730664 -0.063196 1.406722 H 0.812529 0.145414 2.345997 H 0.368485 0.753296 0.992665 Li+ (H 2O)10
Figure S13 : Li+ optimized structure with 10 water molecules. E = -763.981303 H = -763.980359 O 0.543817 -3.212290 1.621355 Li -0.677924 -1.727979 1.379449 O -2.004733 -1.051750 2.815261 O 0.583020 -0.134389 1.441446 O -1.813697 -2.039255 -0.195171 O 2.750367 -1.819962 1.359076 O -3.435565 0.054489 -0.991793 O -2.960293 1.141191 1.459551 O -0.723529 2.098343 0.413468 O -1.375267 1.552219 -2.038891 H 1.476247 -2.877986 1.541269 H 0.565202 -4.066769 2.058232 H -4.339847 -0.092242 -1.290429 H -3.480843 0.479661 -0.104326 H -1.545196 2.185550 -2.743218 H -2.195908 1.036735 -1.905540 H -1.499387 -2.622405 -0.892420
H -2.419533 -1.390736 -0.606175 H -3.511083 1.791652 1.910554 H -2.128758 1.613432 1.173512 H 3.289752 -1.896595 0.565433 H 2.191134 -1.025668 1.242941 H -0.895308 2.005591 -0.571455 H -0.346800 2.971739 0.567289 H -2.703207 -1.647997 3.107385 H -2.448945 -0.264626 2.422623 H 0.572958 0.094762 2.407292 H 0.297030 0.680457 0.982035 O 0.129302 0.274031 4.029607 H -0.671528 -0.277254 3.994111 H 0.704946 -0.115078 4.696697 Li+ (H 2O)11
Figure S14 : Li+ optimized structure with 11 water molecules.
E = -840.366244 H = -840.365300
Li -0.677924 -1.727979 1.379449 O -1.813697 -2.039255 -0.195171 O 0.583020 -0.134389 1.441446 O -2.004733 -1.051750 2.815261 O 2.750367 -1.819962 1.359076 O 0.129302 0.274031 4.029607 O -2.960293 1.141191 1.459551 O -0.723529 2.098343 0.413468 O -1.375267 1.552220 -2.038891 O -3.435565 0.054489 -0.991793 H 1.476247 -2.877986 1.541269 H 0.565202 -4.066769 2.058232 H -4.339847 -0.092242 -1.290429 H -3.480843 0.479661 -0.104326 H -1.545196 2.185551 -2.743218 H -2.195908 1.036736 -1.905540 H -1.499387 -2.622405 -0.892420 H -2.419533 -1.390736 -0.606175 H -3.511083 1.791652 1.910554 H -2.128758 1.613432 1.173512 H 3.289752 -1.896595 0.565433 H 2.191134 -1.025668 1.242941 H -0.895308 2.005591 -0.571455 H -0.346800 2.971739 0.567290 H -2.703207 -1.647997 3.107385 H -2.448945 -0.264626 2.422623 H 0.572958 0.094762 2.407292 H 0.297030 0.680457 0.982035
H -0.671528 -0.277254 3.994111 H 0.704946 -0.115078 4.696697 O -1.747677 -3.079940 1.326852 H -2.631160 -3.295125 1.601901 H -1.124693 -3.472344 1.927194
Na+ (H 2O)n
Na+ (H 2O)
Figure S15 : Na+ optimized structure with 1 water molecule.
E = -76.408209 H = -76.407265 Na -0.107909 0.000000 -0.183683 O 0.098617 0.000000 2.030680 H 0.914407 0.000000 2.546154 H -0.606556 0.000000 2.689404 Na+ (H 2O)2
Figure S16 : Na+ optimized structure with 2 water molecules.
E = -152.813067 H = -152.812123 O 0.029916 -0.257099 2.441534 Na 0.427524 0.807546 0.510660 H 0.620120 -0.842347 2.930850 H -0.777446 -0.226394 2.968434 O 0.830130 1.883065 -1.415490 H 0.708693 1.551577 -2.312960
H 1.165296 2.780350 -1.527864
Na+ (H 2O)3
Figure S17 : Na+ optimized structure with 3 water molecules.
E = -229.212399 H = -229.211455 O -0.165035 -0.754009 1.920779 Na 0.577092 1.216110 1.076036 O 0.593473 1.552682 -1.166871 H 0.308273 -1.358884 2.503103 H -1.022868 -1.168666 1.775210 H 1.028687 1.014541 -1.837691 H 0.167822 2.265209 -1.656898 O 1.303266 2.846840 2.475611 H 0.818172 3.256988 3.200511 H 2.164236 3.280124 2.475511 Na+ (H 2O)4
Figure S18 : Na+ optimized structure with 4 water molecules. E = -305.604745 H = -305.603801 O -0.382750 -0.545501 1.692928 Na 0.934957 1.048677 0.673539 O -0.124864 1.887823 -1.193874 O 1.334490 2.782080 2.141326 H -0.119166 -1.206129 2.342386 H -1.313722 -0.721761 1.519531 H 0.109006 1.715182 -2.112205 H -0.857234 2.512057 -1.234491 H 1.158025 2.786275 3.088240 H 1.662323 3.665789 1.943151 O 2.931565 0.066716 0.065436 H 3.815668 0.412433 0.228777 H 3.070467 -0.787504 -0.357308 Na+ (H 2O)5
Figure S19 : Na+ optimized structure with 5 water molecules. E = -381.989449 H = -381.988505 O -0.351339 -0.663960 1.733218 Na 1.151766 0.907002 0.938066 O 0.561394 1.955909 -1.012212 O 0.873537 2.871389 2.448242 O 2.263717 -0.203846 -1.005877 H -0.162566 -1.422804 2.295375 H -1.299728 -0.698530 1.569273 H 1.089679 1.402406 -1.604373 H 0.053592 2.559131 -1.561711 H 0.305805 2.905974 3.226576 H 0.836033 3.757232 2.069393 H 3.219546 -0.128191 -1.107234 H 2.040154 -1.070837 -1.363185 O 3.049468 1.204140 2.189869 H 3.905394 0.956748 2.550341 H 2.749043 1.986015 2.673887 Na+ (H 2O)6
Figure S20 : Na+ optimized structure with 6 water molecules. E = -458.376198 H = -458.375254 O 0.040906 -0.630113 1.083937 Na 1.190545 1.375132 0.660449 O 0.898207 2.252238 -1.402381 O 2.780869 1.329131 2.469564 O 0.642517 3.049338 2.406349 O 1.793090 -0.310461 -0.970703 H 0.452902 -0.934059 1.934270 H -0.884432 -0.893263 1.112740 H 1.161815 1.442283 -1.864777 H 0.501454 2.838280 -2.052377 H -0.088937 2.932059 3.025007 H 0.662309 3.995787 2.219237 H 2.465385 -0.901434 -1.322985 H 1.144376 -0.862203 -0.497320 H 3.730776 1.476477 2.537973 H 2.342807 2.097170 2.873955 O 1.360552 -0.947698 3.345966
H 2.052899 -0.272087 3.235486 H 1.789612 -1.742576 3.678421
Na+ (H 2O)7
Figure S21 : Na+ optimized structure with 7 water molecules.
E = -534.765590 H = -534.764646 O 0.228849 -0.349015 0.911301 Na 1.930438 1.373728 0.855610 O 0.606690 1.608760 -1.094897 O 2.781638 0.922782 3.204514 O 1.439062 -1.020550 -1.424965 O 0.852185 2.654214 2.627368 O 0.197976 0.136408 3.591189 H 0.027802 -0.466488 1.861107 H -0.505968 0.150723 0.534183 H 0.821462 0.778885 -1.560887 H 0.437723 2.268180 -1.774660 H 0.291603 1.992844 3.075749 H 0.401021 3.501416 2.702304 H 1.272484 -1.774364 -2.000601
H 0.976574 -1.185853 -0.579831 H 3.650523 0.708886 3.562098 H 2.564968 1.828657 3.475035 H 1.170504 0.122214 3.701306 H -0.191363 -0.257929 4.379474 O 3.575074 0.261572 -0.272988 H 4.476867 0.303769 -0.601373 H 3.088031 -0.356537 -0.849395 Na+ (H 2O)8
Figure S22 : Na+ optimized structure with 8 water molecules.
E = -611.160863 H = -611.159919 O -0.002982 0.005891 0.950253 Na 1.660429 1.844663 0.610506 O 3.283857 0.052606 0.348702 O 1.082824 1.684698 -1.591248 O 0.476361 2.733103 2.645725 O 3.118226 0.260307 3.121544 O 1.322293 -1.055994 -1.117717
O 0.575109 0.196453 3.540068 H 0.082636 -0.152988 1.922385 H -0.926913 0.233010 0.797737 H 1.110950 0.735191 -1.805918 H 1.032124 2.160468 -2.424796 H 0.345384 1.912792 3.175745 H -0.234987 3.339693 2.875112 H 1.172497 -1.920381 -1.515090 H 0.695409 -0.949691 -0.367496 H 3.306765 -0.091106 2.230610 H 3.361438 1.201304 3.048147 H 1.583718 0.138403 3.484881 H 0.292847 -0.270750 4.333850 H 4.163748 0.117041 -0.037917 H 2.768815 -0.553131 -0.230541 O 3.080720 2.943616 2.247464 H 3.725311 3.647299 2.375854 H 2.252238 3.209537 2.694728 Na+ (H 2O)9
Figure S23 : Na+ optimized structure with 9 water molecules. E = -687.547731 H = -687.546786 O -0.620989 -0.405963 0.961132 Na 2.676819 2.224305 0.554858 O 1.067297 1.981661 -1.224820 O 3.581491 2.936636 2.647916 O 3.517707 0.070497 0.283747 O 0.994587 2.736662 2.057098 O 0.593940 0.376104 3.288746 O 3.179969 0.097074 3.097255 O 1.188553 -0.626251 -0.780539 H -0.261653 -0.317354 1.869660 H -1.038033 0.460463 0.784886 H 1.057974 0.987974 -1.276279 H 1.086070 2.306709 -2.131819 H 0.756614 1.959750 2.616516 H 0.155074 2.959601 1.617181 H 1.018735 -1.363180 -1.378068 H 0.452373 -0.636749 -0.055000
H 3.409664 -0.177703 2.191423 H 3.529193 1.001626 3.171059 H 1.569620 0.146633 3.318021 H 0.236378 0.254663 4.175043 H 4.324955 -0.305124 -0.083635 H 2.753511 -0.398123 -0.140529 H 4.208597 3.492503 3.123001 H 2.686409 3.253540 2.867168 O -1.172291 2.273938 0.413482 H -2.016724 2.653937 0.147342 H -0.571461 2.302931 -0.357336 Na+ (H 2O)10
Figure S24 : Na+ optimized structure with 10 water molecules.
E = -763.939139 H = -763.938195 O -0.713395 -0.451660 1.174553 O 0.945889 -0.810328 -0.693857 O 0.807884 1.736495 -1.384391 Na 2.580114 2.284537 0.259286 O 0.941808 2.609423 1.981035
O 3.307689 0.028280 0.213019 O 3.497321 3.007984 2.461216 O 0.718542 0.308351 3.379573 O 3.290298 0.214402 3.029511 O -1.243700 2.209618 0.384311 H -0.262151 -0.334380 2.039241 H -1.123812 0.413062 0.981389 H 0.812742 0.743117 -1.325080 H 0.756681 1.955623 -2.321046 H 0.763415 1.858680 2.595084 H 0.073934 2.809438 1.584179 H 0.744935 -1.605795 -1.199130 H 0.264652 -0.752700 0.079387 H 3.419927 -0.060229 2.102761 H 3.546801 1.154905 3.031128 H 1.711563 0.151635 3.332917 H 0.442685 0.169310 4.291770 H 4.088937 -0.361357 -0.193705 H 2.525668 -0.476590 -0.125555 H 4.023883 3.629344 2.974578 H 2.555888 3.228563 2.608838 H -2.077173 2.608380 0.112635 H -0.667145 2.148476 -0.407343 O 3.823810 3.808901 -0.956882 H 3.728665 4.166166 -1.845586 H 4.593389 4.254095 -0.586680
Na+ (H 2O)11
Figure S25 : Na+ optimized structure with 11 water molecules.
E = -840.327442 H = -840.326498 O -0.741788 -0.163158 0.637903 O 1.318745 -0.558187 -0.791125 O 1.695511 2.093765 -0.854969 Na 2.959853 1.955694 1.235880 O 3.439116 3.704385 -2.446038 O 3.356955 -0.364635 0.909016 O 0.960304 2.350940 2.530043 O 3.331067 2.153353 3.646338 O 0.039976 -0.084977 3.268548 O 2.565959 -0.605128 3.601147
O -0.662042 2.639153 0.343269 H -0.553647 -0.283442 1.593902 H -0.944723 0.787221 0.537451 H 1.581739 1.146361 -1.104167 H 2.161479 2.552735 -1.574286 H 0.508490 1.556799 2.897991 H 0.292853 2.766737 1.953548 H 1.155305 -1.234685 -1.456967 H 0.465940 -0.478906 -0.223770 H 2.912675 -0.754178 2.701437 H 2.946700 0.254528 3.857466 H 0.973449 -0.408849 3.456997 H -0.512780 -0.336360 4.015837 H 4.165990 -0.816262 0.647247 H 2.656148 -0.629246 0.258789 H 3.823742 2.613491 4.333304 H 2.431524 2.536253 3.617777 H -1.323001 3.209697 -0.061905 H 0.115270 2.595851 -0.259799 H 3.112621 4.565678 -2.733219 H 3.956156 3.363923 -3.185942 O 4.427649 3.382313 0.202313 H 5.225963 3.851143 0.460902 H 4.245199 3.625365 -0.721121 Na+ (H 2O)12
Figure S26 : Na+ optimized structure with 12 water molecules. E = -916.709122 H = -916.708178 O -0.964290 0.054262 0.723736 O 0.944283 -0.667761 -0.792290 O 3.006080 -0.773544 0.898599 Na 3.201359 1.620595 1.117559 O 4.135875 3.880922 0.162605 O 1.241410 2.299199 2.488114 O 3.552919 1.780554 3.576299 O 1.796660 1.861625 -0.889989 O -0.403875 2.792611 0.363713 O -0.025612 0.056139 3.308428 O 2.388630 -0.840839 3.612880 O 3.413526 3.510436 -2.551338 H -0.734036 -0.084996 1.667843 H -1.001944 1.024451 0.616435 H 1.521116 0.942086 -1.120304 H 2.224689 2.271901 -1.659058 H 0.686227 1.579906 2.870261
H 0.629521 2.805639 1.923575 H 0.658255 -1.323925 -1.436412 H 0.137562 -0.451962 -0.196271 H 2.653869 -1.055991 2.697432 H 2.895859 -0.032941 3.814974 H 0.853402 -0.403697 3.489252 H -0.582660 -0.067541 4.083973 H 3.768929 -1.247648 0.551853 H 2.263282 -0.931601 0.264105 H 4.062285 2.170180 4.293632 H 2.706008 2.269047 3.509387 H -0.969668 3.445074 -0.060969 H 0.345031 2.591599 -0.245786 H 3.056152 4.163947 -3.164413 H 4.157231 3.101907 -3.011083 H 4.244464 4.776189 0.498612 H 3.875590 3.960778 -0.773416 O 5.437045 1.533578 0.320516 H 6.278408 1.292966 0.719320 H 5.420036 2.504727 0.265497 Na+ (H 2O)13
Figure S27 : Na+ optimized structure with 13 water molecules. E = -993.105967 H = -993.102023 O -1.206768 0.164724 0.972778 O 0.596494 -0.738747 -0.578048 O 2.729125 -0.857389 0.994766 Na 2.979845 1.523915 1.157870 O 5.431839 1.406495 0.241138 O 1.561904 1.762554 -0.786388 O 1.157136 2.332993 2.607910 O 3.505957 1.731993 3.569939 O 4.016657 3.628757 0.181026 O -0.512708 2.853040 0.518756 O -0.201825 0.190170 3.539208 O 2.186927 -0.817931 3.739175 O 3.345069 3.070904 -2.367001 H -0.964778 0.043843 1.915706 H -1.196104 1.131790 0.832674 H 1.231173 0.865915 -1.017218 H 2.023967 2.156874 -1.554012
H 0.575001 1.664184 3.037724 H 0.557134 2.847005 2.035080 H 0.243390 -1.411709 -1.169414 H -0.168965 -0.444787 0.037725 H 2.394979 -1.057048 2.815270 H 2.748882 -0.039376 3.905952 H 0.658129 -0.308699 3.692997 H -0.734846 0.106240 4.336634 H 3.408454 -1.474850 0.705321 H 1.943529 -0.999101 0.403867 H 4.059898 2.108131 4.261157 H 2.675344 2.252743 3.537001 H -1.048905 3.535450 0.102601 H 0.196924 2.589810 -0.116216 H 3.260276 3.667948 -3.117878 H 4.110973 2.453679 -2.559028 H 4.171823 4.537944 0.455702 H 3.756931 3.646745 -0.772253 H 6.247497 1.266239 0.734413 H 5.231380 2.369479 0.280345 O 5.402822 1.482823 -2.503972 H 5.558738 1.283569 -1.556181 H 5.421268 0.645743 -2.977753 Na+ (H 2O)14
Figure S28 : Na+ optimized structure with 14 water molecules. E = -1069.489185 H = -1069.488240 O -1.534817 0.372645 1.172990 O 0.053553 -0.646881 -0.558213 O 2.171026 -1.022638 1.091620 Na 2.711016 1.321388 1.085784 O 1.210747 1.745860 -0.777488 O 1.122208 2.335286 2.669688 O 3.461049 1.436083 3.456110 O 4.008103 3.297907 0.138127 O 6.376650 2.045238 -0.434633 O -0.641927 3.016866 0.690860 O 3.127316 2.911240 -2.406121 O 5.143445 1.184899 -2.617942 O -0.332665 0.289497 3.658122 O 1.912232 -0.995988 3.820366 H -1.217123 0.209742 2.086663 H -1.444065 1.336434 1.047907
H 0.790889 0.871217 -0.964110 H 1.681214 2.063194 -1.569257 H 0.525950 1.687431 3.115816 H 0.521035 2.898434 2.148143 H -0.406886 -1.245664 -1.155259 H -0.631177 -0.313784 0.120298 H 2.030638 -1.283401 2.892176 H 2.556578 -0.271548 3.909892 H 0.475491 -0.302502 3.787213 H -0.836116 0.271368 4.478649 H 2.984461 -1.210433 0.599581 H 1.417855 -1.132841 0.470394 H 4.107653 1.736804 4.102123 H 2.695385 2.045475 3.497160 H -1.174074 3.722429 0.309902 H -0.019872 2.692668 -0.003624 H 3.035419 3.557513 -3.114277 H 3.840039 2.278343 -2.674842 H 3.942737 4.187369 0.502864 H 3.652355 3.343585 -0.781340 H 7.208568 2.503527 -0.277710 H 5.650506 2.622860 -0.108830 H 5.804751 1.550640 -1.978653 H 5.621186 0.835317 -3.377497 O 4.431749 -0.013760 -0.156836 H 5.313431 0.220578 0.165112 H 4.518506 0.105034 -1.118568
Na+ (H 2O)15
Figure S29 : Na+ optimized structure with 15 water molecules.
E = -1145.872115 H = -1145.871171 O -1.071925 0.218907 0.740908 O 0.049737 0.455214 -1.759747 O 1.402085 2.487493 -0.649398 Na 2.933408 1.635589 0.999909 O 4.315883 -1.618200 3.198950 O 0.003297 2.557943 3.506582 O 2.524459 2.144913 3.245276 O 4.240607 -0.406224 0.694426 O 4.700964 2.952297 -0.075257 O -0.739454 2.977481 0.867432 O -0.747317 -0.157246 3.519303 O 1.920689 -0.546931 3.696170 O 3.322990 3.715227 -2.215672
O 4.165664 1.625903 -3.508000 O 5.706754 0.767389 -1.393177 H -1.205436 -0.117528 1.647228 H -1.105792 1.194306 0.823557 H 0.957322 1.758502 -1.157768 H 1.870847 3.046136 -1.300099 H -0.388921 1.670305 3.632402 H -0.336837 2.864672 2.643307 H -0.520238 0.524628 -2.531524 H -0.507988 0.120228 -1.032996 H 2.746436 -1.093657 3.665964 H 2.235713 0.379337 3.746740 H 0.160218 -0.496816 3.696244 H -1.318858 -0.532171 4.197953 H 4.479199 -1.285127 2.293444 H 4.508586 -2.560617 3.182344 H 3.023169 2.623551 3.915576 H 1.547903 2.385940 3.389907 H -1.379520 3.616459 0.537819 H 0.046893 2.996488 0.264935 H 3.338913 4.547629 -2.699257 H 3.624205 2.989718 -2.839695 H 5.261371 3.601736 0.363208 H 4.264103 3.413156 -0.838294 H 6.662610 0.657145 -1.447496 H 5.539838 1.583230 -0.867096 H 4.786999 1.181574 -2.893037 H 4.545960 1.571374 -4.389660
H 4.796918 -0.347335 -0.101674 H 3.359473 -0.740848 0.436973 O 1.634986 -0.325514 1.000398 H 0.687799 -0.237382 0.772016 H 1.655986 -0.552662 1.957132 Na+ (H 2O)16
Figure S30 : Na+ optimized structure with 16 water molecules.
E = -1222.265425 H = -1222.264481 O -0.604666 0.162017 0.397265 O 0.606327 1.297568 -1.959020 O 1.373555 3.182438 -0.310569 Na 2.864457 2.256566 1.282495 O 1.971389 2.507872 3.466598 O 2.008574 0.114314 0.985641 O 4.200288 -1.388813 0.502191 O 4.723711 2.343724 -0.315455 O -0.582013 2.326960 3.449047
O 3.451158 3.807031 -2.170231 O 3.087866 1.271421 -3.230620 O -1.063113 2.896708 0.784237 O 2.159919 -0.212366 3.679246 O 4.832482 -0.449914 2.818612 O -0.564845 -0.477611 3.198797 O 5.045425 0.158460 -1.741498 H -0.842046 -0.281924 1.230677 H -0.903123 1.089388 0.504592 H 1.091522 2.440924 -0.926987 H 1.840193 3.795581 -0.902898 H -0.748118 1.363477 3.452002 H -0.897553 2.644539 2.579683 H 1.406328 1.011259 -2.437079 H 0.225118 0.534694 -1.500890 H 3.096739 -0.486065 3.597172 H 2.182506 0.762169 3.814324 H 0.363963 -0.626085 3.471544 H -1.105573 -1.050361 3.753582 H 4.684213 -0.862211 1.901544 H 5.492500 -0.997017 3.258944 H 2.251742 3.095321 4.176261 H 0.953162 2.507258 3.493104 H -1.806758 3.357634 0.381747 H -0.239126 3.252120 0.372739 H 3.681232 4.494302 -2.804362 H 3.292294 2.984872 -2.688485 H 5.284412 2.570860 0.447831
H 4.546844 3.109421 -0.900978 H 5.921787 0.028027 -2.120502 H 5.082968 0.980472 -1.182201 H 3.803231 0.740455 -2.799719 H 3.099279 1.051043 -4.168457 H 4.613804 -1.019914 -0.298996 H 3.292750 -1.011709 0.497457 H 1.073096 0.097982 0.662518 H 1.957750 -0.136432 1.936029 O 5.170383 2.178395 2.299550 H 5.596142 2.644843 3.025310 H 5.193459 1.216431 2.537912 Na+ (H 2O)17
Figure S31 : Na+ optimized structure with 17 water molecules.
E = -1298.650881 H = -1298.649937
O -0.572190 0.039608 0.357235 O 2.033779 0.370482 0.994717 Na 2.726209 2.609274 1.308174
O 0.983137 3.142030 -0.330951 O 1.766652 2.527530 3.516844 O 5.079234 2.213886 -0.401771 O 5.135087 2.150038 2.271085 O -0.767426 2.086638 3.476533 O 0.456000 1.217055 -2.001129 O 5.020097 0.047427 -1.800250 O 3.457794 3.932135 -2.109004 O -1.361287 2.659618 0.846470 O 3.025325 1.342033 -3.044589 O 4.791706 -0.427591 2.914967 O 4.158581 -1.257978 0.570261 O 2.115126 -0.181470 3.657250 O -0.531275 -0.699949 3.097463 H -0.753705 -0.471020 1.167487 H -1.002558 0.908604 0.502754 H 0.792911 2.402549 -0.989403 H 1.273388 3.886848 -0.870866 H -0.855447 1.113759 3.445140 H -1.121236 2.402253 2.621133 H 1.327998 0.986006 -2.373149 H 0.133120 0.462762 -1.482854 H 3.061659 -0.430273 3.595953 H 2.098836 0.787111 3.829216 H 0.406244 -0.751259 3.381517 H -1.013228 -1.347262 3.623352 H 4.656998 -0.812813 1.983628 H 5.423734 -0.996962 3.366961