Configuration and Evaluation of a Constrained
Nutrition Dialogue System
by
Eann Tuan
S.B., Massachusetts Institute of Technology (2016)
Submitted to the Department of Electrical Engineering and Computer
Science
in partial fulfillment of the requirements for the degree of
Masters of Engineering in Electrical Engineering and Computer
Science
at the
MASSACHUSETTS INSTITUTE OF TECHNOLOGY
June 2016
c
Massachusetts Institute of Technology 2016. All rights reserved.
Author . . . .
Department of Electrical Engineering and Computer Science
May 20, 2016
Certified by . . . .
James Glass
Senior Research Scientist
Thesis Supervisor
Accepted by . . . .
Christopher J. Terman
Chairman, Masters of Engineering Thesis Committee
Configuration and Evaluation of a Constrained Nutrition
Dialogue System
by
Eann Tuan
Submitted to the Department of Electrical Engineering and Computer Science on May 20, 2016, in partial fulfillment of the
requirements for the degree of
Masters of Engineering in Electrical Engineering and Computer Science
Abstract
Logging daily food intake and nutritional information is a proven way to lose weight. However, research shows that existing approaches for the prevention and treatment of excess weight gain are ineffective, burdensome, and often times, inaccurate. Thus, we have developed a natural language processing based nutrition application that translates spoken food diaries into nutritional database entries. These food diaries are compiled from a comprehensive list of specific food items from various databases, including the United States Department of Agriculture (USDA), that sum to more than 10,000 food items.
In this thesis, we describe the main components of the current nutrition system, the overall flow of the system architecture, and modifications of the previous system. We also discuss the creation of a constrained nutrition system specifically designed for user testing of 100 specific food items and the user studies that will assess the accuracy and efficiency of the application. We include an analysis of the modifications made for the user study, such as an alternate method for storing images, and an evaluation of the additional features added, such as the ability to save audio recordings. The work described in this thesis is part of an ongoing data collection, language understanding experiments, and updated user interface design conducted as part of a larger effort to create a nutrition dialogue system that can support the larger database of food items.
Thesis Supervisor: James Glass Title: Senior Research Scientist
Acknowledgments
First, I would like to thank Jim Glass for his guidance, advice, and support in the past two years. I am incredibly lucky to have had the opportunity to work with him and become a part of the Spoken Language Systems group for a brief time.
I would also like to thank Mandy Korpusik, who is responsible for the language understanding component of the system. Mandy really took the time and effort to answer my questions when I first joined the group. Her work is invaluable and I appreciate her mentorship immensely. I would also like to thank Rachael Naphtal for her work on the database lookup component of the system and the time she took to help me understand the back-end infrastructure. Even after she graduated, she was available by email and was extremely responsive. Scott Cyphers was also a consistent source of knowledge, helping to debug system issues and always available by email to answer any questions. Michael Price was also an important part of the development of this project, always available to address questions regarding Spoke and proxy servers. He spent quite a bit of time teaching me about proxy servers and their application to the nutrition system.
Finally, thank you to my family for being extremely supportive in obtaining my Master’s degree. I am so grateful for the opportunity to graduate MIT with two degrees, which would not be possible without my parents.
This research was sponsored in part by a grant from Quanta Computing, Inc., and by the NIH.
Contents
1 Introduction 17
1.1 Obesity in the United States . . . 17
1.2 Current Dialogue Systems . . . 18
1.3 A Nutrition Dialogue System . . . 19
1.4 A Nutrition System Prototype . . . 19
2 Background 23 2.1 Existing Nutritional Applications . . . 23
2.2 Previous Work . . . 24
3 Previous System Description 27 3.1 Previous Configuration . . . 27 3.2 Language Understanding . . . 29 3.2.1 Semantic Tagging . . . 29 3.2.2 Segmentation . . . 30 3.2.3 Context Resolution . . . 31 3.3 Database Lookup . . . 33 3.4 Image Search . . . 34
3.5 Previous User Interface . . . 35
3.5.1 Spoke . . . 37
3.6 Previous System Evaluation . . . 38
4 Refactoring the System 41
4.1 Central Planner/Server Architecture . . . 41
4.1.1 Separating the Central Planner and Servers . . . 41
4.2 Saving Audio . . . 43
4.2.1 Using Spoke to Capture Audio . . . 43
4.2.2 Creating a Proxy Server . . . 44
4.2.3 Storing the Recordings . . . 44
4.3 Optimizing the Image Cache . . . 45
4.3.1 Challenges of the Previous Implementation . . . 45
4.3.2 Linking Images to USDA Entries . . . 46
4.3.3 Amazon Mechanical Turk . . . 48
4.3.4 Image Search in the Current Framework . . . 50
4.4 Current User Interface . . . 52
4.5 Overview of the Current System . . . 54
4.6 Conclusion . . . 54
5 System Evaluation 57 5.1 Extracting a Subset of Foods . . . 57
5.2 User Study . . . 58
5.2.1 Amazon Mechanical Turk . . . 58
5.3 System Evaluation . . . 59
5.3.1 Analysis of Incorrect Images and USDA Hits . . . 62
5.4 Conclusion . . . 64
6 Conclusion 67 6.1 Summary of Contributions . . . 67
6.1.1 Current System Description . . . 68
6.1.2 System Refactoring . . . 68
6.1.3 System Evaluation . . . 69
6.2 Directions for Future Research . . . 69
6.2.2 Online and Offline Functionality . . . 70
6.2.3 Cache Expansion . . . 71
6.2.4 Customization and Personalization . . . 71
6.3 Looking Forward . . . 71
A User Study 73 A.1 List of 100 Food Items . . . 73
List of Figures
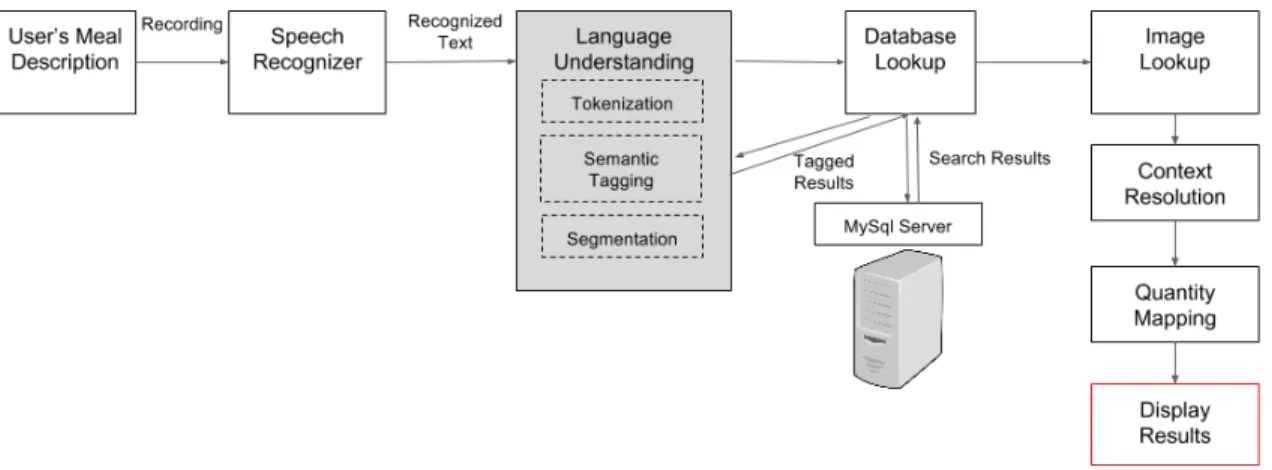
1-1 A diagram of an example use case where the user has described their breakfast to the system. In return, they receive a food log with exact nutritional information. . . 20 1-2 This flowchart describes the steps the nutrition prototype takes to
dis-play a food diary for the user. . . 21
2-1 A screenshot of the mobile application, Nutricam, an improvised sys-tem of educating patients with diabetes that targets three fundamental aspects of eating: scanning, cooking, and consuming the food. . . 24 2-2 Screenshots of the mobile application, My Fitness Pal, a calorie counter
that allows users to manually enter in their food items. . . 25
3-1 A diagram of the nutrition system’s previous architecture, where the client and server were not separated. . . 28 3-2 Semantic tagging of a user’s input, identifying each word in the
sen-tence as a Quantity, Brand, Description, Food, or Other [7]. . . 30 3-3 Sentence segmentation of a user’s input into two food segments “a bowl
of cereal” and “two cups of milk” [7]. . . 31 3-4 When the user first describes his meal of a glass of juice, the system
does not know the exact type of juice unless the user provides addi-tional context. . . 32 3-5 When the user provides additional information, the system is able
to perform context resolution and update the food description in the USDA Hits column to reflect the user’s meal. . . 33
3-6 A diagram of the system flow that shows how the system searches for the most relevant database match [13]. . . 35 3-7 The system cannot find the image for“Chobani strawberry yogurt”
because it is searching for a different image name than the one it was initially created under. It does, however, exist in the image directory. 36 3-8 The previous user interface of the nutrition system prototype,
display-ing a food log of the user’s meal of “3 eggs over easy and a stack of pancakes.” . . . 37 3-9 Previous work on the nutrition system includes Spoke’s Web Speech
API, integrating visual feedback using Spoke’s volume meter. When the user clicks the microphone, the microphone turns red to indicate that it is recording. . . 37 3-10 An AMT task for evaluating the accuracy of the previous system’s
ability to match the USDA hit, tag the user’s meal description, and match the quantity [7]. . . 38
4-1 This flowchart describes an overview of the system’s current architecture. 42 4-2 A screenshot of the mappings of each deployed system to their
respec-tive tomcat server in uriworkermap.properties. . . 43 4-3 There are many entries in the USDA Standard Reference database for
a keyword search of “fried chicken.” . . . 46 4-4 In the first AMT task, the instructions asks users to find the URL of
a relevant image for four food items. It also provides examples of ideal images. . . 48 4-5 For each hit in the first AMT task, Turkers are given four distinct food
descriptions from the USDA database and are asked to find the URL of the best image for each item. Here, the Turker was asked to provide an image for butter, coffee, McDonald’s hotcakes, and macaroni and cheese, and babyfood. We provided examples, indicating our standard for the most relevant image, to help them in the task. . . 49
4-6 For the second AMT task, the user is given three images that previous Turkers from the first task had selected for the specific food item. In this case, Turkers were asked to select the image that best represents “cheese, cottage, creamed, with fruit.” . . . 50 4-7 A MySQL database table, foodsWithNutrients, stores all of the
infor-mation for each food item in the USDA database. For the modified image search mechanism, we created an additional column that stores the image name for each image. . . 51 4-8 Rather than storing the image name in the additional column in
foodsWith-Nutrients, for the modified image search mechanism, we store the direct image path (e.g. “/scratch/images/1101.png”). . . 51 4-9 In the current framework, the images are retrieved as soon as a USDA
entry is matched to the user’s meal description. . . 53 4-10 The user has the option to further define their meal description of
“tomatoes” and select adjectives such as “crushed,” “green,” and “red.” 54
5-1 This figure shows the instructions for the AMT HIT launched to test the accuracy and performance of the nutrition system. . . 59 5-2 This figure shows an example of the results of a user’s meal description
while performing the AMT task to evaluate the system’s performance. 60 5-3 Because the system identifies “toast” as a food item, it searches for
the word “toast” in the database of 100 food items, where it exists as “bread, wheat.” As a result, the system will not load the correct image or USDA hit. . . 63 5-4 With the food item “tuna sandwich,” the current nutrition system
of 100 food items for the user study populates a food diary with the USDA hit “crackers, standard snack-type sandwich, with peanut butter filling,” rather than a tuna sandwich. . . 64
5-5 In the complete nutrition system, the food item “tuna sandwich” does produce accurate results, unlike in the smaller nutrition system due to the larger database of food items. . . 64
List of Tables
3.1 An example of the results of the CRF, which semantically tags each word in a user’s meal description and segments the sentence into food segments. . . 31
4.1 Outline of the foodWithNutrients database in MySQL. . . 47
5.1 Comparison of the accuracy of the quantity, selected USDA hit, and image between the results of the previous system and the results of the current system. . . 61 5.2 Common mistakes from the user study of image and USDA matching. 63
Chapter 1
Introduction
Access to exact records of what patients have eaten is a powerful tool to help nutri-tionists track how their patients are doing and the nutrition areas in which they need to improve. Dietary assessment can help manage obesity and chronic diseases, such as diabetes and cancer [9]. However, most interfaces designed to help users track their daily food intake are frustrating and very time intensive. In fact, when individuals are asked to track each meal, most stop by the third day, or intentionally modify their food intake to make it easier to log [20]. This large abandonment rate has created a serious problem for both the nutritionists and their patients. The following sections provide additional background information on obesity, which motivates the creation of a nutrition dialogue system prototype.
1.1
Obesity in the United States
Obesity is at epidemic levels in the United States and worldwide. According to the National Institute of Health, it is the second largest cause of preventable deaths in the United States [12]. More than one-third of American adults are obese and over two-thirds are overweight [5]. In addition to the rise in health related concerns caused by obesity, obesity related diseases and health problems account for 61 percent of healthcare costs in the US every year [4].
obesity-related diseases are expected to rise on average $48 billion each year year [4]. The next section describes the prevalence of current dialogue systems and its application in the medical domain.
1.2
Current Dialogue Systems
Voice controlled personal assistants have become increasingly widespread. From Siri to Cortana, these built-in assistants offer a seamless way of interacting with mobile devices and accomplishing tasks and queries. Among many tasks, these hands free personal assistants can read emails, text coworkers, and retrieve the latest weather updates [23].
While dialogue systems have recently become extremely popular and advanced, there is still a large focus on their research and development due to the inherent com-plexities of natural language processing: speech recognition, language understanding, dialogue management, and response generation [10].
Though dialogue systems have been explored in the context of many applications, one relatively unexplored application is the medical domain. In this work, we inves-tigate whether dialogue will be effective in helping users track their nutrient intake. Food diaries are not only helpful for nutritionists, but they are also valuable to pa-tients themselves for personal accountability. However, most interfaces designed to help people track their food intake can be cumbersome and inefficient, which has posed a consistent challenge to both nutritionists and their patients [22]. Improved methods are needed for the assessment of food intake that are more accurate and less burdensome that existing techniques.
Thus, in collaboration with the Tufts School of Nutrition, the work presented in this thesis describes a web-based nutrition system that uses natural language pro-cessing to automatically extract food concepts from a user’s spoken meal description. The system described in this thesis allows individuals to track their daily food intake, while decreasing user fatigue and providing a more natural and efficient way for users to interact with the system.
1.3
A Nutrition Dialogue System
In an effort to combat the rise in obesity in the United States, researchers have begun to explore the application of speech in the medical domain, specifically regarding food diaries. A review by Ngo et al noted that investigator burden may be reduced in the new methods compared to maintaining a traditional 7-day food record, but that under-reporting continues to be a limitation [14]. These new methods include the use of personal digital assistants, digital photography, and diet history assessments. In some cases, user burden may actually increase in association with searching the food database for specific foods [16]. Thus, there is a need to reduce user burden and in consequence, increase method accuracy when assessing food intake.
Existing applications, such as MyFitnessPal, for tracking nutrient intake require users to manually enter each food consumed by hand and select the correct item from a list of possibilities [21]. Another nutrition application, Calorie Count, does use speech recognition, but the user still only says one food item at a time and selects the correct food from a list, rather than our novel approach of using an understand-ing of long food descriptions to automatically select the appropriate food item and attributes [15]. With a spoken nutrition system, users can describe their meal, and the system automatically determines the nutrition content. The remainder of this thesis discusses a nutrition system prototype, initially implemented by members of the Spoken Language Systems group in an effort to address the problem of obesity.
1.4
A Nutrition System Prototype
This section describes the state of the current prototype and the flow of the nutri-tion dialogue system. Thus far, we have built an initial prototype that allows users to describe their meal and displays a food diary with exact nutritional information [8]. The display shows the segmented results of the speech recognizer, color coded, grouped by quantity, brand, food, or description. In the example shown in Figure 1-1 the user has described a breakfast of “a bowl of oatmeal followed by a banana and a
Figure 1-1: A diagram of an example use case where the user has described their breakfast to the system. In return, they receive a food log with exact nutritional information.
glass of milk.”
Once the user provides a meal description, a speech recognizer recognizes the recording and sends the recognized text is sent to the language understanding com-ponent of the system, shown in Figure 1-2. Here, tokenization, feature extraction, semantic tagging, and food-property association are performed. The results of the language understanding result are sent in a MySQL query to the USDA database, where we perform a lookup for the most accurate food item. After this search is performed, the system displays the nutrition facts for the user, shown in Figure 1-1. In the remainder of this thesis, we provide additional background information and describe the system architecture and flow of a constrained nutrition system with 100 food items. Then, we explore my main contribution to this project: the modifications and improvements to the system, specifically the ability to save and store audio, separating the client and servers, and optimizing the image search mechanism. We discuss ways in which we evaluate the system’s performance and accuracy. Lastly, we
Figure 1-2: This flowchart describes the steps the nutrition prototype takes to display a food diary for the user.
Chapter 2
Background
In this chapter, we provide background information on the initial prototype, includ-ing existinclud-ing nutritional applications and previous work by members of the Spoken Language Systems group.
2.1
Existing Nutritional Applications
Many applications currently exist that allow users to track nutritional intake. One of these applications, Nutricam, shown in Figure 2-1, is a mobile application that records dietary intake in adults with type 2 diabetes [16]. Through a research study, Nutricam allowed users to capture a photograph of food items before consumption and store a voice recording to explain the contents of the photograph. This information was then sent to a website where it was analyzed by a dietitian.
Furthermore, Tufts investigators have recently developed and tested a new remote system for self-monitoring of energy and macronutrient intakes in research studies, called NutriMeter, which has informed development of this project [3]. NutriMeter runs on a Windows Mobile-based smartphone with cellular wireless connectivity ca-pabilities, allowing the automated transfer of remote data from subjects in near real-time. Nevertheless, it uses acquired knowledge from previous interactions to decrease the number of questions that are generated to identify each specific food and its amount [19].
Figure 2-1: A screenshot of the mobile application, Nutricam, an improvised system of educating patients with diabetes that targets three fundamental aspects of eating: scanning, cooking, and consuming the food.
Two popular applications, My Fitness Pal, shown in Figure 2-2, and Calorie Counter, assist users in manually inputting their food diary, but with increased bur-den. In these applications, users search for their food and select the correct item from a list of related foods. The users then select the appropriate quantities from a set list, adding the selected food to their breakfast, lunch, or dinner meal.
Our project seeks to use many of the capabilities of these existing applications, while incorporating speech understanding to assist a user in pursuing a healthier lifestyle. The following sections describe previous work on this project done by mem-bers of the Spoken Language Systems group.
2.2
Previous Work
Previous work on this project includes preliminary language understanding, populat-ing the database, and data collection [7]. These components were in place to allow our work in the system’s refactoring and refinement.
Figure 2-2: Screenshots of the mobile application, My Fitness Pal, a calorie counter that allows users to manually enter in their food items.
The nutrition system uses a Conditional Random Field (CRF) model for semantic tagging and labels the relevant food items in the inputted sentences, as well as a variety of their properties, including brand, quantity, and description [17]. These models were trained using data from food diaries connected and processed using Human Intelligence Tasks (HITs) on Amazon Mechanical Turk (AMT). The language understanding and proper attribution of items and properties is currently an area of active development and will continue to evolve in accuracy.
Furthermore, our nutrition application has the capability of reconciling the most food items to reasonable database entries. Former Masters of Engineering student Rachael Naphtal constructed a cache of roughly 20,000 typical food items from a combination of databases, including USDA and Nutritionix [13]. This cache is used to generate default results for many food items [13]. Additionally, the nutrition system uses web-based deployment using Spoke, a JavaScript framework for building interactive speech-enabled web applications [18]. This is described in additional detail in Chaper 3.5. The remainder of this thesis describes the system in further detail,
including modifications and implementations made to the previous system, and the metrics used to evaluate the performance of the current nutrition system.
Chapter 3
Previous System Description
In this chapter, we give an overview of the previous system, including its architecture, language understanding, and database lookup mechanism. This will provide a base-line understanding of how the previous system functions and the work that was in place prior to our contributions to the system. In the following sections, we describe previous work on the nutrition system and include an overview of the flow of the system.
3.1
Previous Configuration
In this section, we discuss the main features of the previous system that will provide a general understanding for the rest of the thesis, where we explain specific components of the system that were modified and an analysis on the performance of the system. In the previous system’s configuration, once the user records his/her spoken meal de-scription, a speech recognizer sends the recognized text to the language understanding component of the system. Here, tokenization, feature extraction, semantic tagging, and food-property association are performed. The results are sent as an object to the client, where the tagged results are displayed.
Next, the system sends the recognized text back to the language understanding mechanism a second time to perform the database lookup and create the food diary. The same information to display the tagged result is generated a second time to
Figure 3-1: A diagram of the nutrition system’s previous architecture, where the client and server were not separated.
display the table of food items. This was initially implemented to decrease latency, the time it would take for the system to perform the language understanding and display the table. When only one call is made to the language understanding server to generate both the tagged result and table in the same call, there is a significant delay after the user’s recording to display the food diary.
In the previous system, all components of the system, shown in the diagram in Figure 3-1, including the language understanding and database lookup mechanism, were treated as a monolithic system, free of any modularization among the various components. The language understanding component is not a server, but rather a col-lection of algorithms that performs tokenization, semantic tagging, and segmentation of the recognized text.
This method of making two calls to the server was the solution to provide the user initial feedback while waiting a few extra seconds for the table to appear. From the user’s perspective, he/she records their meal description, sees the tagged result first, and then sees the food table with nutrition information shortly after.
In the following sections, we describe the language understanding and database lookup components that provide a basis for how the nutrition system works.
3.2
Language Understanding
In the language understanding portion of the system, we assume that individuals will be able to consistently enter information about their food consumption verbally [7]. For this project, we focused on American English and leveraged the advanced auto-matic speech understanding and natural language processing that we had previously developed [6]. The speech recognizer is a critical tool because it is able to process spoken utterances, and the language processor converts naturally spoken language into an internal semantic representation. In this project, we collect spoken data from users describing their food consumption, and this data is used to train and evaluate the stochastic models used by the speech recognizer and natural language parser.
The language understanding component of the nutrition system has two phases: semantic tagging to identify foods and their properties and segmenting these tag into food segments [7]. In the following sections, we provide an overview of these two phases, semantic tagging and segmentation, and the system’s ability to perform context resolution.
3.2.1
Semantic Tagging
The first phase of the language understanding component of the system is the seman-tic tagging of the user’s input. When generating the user’s food diary, we use the Condifitional Random Field model (CRF) to tag and label the relevant food items in the inputted sentences as well as their properties, such as brand, quantity, and description. These models were trained using data from 1,304 food diaries connected and processed using HITs on AMT [7].
For the semantic tagging of the user’s meal description, there is a first CRF that learns various features and their weights. These are used to calculate the probability of a sequence of tags, such as Other Other Quantity Food, given the sequence of words (e.g. I had two eggs). Some features indicate whether a word’s part-of-speech is a noun, since foods are often nouns, whereas brands and descriptions are often adjectives. Figure 3-2 shows an example of the results of the semantic tagging of “I
had a bowl of Kellogg’s frosted flakes,” where “a bowl” is identified as a Quantity, “Kellogg’s” is tagged as a Brand, “frosted” is tagged as a Description, and “flakes” are considered the Food.
Figure 3-2: Semantic tagging of a user’s input, identifying each word in the sentence as a Quantity, Brand, Description, Food, or Other [7].
3.2.2
Segmentation
In the second phase of the language understanding component, the system segments the user’s input by assigning attributes (Quantity, Brand, and Description) to the correct food items identified from the semantic tagging in the first phase.
There is a second CRF that associates foods with properties by taking the pre-dicted tags from the first CRF (e.g. Other Other Quantity Food) and predicting “food segments.” These food segments are represented with BIO labels. The label “B” indicates the Beginning of a segment. The label “O” refers to a word that is Out-side any segment, and the label “I” refers to being inOut-side a segment. Once we know where the segments are from this second CRF, we assign all the attributes (Brand, Quantity, and Description) to the foods inside each segment [7]. In Figure 3-3, the second CRF predicts two segments: “a bowl of cereal” and “two cups of milk.” It then associates the properties to the food item in each segment, understanding that “a bowl” is referencing “cereal” and “two cups” refers to “milk.”
For a complete example, if the user’s meal description is “I had a bowl of Kellogg’s frosted flakes,” the first CRF semantically tags the relevant words in the sentence as either a Quantity, Brand, Description, or Food, as shown in Figure 3-2. Then, the second CRF uses the predicted tags from the semantic tagging and predicts the food segment “bowl of Kellogg’s frosted flakes,” represented as “O O B I I I I I.” The label “O” refers to “I had,” indicating that these tokens, or words, are outside
Figure 3-3: Sentence segmentation of a user’s input into two food segments “a bowl of cereal” and “two cups of milk” [7].
Table 3.1: An example of the results of the CRF, which semantically tags each word in a user’s meal description and segments the sentence into food segments.
Token CRF Label Segment
I Other O had Other O a Quantity B bowl Quantity I of Other I Kellogg’s Brand I frosted Description I flakes Food I
of the food segment. The label “B” refers to “a,” indicating the beginning of the food segment “a bowl of Kellogg’s frosted flakes.” The label “I” refers to the words “bowl of Kellogg’s frosted flakes,” indicating that these tokens are inside the food segment. Table 3.1 shows an example of the output of the first and second CRF that tags and segments a user’s meal description. These two phases of the language understanding component, semantic tagging and segmentation, comprise the majority of the natural language processing that allows the system to understand the user’s meal description. This BIO labeling mechanism is not the best method, but it is the logic used in the nutrition system. In the next section, we discuss the system’s ability to perform context resolution and augment the user’s food diary when provided additional information.
3.2.3
Context Resolution
It is important for the system to associate attributes to the correct foods, particularly in the case when a user provides additional context to their previous meal description.
Figure 3-4: When the user first describes his meal of a glass of juice, the system does not know the exact type of juice unless the user provides additional context.
There may be times when either the user misspeaks or the language understanding misunderstands the user’s query. The user can also choose to provide additional detail to their previous meal description. For example, if the user says “I had a glass of juice,” shown in Figure 3-4, they may proceed to clarify the type of juice by saying “It was orange juice.”
Our system is designed to handle such queries. This algorithm is based on simple rules. For example, if the identified food in the follow-up utterance is the same as a previous food in the same session, the system updates the previous attributes to as the new attributes in the new utterance [13].
If the user refines their previous meal description, the system will not create an additional row, indicating another food item. Rather, it will recognize that the user most likely is referring to the same type of “juice,” and “Orange juice” is clarifying the previous query of “I had juice,” shown in the example in Figure 3-5. In the case of context resolution, the system highlights the changed cell in the food matrix. In the next section, we discuss the second main component of the system, the database lookup, where the system searches through our MySQL database of food items to retrieve the most relevant match and display the nutritional information to the user.
Figure 3-5: When the user provides additional information, the system is able to perform context resolution and update the food description in the USDA Hits column to reflect the user’s meal.
3.3
Database Lookup
The second part of this application was developed by connecting the food items people consume to entries in reputable nutrition databases, such as the U.S. Department of Agriculture Standard Reference (USDA) [2] and Nutritionix [1], and delivering this nutritional information to end users. In this section, we discuss the database lookup component of the nutrition system that automatically extracts food concepts from a MySQL database to retrieve the relevant nutrition information.
After the system retrieves the results from the language understanding component, it sends the data to the database lookup component. Here, it must determine which database hits match the user’s spoken food concepts, select the most similar hit for each food item, transform the user’s spoken quantity into the standard quantity used by the database, and obtain the nutrition facts [7].
The USDA Nutrient Database for Standard Reference returns a list of potential food item matches from the database. In the database lookup algorithm, the system makes a series of binary decisions that result in a short list of matches that the user selects from [13]. The more information the user provides, including a specific brand, then the less hits are likely to be selected. In this case, the system is able to display a USDA hit that is likely a close or identical match to the user’s intended food item.
Figure 3-6 describes the mechanism used to search for a specific food item in the USDA database. For each food item that is tagged with a corresponding description and brand, the system first checks the cache to see if the food item already exists. If it does not, then the system generates a SQL query that searches the USDA database for relevant matches. After this search is performed, the system creates and dis-plays a food log with exact nutritional information. In the next section, we discuss the previous system’s image search mechanism, where the system searches for the corresponding image to display in the user’s food log.
3.4
Image Search
In the previous system, the images of the food items from the USDA database are cached into the /scratch/images directory on the machine that the system is deployed on. The system uses the parsed, tagged words from the recognized text to search for the corresponding image filename in the file directory [13]. For example, if the user ate “strawberry chobani yogurt” for breakfast, the system semantically tags the text and searches for “strawberry%20chobani%20yogurt.png” in the images directory. If unsuccessful, it then searches for “chobani%20yogurt.png,” then “yogurt.png.” If unsuccessful again, the system searches for the image on the internet.
This method sometimes results in inaccurate images and sometimes fails to find the correct image, depending on the user’s food description. Though the image of “straw-berry chobani yogurt” does exist in the image cache, if the user happens to describe their yogurt as “chobani strawberry yogurt,” where the description is in a different
or-der, the system searches for an image with the name of “chobani%20strawberry%20yogurt.png” and concludes that this image does not exist in the cache, when in fact, the image
does exist. It is just saved under the name “strawberry%20chobani%20yogurt.png.” Instances such as these resulted in an unreliable image search process that we sought to improve in Chapter 4.3. In the next section, we discuss the user interface represen-tation of the components described earlier in this chapter: language understanding, database lookup, and image search.
Figure 3-6: A diagram of the system flow that shows how the system searches for the most relevant database match [13].
3.5
Previous User Interface
The user interface is an important part of the system, especially because it has been a primary reason for the abandonment of existing nutrition applications [14]. In this section, we describe the user input process and user interface of the initial prototype. We also introduce Spoke, a framework for building speech-enabled websites [18].
Figure 3-7: The system cannot find the image for“Chobani strawberry yogurt” be-cause it is searching for a different image name than the one it was initially created under. It does, however, exist in the image directory.
The interface of the previous system is configured with a single button in the shape of a microphone to initiate speech recording. The recognized words are dis-played on the web-page, where each word is semantically tagged with a property (e.g. Brand, Description, Quantity, and Food). Other members of the project continue to investigate the association of properties corresponding to food items through neural-network based approaches in order to improve upon the current CRF model described in Section 3.2 [7].
After a user records their meal description, a table matrix is then created whose rows correspond to individual food items, and whose columns correspond to the Brand, Quantity, and Description properties. Then, a web image result for each food item is also displayed. Finally, for each food, the top ten matching items re-turned from the nutrition database search are displayed. Figure 3-8 shows an example of the previous user interface of the nutrition system prototype.
The interface is a visual representation of the information that is stored and retrieved on the back-end. For example, it displays the associations of each food item in a simple matrix, such as the quantity, brand, and description. In the next chapter, we discuss its refinement in additional detail.
Figure 3-8: The previous user interface of the nutrition system prototype, displaying a food log of the user’s meal of “3 eggs over easy and a stack of pancakes.”
Figure 3-9: Previous work on the nutrition system includes Spoke’s Web Speech API, integrating visual feedback using Spoke’s volume meter. When the user clicks the microphone, the microphone turns red to indicate that it is recording.
3.5.1
Spoke
Spoke is a JavaScript framework for web based deployment of speech applications [18]. The previous nutrition system has a microphone icon that acts as a button for users to click to start and stop recording, and it is augmented with Spoke’s volume meter for visual feedback, shown in Figure 3-9. When the microphone icon is clicked, it changes from blue to red to indicate that it is recording. In Chaper 4.2, we discuss an additional application of Spoke, where we use its recording framework for collecting and storing utterances. In the section to follow, we provide the results of the system evaluation on the previous nutrition system.
3.6
Previous System Evaluation
An Amazon Mechanical Turk (AMT) task to evaluate the previous system’s overall performance and accuracy was launched. Turkers were asked to record two meals, then select whether the semantic tags, USDA hits, and quantities were correct. Upon completion of the task in its entirety, there were 437 meal descriptions that contained a total of 975 food concepts [7]. Turkers indicated that 83% of the semantic tags were correct, 78% of the quantities were correct, and 71% of the USDA HITs were correct matches. Figure 3-10 shows an example of a partially completed HIT, where a Turker is asked to select in the semantic tags, quantity, and USDA hits are correct for each food item, “oatmeal” and “banana.”
Figure 3-10: An AMT task for evaluating the accuracy of the previous system’s ability to match the USDA hit, tag the user’s meal description, and match the quantity [7].
3.7
Conclusion
In this chapter, we have presented the previous work of the nutrition system, in-cluding its overall flow, language understanding component, and database lookup. Additionally, we discussed the system’s previous user interface and the results of the system evaluation performed on the previous system.
Once the user records his meal description, a speech recognizer sends the language understanding component the recognized text, where tokenization, semantic tagging, and segmentation occur. These results are used to display the tagged results to the user.
Meanwhile, the same language understanding component occurs a second time during the database lookup, where the system uses the tagged food items to search in the MySQL database for relevant matches. Then, the system displays the USDA hits as a food diary with exact nutritional information, the quantity, and an image for each food item.
In the next chapter, we discuss the areas in which we refactored the previous system that led to the implementation of the current nutrition system. These mod-ifications include the separation of a central planner and our two servers (language understanding and database lookup), implementing the ability to save audio record-ings, and optimizing the image cache and lookup.
Chapter 4
Refactoring the System
The previous system was created to accomplish the task of interpreting a user’s spoken meal description and generating an accurate food diary. Upon further inspection of the system, we noticed many areas that called for improvement in refactoring, including the creation of a central planner and server architecture.
In the following sections, we describe the modifications made to the previous system that bring us to our current system today. These changes include separating the central planner and language understanding server, the ability to save audio, and a new mechanism for retrieving images and updating the image cache.
4.1
Central Planner/Server Architecture
This section discusses the changes to the previous system architecture, described in Chapter 3.1 that resulted in cleaner code and a more efficient system, specifically the separation of the system into a central planner, Language Understanding Server, and Database Lookup Server.
4.1.1
Separating the Central Planner and Servers
In the previous configuration, there was no distinction between the calls that were being made to the language understanding and database lookup components, meaning
the system followed a linear model that lacked any form of a central planner. We sought to separate the system into different components to modularize the system, and result in better software construction.
In the current system, we extracted the elements that comprise the language understanding component of the system and created a new http servlet that contains the natural language processing files. We named this Language Understanding server “Nutrition103-NLP” to distinguish it from the central planner, which we defined as “Nutrition100.” Nutrition100 refers to the smaller nutrition system created for a user study that accesses a subset of 100 food items, rather than the larger database of more than 10,000 items. This smaller system is discussed in more detail in Chapter 5. These extracted files in “Nutrition103-NLP” include the CRF model for semantic labeling, segmentation of the spoken meal descriptions, and the assignment of attributes to the correct food items.
The resulting architecture of the current system, shown in Figure 4-1, now allows us to independently work to improve the CRF model and explore other algorithms without affecting the database lookup or the display of the food diary itself. In the following section, we discuss the process of saving and storing audio recordings of a user’s meal descriptions. This allows us to evaluate the system’s performance and train a nutrition-specific speech recognizer to improve the system’s recognition.
Figure 4-2: A screenshot of the mappings of each deployed system to their respective tomcat server in uriworkermap.properties.
4.2
Saving Audio
In this section, we discuss a modification to the previous system, described in Chapter 3, and describe the process of saving the user’s meal recordings. The previous nu-trition system does not store audio recordings. However, this capability allows us to retroactively replicate a user’s recording to evaluate and identify flaws in the system. We can also use these recordings to train a nutrition-specific speech recognizer. Thus, we implemented a framework that would capture the user’s meal description in the form of a .wav file upon recording and save it to a specified directory. The sections to follow describe the process of saving audio, including using the Spoke framework to record and store audio to the server.
4.2.1
Using Spoke to Capture Audio
Spoke is a JavaScript framework for building interactive speech-enabled web appli-cations that integrates custom speech technologies into the website back-end. It has two components: the client-side framework and the server-side library. The client-side framework enables audio recording to the server for processing, speech recognition, and playing audio from the server. The side of Spoke provides a Node.js server-side library with a set of modules that interface with a handful of custom speech technologies, such as speech recognition [18].
the server. The Recorder is a module that hooks audio recording onto the microphone of the web page and records audio to the server. When it is toggled, the Recorder streams raw audio data to the server over socket.io. This audio sample is transformed to a 1024 byte buffer, which is then written directly to the socket stream.
4.2.2
Creating a Proxy Server
In the previous system, after the user records their meal description, a speech rec-ognizer sends the the recognized text to the language understanding component, but neither the text nor the audio are saved.
To address this issue, we created a proxy server to run on ursa.csail.mit.edu, another local workstation. Now, in the current system, when the Spoke browser is running, the Spoke client will connect to the Spoke server on ursa.csail.mit.edu, which acts as a proxy server on a local workstation. This is done to provide https encryption.
By integrating Spoke and running Node.js as a service through a proxy server, we are able store the audio files in a wav format and the recognized text in a specified directory on the local machine. The client-side usage of Spoke directs the socket.io to our proxy server, ursa.csail.mit.edu. For each socket.io connection or each time a user arrives at the landing page of the system, the server creates a new directory to store the subsequent recordings. Then, it handles an audio stream and its metadata by saving the transcoded wav file with the Spoke server-side Recorder, and save the recognized text from the metadata to a txt file. The filenames for these two files include the date and time of the recording and the unique utterance ID included in the metadata.
4.2.3
Storing the Recordings
In addition to integrating Spoke to save audio, we created a systematic process in the file system to store the recordings for the main purpose of training a speech recognizer from audio. In anticipation of user testing, these audio recordings are
saved according to the date and time recorded, where each year, month, and date is a different directory. This will be in the format of
/recordings/year/month/day/time sessionID/utterance ID.wav
The capability of storing the recordings of meal descriptions from users will mainly allow us to train a nutrition-specific speech recognizer. We can also retroactively recreate food diaries to debug and address the holes in the system. The following section discusses the optimization of the image cache implemented to change the system’s mechanism for searching for images to display in the user’s food diary.
4.3
Optimizing the Image Cache
To make the process of finding images faster and more robust, we refactored the image search mechanism to move away from keyword search on the image names and linked the image to its corresponding USDA food ID. In this section, we discuss the challenges of the previous implementation, the process of optimizing the image cache, and the changes made to improve the image search algorithm.
4.3.1
Challenges of the Previous Implementation
In the previous system, the image cache is populated with 4,791 images of food items, named after the corresponding food description, described in Chapter 3.4. The challenge to this previous implementation lies in the accuracy of these images. In the example provided, if the user simply says “I had chobani yogurt,” intending “strawberry chobani yogurt,” the system populates the food diary with the correct nutritional information of Chobani strawberry yogurt, but without an image nor the option of changing the image, shown in Figure 3-7. However, the user can select further adjectives to obtain the exact nutritional information for strawberry Chobani yogurt, but they must keep the incorrect image.
Furthermore, different users may call the same food item various names. An example of this is the food item, “fried chicken.” The USDA entry for a particu-lar type of fried chicken is “KFC, Fried Chicken, Original Recipe, Drumstick, meat
and skin with breading.” As shown in Figure 4-3, there are many variations of names that the actual image could be stored under, including “fried%20chicken.png,” “kfc%20chicken%20drumsticks.png,” etc, without interfering with other distinct USDA entries, such as “Popeyes, Fried Chicken, Milk, Drumstick, meat and skin with bread-ing.”
Figure 4-3: There are many entries in the USDA Standard Reference database for a keyword search of “fried chicken.”
By exploring the edge cases of the previous framework of retrieving images, we discovered glaring holes that would cause the system to fail to produce an image for the user, even if the image exists. For this reason, we changed the framework of loading images by linking the image name to the corresponding USDA entry in the MySQL database [13]. Specifically, we recreated the image cache, but instead renamed the image to its corresponding USDA food identification number (ie. “1001.png” for the food item “salted butter”). This way, when the system searches for the correct entry in the database, it will not only retrieve the exact food description and nutrition information, but it will also have access to the file path of the image. The next section discusses our exploration of different methods of populating the food diary with accurate images in a logical manner.
4.3.2
Linking Images to USDA Entries
Instead of relying on keyword search to retrieve images, we opt to link each image directly to a food ID, making the search process much more predictable. We explored
adding the file path of each image to the corresponding food entry in the MySQL database.
The system maintains a cache of the most relevant USDA, Freebase, and Nu-tritionix equivalents to food items [13]. Freebase is a crowd-sourced database that contains information about many topics, including 8,619 food item names, of which 916 food items contain data on their equivalent USDA database entry [13]. Addition-ally, Nutritionix is another nutritional database that contains nutrition information of thousands of food items [1]. In the MySQL database, there is a table called foodsWithNutrients that contains the name of each food item, freebase ID if applica-ble, the food ID, and the macro and micronutrients, such as calories, grams of protein, carbohydrates, etc. This is outlined in Table 4.3.2.
Field Description
NDB No 5 digit Nutrient Databank number Long Desc 200-character description of food item calories Calories per serving in the food item
protein Grams of protein per serving in the food item fat Grams of fat per serving in the food item
cholesterol Milligrams of cholesterol per serving in the food item sodium Milligrams of sodium per serving in the food item carbohydrates Grams of carbohydrates per serving in the food item fiber Grams of dietary fiber per serving in the food item sugar Grams of sugar per serving in the food item
Table 4.1: Outline of the foodWithNutrients database in MySQL.
Once the system identifies the specific food item from the database, it extracts the file path of the corresponding image and retrieves the image from the specified path. This allows for greater accuracy in the images populated and reduced error in the edge cases.
However, when looking into scaling this method to the 7,000 food items in the USDA database, we discovered that we needed an automated way of populating the image column of the table. For this reason, we looked into using previous Amazon Mechanical Turk tasks [13]. The following section describes the process of using
Amazon Mechanical Turk to recreate our image cache and restructure the way our system searches for images.
4.3.3
Amazon Mechanical Turk
In order to repopulate our image cache by linking each image to its corresponding USDA entry, we used Amazon Mechanical Turk to launch two distinct tasks to help scale this process to the 7,000 food items in the USDA database.
We implemented two AMT tasks to create the initial image cache [13]. For the current system, we launched an initial Human Intelligence Task (HIT), shown in Figure 4-4, that asked Turkers to find the URL of a relevant image for each of the food items. We included more specific instructions and a hidden entry to allow for the USDA food ID (ie. 1001). From this task, we asked for images of 6,441 food items from the USDA database and requested 3 hits per food item. This task resulted in a total of 19,323 images, which were processed in a format to feed into the second AMT task.
Figure 4-4: In the first AMT task, the instructions asks users to find the URL of a relevant image for four food items. It also provides examples of ideal images.
Figure 4-5: For each hit in the first AMT task, Turkers are given four distinct food descriptions from the USDA database and are asked to find the URL of the best image for each item. Here, the Turker was asked to provide an image for butter, coffee, McDonald’s hotcakes, and macaroni and cheese, and babyfood. We provided examples, indicating our standard for the most relevant image, to help them in the task.
In the second AMT task, for each food item, we asked users to evaluate the three images that previous Turkers had submitted from the first HIT and select the image that best represents that food item. This method increases the accuracy of each image and eliminates images misrepresenting the food item presented. Figure 4-6 shows an example of a typical HIT, where Turkers were asked to choose the best image given a food description.
From the results of the second task, we had a match for every food item, its ID number, and an image that Turkers deemed the correct image for each food descrip-tion. We then loaded the resulting 6,049 images onto the workstation to create an image cache, naming each image after its USDA identification number. With this recreation of the image cache, the system can more efficiently retrieve more accurate images based on the food’s USDA ID. In the next section, we describe the updated image search mechanism in the current framework in additional detail.
Figure 4-6: For the second AMT task, the user is given three images that previous Turkers from the first task had selected for the specific food item. In this case, Turkers were asked to select the image that best represents “cheese, cottage, creamed, with fruit.”
4.3.4
Image Search in the Current Framework
From the results of the two AMT tasks described above, we now have an updated image cache, with 10,704 images named after each food item’s corresponding USDA ID (e.g. “14023.png”). In the current system, we created an additional column in the foodsWithNutrients table in MySQL, shown in Table 4.3.2, that holds the relevant information for each food item.
First, we added the image name of the corresponding image for each food entry to the new “image” column, as seen in Figure 4-7. However, upon further inspection, we decided, instead, to populate the image column with the direct image path, rather than simply the image name, as shown in Figure 4-8. This mechanism does not rely on the image name to retrieve the image, and lends to scalability when the food items are not in the USDA database.
In the current framework of the nutrition system, the system searches the USDA database for a match on the parsed food description, provided by the language under-standing server. Unlike the previous system, it uses the food ID to access the image
Figure 4-7: A MySQL database table, foodsWithNutrients, stores all of the infor-mation for each food item in the USDA database. For the modified image search mechanism, we created an additional column that stores the image name for each image.
Figure 4-8: Rather than storing the image name in the additional column in foodsWithNutrients, for the modified image search mechanism, we store the direct image path (e.g. “/scratch/images/1101.png”).
path, such as “/scratch/images/1001.png.” Through access to the direct image path from the “image” column in foodsWithNutrients, the system creates a hashtable of food items and their image encodings to display the user’s food log on the landing page.
In instances where a food item is not in the USDA database, our system searches Nutritionix and Freebase, both nutritional databases. As a result, there may not be a USDA ID associated with the food item. In this case, the current system uses the previous system’s image search as a fallback mechanism and will still produce an image. In the future, however, we will populate the additional column in the MySql table of USDA entries with the image path of the food items without USDA ID’s, rather than just limiting the images to USDA food items. This allows for a greater range of food items outside the USDA database, where the image name is irrelevant, but the image path directs the system to the corresponding image.
Figure 4-9 describes the current framework of the system, including the previous mechanism for retrieving images. This figure demonstrates that the current frame-work we implemented is more efficient, streamlined, and does not depend on the user’s food description to search for the corresponding image. In sections to follow, we dis-cuss the user interface of the current system and conclude with a general overview of the nutrition system as it stands today.
4.4
Current User Interface
In the user interface of the current system, we reduce the information displayed to the user and allow the option of updating the quantity of each food item. We also condense the USDA hits to a single description.
Instead of displaying all possible database hits, we limit the number of database hits to 4 entries. Although this does not speed up the database lookup, it is less overwhelming for the user. Figure 1-1 displays the user interface of the current system after these modifications that allowed for more efficient use of the the landing page and a more learnable interface.
Figure 4-9: In the current framework, the images are retrieved as soon as a USDA entry is matched to the user’s meal description.
Furthermore, if the database hit that the system displays is not the correct food item, the user has the option to “See more options.” They can select from a list of database hits that are similar to the food items tagged in the user’s meal description, as shown in Figure 4-10, where the user is given the option to select from a list of “tomatoes.” This provides additional accuracy in the nutrition information displayed for the user.
This application focuses on self-assessment of energy and macronutrient intake. Our system is a Java-based application that runs on Google Chrome, but in the future, the system will run on Android phones. In the next section, we conclude with an overview of the current system that encompasses all of the modifications described earlier in this chapter.
Figure 4-10: The user has the option to further define their meal description of “tomatoes” and select adjectives such as “crushed,” “green,” and “red.”
4.5
Overview of the Current System
The entire architecture of the current system is shown in the diagram in Figure 4-1. Once the user records his meal, the recording is sent to a speech recognizer, where the recording is transformed from a .wav file to recognized text. This recognized text is then sent to the central planner, which contains the content and formatting of the data. The central planner sends the recognized text to the Language Understanding server, where tokenization, semantic tagging, and segmentation occur to understand the user’s query.
Once the central planner receives the search results, it searches in the MySQL database server of USDA food items for matches to the user’s query. With the exact nutritional information and corresponding images, the central planner is then able to display the food log for the user, which is shown in Figure 1-1.
4.6
Conclusion
In this chapter, we have presented modifications made to the previous system de-scribed in Chapter 3, such as the separation of the central planner and two servers,
the ability to save audio, and a new mechanism to retrieve images. These modifica-tions have been implemented as features of the current system.
Separating the central planner and the language understanding servers allows for cleaner software construction that is easier for future researchers to follow. This way, we can work to improve the language understanding algorithms without affecting the results of the nutrition system itself. As long as we are passing the results of the speech analysis to the central planner, the system is able to search the database for a matching food item.
The ability to save and store audio provides the capability to review users’ spoken meal descriptions, evaluate the system, and provide additional modifications. This will improve the accuracy and allow us to recreate scenarios from actual events.
We also created a new mechanism to update the image cache and retrieve images, even though the user may not notice an obvious change in the way images are now retrieved. This mechanism of accessing the image through the USDA identification number is much more accurate than searching through the file directory for an image whose name matches the food item described by the user.
Lastly, we discussed the updated user interface, where we limited the information we presented to the end user and added the ability to change the quantity and USDA hit.
In the next chapter, we discuss the user study performed for nutritionists at Tufts University. Here, we created a nutrition system that only accesses 100 specific food items extracted from the USDA database. We also present the results of the Amazon Mechanical Turk task that we launched to assess the performance of the system.
Chapter 5
System Evaluation
One of the specific aims of this thesis is to conduct a pilot study to assess the ability of the new program to reliably capture and code information on amounts and types of consumed foods. Through our partnership with nutritionists at Tufts University, we created a separate system, called Nutrition100, that selects from a smaller subset of 100 food items. We used this smaller system to launch an Amazon Mechanical Turk (AMT) task asking Turkers to evaluate the system’s performance on three separate components: quantity, USDA, and image matching.
5.1
Extracting a Subset of Foods
There are currently over 10,500 food entries in our database, 6,500 from USDA [2] and roughly 4,000 entries from the Nutritionix database [1]. When testing for accuracy, however, it is difficult to manually evaluate user choices with so many food items. Thus, part of this work includes extracting a subset of 100 food items from the USDA database specifically to perform user studies and evaluate the accuracy of our system. These 100 food items were manually selected a user study. A list of the food items is provided in Appendix A.1.
All of the food IDs were compiled into a list, and we used MySQL to query the entries in the foodsWithNutrients table, outlined in Table 4.3.2, and placed this subset in a new table. In the system code itself, rather than querying from the larger
database of food items, the smaller system queries from this subset of 100 food items. This will allow us to verify the deficiencies in the logic more easily given a smaller subset of foods to choose from. In the sections to follow, we describe the user study performed on Amazon Mechanical Turk. We conclude the section with an evaluation of the results from the AMT task.
5.2
User Study
The user study will be the next step in the development of the nutrition applica-tion. Results gathered from the user study will lead to continued development of the accuracy of the system. In the next section we describe our system evaluation on Mechanical Turk and analyze the results of the performance of the system.
5.2.1
Amazon Mechanical Turk
The performance of the system, which we named “Nutrition Eval,” was assessed using Amazon Mechanical Turk (AMT), a crowdsourcing marketplace for users, referred to as “Turkers,” to complete various Human Intelligence Tasks (HITs). These HITs were designed by [13] and [11] to evaluate the system on three main components: the language tagging, database matching, and image retrieval. As shown in Figure 5-1, in each HIT, Turkers were asked to record at least two meal descriptions from a list of the 100 food items provided. We recommended that Turkers interact with the system by altering the quantities and narrowing down to one USDA hit if necessary. After the Turkers successfully recorded two meals, we asked them to evaluate the system by answering three yes or no questions and optionally providing feedback for improvements. Upon completion of each HIT, Turkers were paid $0.20.
For each of their meal descriptions, the system displayed a tagged result of the user’s query and a table of food items with exact nutritional information. Turkers were then asked to assess the accuracy of the system, specifically whether each part was correct. For each tagged food item, Turkers were asked to if the quantity, USDA hit, and image were correct. By asking them these targeted questions, we are able
Figure 5-1: This figure shows the instructions for the AMT HIT launched to test the accuracy and performance of the nutrition system.
to identify specific holes regarding the main components of our nutrition system. An example of a partially completed HIT is shown in Figure 5-2.
In the next section, we discuss and evaluate the results of the system based on the responses from Turkers.
5.3
System Evaluation
From the results of the AMT HIT described above, we collected meal descriptions from 512 Turkers. These Turkers were based in the United States and had an overall approval rating that was greater than 80%. This ensures that the Turkers are able to read the instructions and have a history of submitting HITs that meet a Requester’s standards.
From the 512 Turkers who participated in the HIT, we collected 743 meal descrip-tions containing a total of 1548 food concepts (or items). For each food item, Turkers were asked if the corresponding quantity, USDA hit, and image were correct. The
Figure 5-2: This figure shows an example of the results of a user’s meal description while performing the AMT task to evaluate the system’s performance.
Previous System Current System Change Correct Quantity 78.0% 85.9% +7.9%
Correct USDA Hits 71.0% 87.6% +16.6%
Correct Images N/A 88.1% N/A Table 5.1: Comparison of the accuracy of the quantity, selected USDA hit, and image between the results of the previous system and the results of the current system.
results of this task indicated that 85.9% of the quantities were correct, 87.6% of the USDA hits were correct, and 88.1% of the images were correct.
From the results of the system evaluation on the previous system, described in Chapter 3.6, the results of the AMT task testing the performance of the current sys-tem show an improvement in both the percentage of correct USDA hits and estimated quantities [7]. The system evaluation of the previous nutrition system did not test the accuracy of the images, so we do not have previous data for comparison.
Table 5.1 compares the results from the previous system’s evaluation and the cur-rent system’s evaluation based off of the AMT HIT, indicating that the percentage of correct quantities increased by 7.9%, and the percentage of correct USDA hits in-creased by 16.6%. This shows a distinct improvement from the results of the previous system to that of the current system. It is important to note that the previous system searches the larger database of 7,000 food items, whereas the current system, specif-ically the smaller nutrition system designed for the Tufts user study, uses a database of 100 food items.
It is interesting to note, however, the accuracy of the system in retrieving the correct images. The results from the 1548 food items generated by the 512 Turkers indicate that 88.1% of the images were accurate. As explained in Chapter 3.4, the previous system searches for images based on a keyword lookup. The image search of the current system, described in Chapter 4.3, links the image of each food item to its USDA ID and uses the filepath of the image to retrieve the corresponding image. Because of this, the accuracy of the image matching should directly correspond to the accuracy of USDA matching. Based on the results, we see that the accuracies are similar, with only a 0.05% difference.


![Figure 3-2: Semantic tagging of a user’s input, identifying each word in the sentence as a Quantity, Brand, Description, Food, or Other [7].](https://thumb-eu.123doks.com/thumbv2/123doknet/14452254.518833/30.918.249.670.220.282/figure-semantic-tagging-identifying-sentence-quantity-brand-description.webp)
![Figure 3-3: Sentence segmentation of a user’s input into two food segments “a bowl of cereal” and “two cups of milk” [7].](https://thumb-eu.123doks.com/thumbv2/123doknet/14452254.518833/31.918.249.677.105.203/figure-sentence-segmentation-user-input-food-segments-cereal.webp)


![Figure 3-6: A diagram of the system flow that shows how the system searches for the most relevant database match [13].](https://thumb-eu.123doks.com/thumbv2/123doknet/14452254.518833/35.918.149.773.105.797/figure-diagram-flow-shows-searches-relevant-database-match.webp)
