HAL Id: hal-02618506
https://hal.inrae.fr/hal-02618506
Submitted on 25 May 2020
HAL is a multi-disciplinary open access
archive for the deposit and dissemination of
sci-entific research documents, whether they are
pub-lished or not. The documents may come from
teaching and research institutions in France or
abroad, or from public or private research centers.
L’archive ouverte pluridisciplinaire HAL, est
destinée au dépôt et à la diffusion de documents
scientifiques de niveau recherche, publiés ou non,
émanant des établissements d’enseignement et de
recherche français ou étrangers, des laboratoires
publics ou privés.
Distributed under a Creative Commons Attribution| 4.0 International License
genes by promoting 3’ Pol II pausing in plants
Xuhong Yu, Pascal G.P. Martin, Scott D. Michaels
To cite this version:
Xuhong Yu, Pascal G.P. Martin, Scott D. Michaels. BORDER proteins protect expression of
neigh-boring genes by promoting 3’ Pol II pausing in plants. Nature Communications, Nature Publishing
Group, 2019, 10 (1), 15 p. �10.1038/s41467-019-12328-w�. �hal-02618506�
BORDER proteins protect expression of
neighboring genes by promoting 3
′ Pol II
pausing in plants
Xuhong Yu
1,3
, Pascal G.P. Martin
1,2,3
& Scott D. Michaels
1
Ensuring that one gene’s transcription does not inappropriately affect the expression of
its neighbors is a fundamental challenge to gene regulation in a genomic context. In
plants, which lack homologs of animal insulator proteins, the mechanisms that prevent
transcriptional interference are not well understood. Here we show that BORDER proteins are
enriched in intergenic regions and prevent interference between closely spaced genes on the
same strand by promoting the 3
′ pausing of RNA polymerase II at the upstream gene. In the
absence of BORDER proteins, 3
′ pausing associated with the upstream gene is reduced and
shifts into the promoter region of the downstream gene. This is consistent with a model in
which BORDER proteins inhibit transcriptional interference by preventing RNA polymerase
from intruding into the promoters of downstream genes.
https://doi.org/10.1038/s41467-019-12328-w
OPEN
1Department of Biology, Indiana University, 915 East Third Street, Bloomington, IN 47405, USA.2Toxalim (Research Centre in Food Toxicology), Université de Toulouse, INRA, ENVT, INP-Purpan, UPS, 31027 Toulouse, France.3These authors contributed equally: Xuhong Yu, Pascal G. P. Martin. Correspondence
and requests for materials should be addressed to S.D.M. (email:michaels@indiana.edu)
123456789
T
ranscription of a gene does not occur in isolation but
within the context of its genomic environment. The
transcription of one gene has the potential to influence or
interfere with that of its neighbors. Transcriptional interference
(TI) can take many forms but is broadly defined as the direct
negative impact of one gene’s transcription on a second gene
that is located in cis
1. For example, if two genes are oriented in
tandem on the same DNA strand, it is possible for the
elon-gating RNA Polymerase II (Pol II) from the upstream gene to
intrude into the promoter region of the downstream gene. This
“promoter intrusion” has the potential to interfere with the
binding of transcription factors, assembly of the preinitiation
complex, and/or the positioning of nucleosomes at the promoter
of the downstream gene
2–5. The potential for this type of
TI may increase in genomes with higher gene density;
shorter distances between genes would require more precise
termination of upstream genes. Thus controlling elongation and
termination at upstream genes may be key in preventing TI at
downstream genes.
Accumulating evidence suggests important regulatory roles for
Pol II pausing
6–8in shaping the transcriptome. An example of
Pol II pausing seen in metazoans is the accumulation of
scriptionally engaged Pol II 30–50 bp downstream of the
tran-scription start site (TSS)
7. This promoter-proximal pausing is
often seen at developmentally regulated genes, where it may
facilitate their rapid activation, and is mediated by the DRB
Sensitivity-Inducing Factor (DSIF) and the Negative Elongation
Factor (NELF) complexes
9. Mapping of engaged Pol II in
Arabidopsis thaliana and maize, in contrast, did not reveal
pat-terns of Pol II accumulation in regions immediately downstream
of TSSs
10,11. Thus plants, which lack NELF homologs, do not
appear to make significant use of promoter-proximal pausing. In
a phenomenon known as 3′ Pol II pausing, however, a significant
increase in Pol II is observed near the transcript end site (TES) of
many genes
11. The molecular mechanisms that give rise to 3′ Pol
II pausing in plants, as well as its biological significance, are
unclear.
To better understand the role of 3′ pausing, we investigated a
three-member family of putative negative transcription
elonga-tion factors from Arabidopsis, which we have named BORDER
(BDR1, BDR2, and BDR3) proteins. BDR proteins are enriched in
intergenic regions and promote the 3′ pausing of Pol II for a large
fraction of genes. This activity is especially important at closely
spaced genes on the same strand (i.e., in tandem). In the bdr1,2,3
mutant, 3′ pausing is reduced at upstream genes and Pol II
occupancy shifts into the promoter regions of the downstream
genes. While expression of the upstream gene is unaffected in the
bdr1,2,3 mutant, the shift in Pol II from the upstream gene into
the promoter region of the downstream gene is coincident with
reduced expression of the downstream gene. In this way, BDR
proteins prevent TI between closely spaced tandem genes.
Results
BDR proteins resemble transcriptional elongation factors. BDR
proteins form a three-member family in Arabidopsis (BDR1
=
At5g25520, BDR2
= At5g11430, BDR3 = At2g25640). Each BDR
protein contains an SPOC domain, which is found in the SPEN
family of transcriptional repressors, and a transcription
elonga-tion factor IIS (TFIIS) central domain (Fig.
1
a, Supplementary
Fig. 1)
12,13. TFIIS contains three domains (I, II/central, and III)
and acts as a positive elongation factor. During elongation, RNA
Pol II frequently backtracks, such that it is no longer positioned at
the 3′ end of the growing transcript. To restart elongation, the
central domain of TFIIS binds to RNA Pol II, while domain III
stimulates cleavage of the nascent transcript, thus providing a
new 3′ end for RNA Pol II
12,14–16. The fact that BDR proteins do
not contain domain I or III suggests that the BDR proteins are
unlikely to have TFIIS-like activity.
Proteins with similar domain organization are found outside
plants, with fungal and animal proteins often including an
additional N-terminal PHD domain
17–19(Fig.
1
a). These include
the mammalian proteins SPOCD1, PHF3, and DIDO1
17,20,21.
The best characterized is the yeast protein BYpass of Ess1 (Bye1),
which contains a PHD domain in addition to its SPOC and TFIIS
central domains. Bye1 is thought to act as a negative elongation
factor and binds to Pol II through its TFIIS central domain and to
histone H3 trimethylated on lysine 4 (H3K4me3) through its
PHD domain
17,22. Bye1 is enriched in the 5′ regions of genes
17,23,
and consistent with a role in repressing Pol II elongation, Pol II
occupancy in the 5′ regions of genes is reduced in the bye1
mutant, whereas Pol II occupancy is increased in gene bodies
22.
To investigate the function of BDR proteins in Arabidopsis, we
obtained T-DNA insertional mutants in BDR1 (bdr1-1), BDR2,
(bdr2-1), and BDR3 (bdr3-1). Single mutants did not show clear
phenotypes; however, the bdr1,2,3 triple mutant showed a
short-root phenotype (Fig.
1
b, c). Given the similarity between the BDR
proteins and negative elongation factors
17,22, we speculated that
the mutant phenotypes might be caused by increased
transcrip-tional elongation. If this is the case, inhibiting elongation might
attenuate the phenotype of the bdr1,2,3 triple mutant. To test this
hypothesis, we grew seedlings in the presence of a chemical
inhibitor of transcription elongation, 6-Azauracil (6AU)
24and
examined root growth. In contrast to wild type, which showed a
reduction in root growth when grown on 6AU, root length was
partially rescued in bdr1,2,3 mutant seedlings (Fig.
1
b and
Supplementary Data 1). We also tested a second chemical
inhibitor
of
transcription
elongation,
mycophenolic
acid
(MPA)
24. Similar to the results with 6AU, MPA had a slight
negative effect on root growth in wild type (Fig.
1
c and
Supplementary Data 1); however, bdr1,2,3 root length more than
doubled when grown on MPA. These results suggest that the
short-root phenotype may be due to increased transcriptional
elongation in the bdr1,2,3 background.
BDR proteins are enriched at gene borders. We performed
chromatin immunoprecipitation followed by next-generation
sequencing (ChIP-seq) to determine the localization of BDR1,
BDR2, and BDR3 using MYC-tagged constructs driven by their
respective endogenous promoters in the bdr1,2,3 background. All
three constructs rescued the short-root phenotype of bdr1,2,3
(Supplementary Fig. 2A). ChIP-seq showed that BDR1 and BDR2
are mainly enriched at gene borders, with peak summits located a
short distance upstream of TSSs and/or downstream of TESs
(Fig.
2
a, b). Because intergenic distances in Arabidopsis are
relatively short (e.g., Fig.
2
a), it is often not possible to
unam-biguously assign an intergenic peak to one of the two neighboring
genes, but BDR peaks are nevertheless found between both
converging and diverging gene pairs (Fig.
2
a). In contrast to
BDR1 and BDR2, which show roughly similar binding in TSS and
TES regions, BDR3 showed a strong preference for TES binding
(Fig.
2
b). Among the three BDR proteins, BDR1 showed the
highest ChIP-seq enrichment and BDR3 showed the lowest
(Fig.
2
b, note different y axis scales).
We defined 21,334, 11,997, and 12,178 peaks for BRD1, BDR2,
and BDR3, respectively. Consistent with their greater amino acid
sequence similarity (Supplementary Fig. 1), we found the greatest
overlap in peaks between BDR1 and BDR2. Approximately 82%
of BDR2 peaks overlapped with BDR1 peaks, whereas only 22%
of BDR3 peaks overlapped with BDR1 (Fig.
2
c). For all three BDR
proteins, occupancy is correlated with the expression of the
nearest gene (Fig.
2
b). BDR1 and BDR2 peaks were enriched in
the intergenic regions, such as promoters and regions
immedi-ately downstream of the TES, as well as 5′ untranslated regions
(5′ UTRs; Fig.
2
d). BDR3, in contrast, did not show enrichment
in promoters or 5′ UTRs but was enriched in exons, 3′ UTRs, and
regions immediately downstream of the TES. Because binding of
BDR proteins is strongest near the TSS and/or TES, we examined
occupancy in these regions in more detail. For each BDR protein,
we identified sets of genes containing peaks within 300 bp of the
TSS or TES and plotted the occupancy of the corresponding BDR
protein (e.g., occupancy of BDR1 over TSS regions containing
BDR1 peaks, occupancy of BDR2 over TSS regions containing
BDR2 peaks, etc). In the TSS region, all three BDR proteins
showed maximum occupancy slightly upstream of the TSS
(Fig.
2
e), with maxima of
−87, −31, and −148 bp for BRD1,
BDR2, and BDR3, respectively. BDR proteins showed less
variation in binding position at the TES, with maxima of 106,
131, and 117 bp downstream of the TES for BRD1, BDR2, and
BDR3, respectively. (Fig.
2
f). BDR1 and BDR2 showed strong
overlap in peaks at both the TSS and TES, whereas BDR3 showed
stronger overlap with BDR1 and BDR2 at the TES than at the TSS
(Fig.
2
e, f).
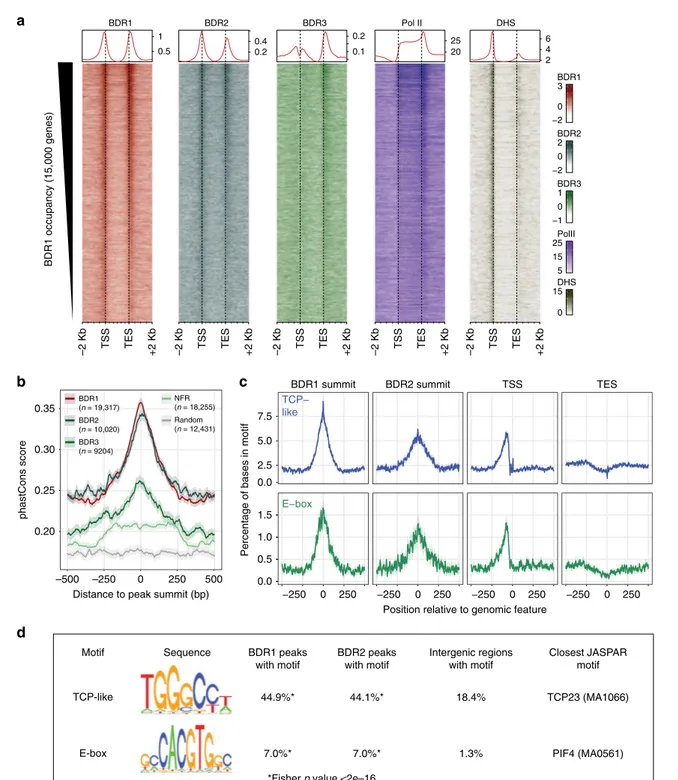
BDR1 peaks are located in nucleosome-depleted,
DNase-hypersensitive regions (Fig.
3
a and Supplementary Fig. 3).
Although less pronounced than for BDR1, regions with the
highest occupancy for BDR2 and BDR3 also showed a preference
for nucleosome-depleted regions (Supplementary
Fig.
3).
Consistent with the correlation with gene expression (Fig.
2
b),
we found that the occupancy of all three BDR proteins also
correlates with Pol II levels (Fig.
3
a and Supplementary Fig. 3).
Because BDR1, BDR2, and BDR3 show differences in binding in
TSS and TES regions (Fig.
2
b), we also examined the correlations
between BDR proteins, Pol II, H3, and DNase-hypersensitive
regions specifically at 250 bp regions immediately before the TSS,
after the TSS, before the TES, and after the TES (Supplementary
Fig. 4). These data show that some correlations are stronger in
particular regions. For example, the correlation between BDR3,
which shows relatively little binding near the TSS, with BDR1,
BDR2, and Pol II is higher near the TES (Supplementary Fig. 4).
We also examined sequence conservation around BDR peaks.
PhastCons
25examines sequence conservation between
Arabidop-sis and the genomes of 20 other angiosperms. In order to focus on
the conservation of intergenic regions, sequences corresponding
to annotated genes were removed. Because BDR peaks are
preferentially found in nucleosome-depleted regions, we included
other nucleosome-free regions, as well as random intergenic
sequences, as controls. We found that sequence conservation was
significantly higher at BDR peaks compared to surrounding
intergenic sequences (Fig.
3
b), with higher conservation observed
for BDR1 and BDR2 peaks than for BDR3 peaks. We also
searched for overrepresented motifs in BDR1 and BDR2 peaks,
focusing on the 101 bp surrounding the peak center. Two motifs
were identified that occurred more frequently in BDR1 and BDR2
peaks than in other intergenic regions (Fig.
3
c, d). A TCP-like
100aa SPOC TFIIS BDR2 BDR1 BDR3 PHF3 SPOCD1 Bye1 DIDO1
a
0 5 10 0 1 6AU (μM) Root length (cm) Root length (cm) 0 2 4 6 8 0 0.125 MPA (μM) WT bdr1,2,3 WT bdr1,2,3 WT bdr1,2,3 WT bdr1,2,3 Control Control 1 μM 6AU 0.125 μM MPAb
c
* * * * A. thaliana S. cerevisiae H. sapiens PHDFig. 1 Reduced root growth in the bdr1,2,3 mutant is partially restored by inhibitors of transcriptional elongation. a Schematic drawing of BDR proteins and related proteins from humans and yeast.b, c The short-root phenotype of bdr1,2,3 is partially rescued by the transcription elongation inhibitors 6AU (b) and MPA (c). Wild type and bdr1,2,3 are represented by black and blue bars, respectively (n = 12 biologically independent seedlings). Error bars indicate one standard deviation. Asterisks indicate significant differences (p < 0.05)
motif was found in 44.9% of BDR1 peaks and an E-box motif was
found in 7.02%
26. Both motifs were also enriched in BDR2 peaks
(Fig.
3
d). Interestingly, although BDR1 and BDR2 are enriched
near both TSS and TES regions (Fig.
2
b, e, f), these motifs only
show enrichment near TSS sites (Fig.
3
c). Because BDR proteins
lack characterized DNA-binding motifs, it is likely that
recruit-ment to chromatin depends on interactions with other factors.
The result that enriched sequence motifs are found near the TSS,
but not near the TES suggests that BDR proteins may be recruited
to chromatin through multiple interactions/mechanisms, e.g.,
* 0 100 BDR1 0 50 BDR2 0 50 BDR3 −2 0 2 4 RNA 0 150 Pol II
a
b
c
e
f
d
AT5G11670 AT5G11700 AT5G11710 AT5G11720 AT5G11680 AT5G11690 AT5G11730–2 Kb –1 Kb TSS 50% TES +1 Kb +2 Kb –2 Kb –1 Kb TSS 50% TES +1 Kb +2 Kb –2 Kb –1 Kb TSS 50% TES +1 Kb +2 Kb Genomic coordinate 0.0 0.1 0.2 0.3 0.0 0.2 0.4 0.6 0.0 0.5 1.0 1.5
BDR1::MYC occupancy BDR2::MYC occupancy BDR3::MYC occupancy
log2(BDR ChIP/WT control)
mRNA level (FPKM) * * * * * * * * 0 10 20 30 40 Percentage (%) BDR1 BDR2 BDR3 Genome BDR1 BDR2 BDR3 9313 1858 114 11191 977 7455 1653 Promoters 5′
UTRs Exons Introns 3′ UTRs Immediate downstream Intergenic Genomic region 0.0 0.0 0.5 1.0 −1000 TSS 1000 −1000 TES 1000 Position relative to TSS (bp)
log2(BDR ChIP/WT control) log2(BDR ChIP/WT control) 0.5 1.0 1.5
Position relative to TES (bp)
BDR1 (n = 10908) BDR2 (n = 6838) BDR3 (n = 1533) BDR1 (n = 9717) BDR2 (n = 4684) BDR3 (n = 3918) BDR1 BDR2 BDR3 1685 532 63 4726 902 2821 1268 BDR1 BDR2 BDR3 119325 1220 5208 107 5385 208 2 kb BDR peaks
Fig. 2 Genome-wide localization of BDR proteins. a Browser track showing intergenic enrichment of BDR1, BDR2, BDR3, and Pol II. b Metagene profiles of BDR1::MYC, BDR2::MYC, and BDR3::MYC ChIP-seq signal in nine groups of genes defined by increasing mRNA expression levels in wild type. The average BDR ChIP-seq signal for each group (line) and the associated 95% confidence interval based on a Gaussian assumption (shade) are represented. Signal in gene bodies was averaged in bins of 1% of the gene size. FPKM fragments per kilobase per million aligned fragments.c Venn diagram showing the overlap between BDR1, BDR2, and BDR3 peaks.d Distribution of BDR ChIP-seq peaks in various classes of genomic features. Promoter regions and immediate downstream regions are defined as up to 300 bp upstream from the TSS or downstream of the TES, respectively. Intergenic regions are >300 bp from any gene. Asterisks indicate a significant enrichment compared to genome-wide distributions (p < 0.002). e, f Coverage of ChIP-seq signal for BDR1, BDR2, and BDR3 around the TSS (e) and TES (f). For each protein, genes were selected that contained peak summits <300 bp from their TSS (e) or TES (f). Venn diagrams illustrate the overlap between genes with BDR1, BDR2, and BDR3 peaks at their TSS (e) or TES (f)
b
a
d
c
–500 –250 phastCons score 0.20 0.25 0.30 0.35 0 250 500 Distance to peak summit (bp)BDR1 summit BDR2 summit TSS TES
TCP− like −250 0 250 −250 0 250 −250 0 250 −250 0 250 0.0 E−box 0.0 0.5 1.0 1.5 2.5 5.0 7.5
Position relative to genomic feature
Percentage of bases in motif
Motif Sequence BDR2 peaks with motif Intergenic regions with motif Closest JASPAR motif TCP-like E-box 44.1%* 7.0%* BDR1 peaks with motif 44.9%* 7.0%* 18.4% 1.3% TCP23 (MA1066) PIF4 (MA0561) BDR1 (n = 19,317) BDR2 (n = 10,020) BDR3 (n = 9204) Random (n = 12,431) NFR (n = 18,255) 0.5 1 0.2 0.4 0.1 0.2 20 25 2 4 6
–2 Kb TSS TES +2 Kb –2 Kb TSS TES +2 Kb –2 Kb TSS TES +2 Kb –2 Kb TSS TES +2 Kb –2 Kb TSS TES +2 Kb
BDR1 BDR2 BDR3 Pol II DHS BDR1 −2 0 3 BDR2 −2 0 2 BDR3 −1 0 1 PolII 5 15 25 DHS 0 15 BDR1 occupancy (15,000 genes)
*Fisher p value <2e–16
Fig. 3 BDR peaks contain evolutionarily conserved TCP-like and E-box motifs. a Heatmap and metagene profiles (top) of ChIP-seq signals and DNAse-hypersensitive sites (DHS). Genes were sorted by total BDR1 signal around the TSS and TES; the top 15,000 genes are shown.b Sequence conservation across 20 angiosperms for intergenic regions around BDR1, BDR2, and BDR3 peak summits, nucleosome-free regions (NFR), or random regions. Average phastCons score (line) and 95% confidence intervals (shade) are shown. c Enrichment of TCP-like and E-box motifs in BDR1 and BDR2 summits, TSS, and TES regions.d Motifs identified in BDR1 and BDR2 summits
interacting with DNA-binding proteins that recognize TCP-like
and/or E-box motifs near the TSS, and other proteins, such as
components of the transcription termination machinery, near the
TES. The model that BDR proteins may be recruited to TSS and
TES regions through separate mechanisms is also supported by
asymmetric binding profile of BDR3, which shows much stronger
affinity for TES regions than for TSS sites (Fig.
2
b).
BDR proteins promote 3′ Pol II pausing. The potential role of
BDR proteins as negative transcription elongation factors and
their enrichment near the 3′ ends of genes suggests that they may
play a role in 3′ pausing. We determined Pol II occupancy in wild
type and bdr1,2,3 using antibodies recognizing Pol II, Serine 5
phosphorylated Pol II (S5P), and Pol II S2P. During transcription,
Pol II undergoes a series of phosphorylation events, with Pol II
S5P associated with initiation and Pol II S2P associated with
elongation
27. Consistent with this model, we observed that Pol II
S2P signal increased through the body of the gene (Fig.
4
a). S5P
occupancy increased not only through the body of the gene but
also showed a peak near the TSS and a depletion near the TES
(Fig.
4
a). Consistent with published ChIP-seq, GRO-seq, and
pNET-seq studies
10,11,28, all three antibodies showed 3′ Pol II
accumulation just after the TES (Fig.
4
a, red arrows), indicative of
3′ pausing.
We used ChIP-seq data from wild type and bdr1,2,3 to
calculate a 3′ pausing index for Pol II (ratio of read densities from
the region immediately downstream of the TES to those of the
gene body, Fig.
4
b). We
first examined the relationship between 3′
pausing and gene expression. In wild type, the level of 3′ pausing
was correlated with gene expression, with the most highly
expressed genes having the highest levels of 3′ pausing (Fig.
4
c).
In bdr1,2,3, 3′ pausing was significantly reduced for nearly all
combinations of antibody and gene expression group (Fig.
4
c).
Thus BDR proteins do indeed promote 3′ pausing for a large
fraction of genes.
BDR-protected genes occur in a specific genomic context. We
used RNA-seq analysis to identify three sets of genes whose
expression is promoted or repressed by BDR proteins (i.e., show
decreased or increased expression in bdr1,2,3 seedlings,
respec-tively), as well as non-differentially expressed genes
(Supple-mentary Fig. 5A). Interestingly, we found that BDR-promoted
genes, which we will refer to as BDR-protected genes,
pre-ferentially occur in a specific genomic context (Fig.
5
a and
–2 Kb TSS TES +2 Kb 20 30 14 18 22 14 16 18 Genomic coordinate Coverage (FP10M)
c
b
a
Pol II S5P S2P Gene TSS TES TES+ 250 bp TSS+ 250 bp TSS+ 1 KbGene body region TES region 3′ pausing index =
Gene body read density TES read density
grp1 grp2 grp3 grp4 grp5 grp6 grp7 grp8 grp9 −2 −1 0 1 2 −2 −1 0 1 2 −2 −1 0 1 2 Genotype WT bdr1,2,3 3′
Pol II pausing index (log2)
Gene expression level (RPKM)
Pol II
Pol II S5P
P
ol II S2P
5e–20 3e–32 1e–62 7e–1
1
2
7e–208 3e–245 1e–217 3e–238 1e–261
0.03 0.8 0.05
2e–19 8e–64
3e–101 5e–107 7e–124 9e–150
1e–5 5e–7
1e–13 5e–19 3e–53 4e–68 3e–66 4e–87
1e–108
Fig. 4 BDR proteins promote 3′ pausing and gene expression in a specific genomic context. a Pol II ChIP-seq coverage across expressed genes in Arabidopsis seedlings. 3′ pausing indicated by red arrows. b Calculation of a 3′ pausing index. c 3′ pausing indices for nine groups of genes defined by increasing mRNA expression levels in wild type. 3′ pausing is reduced in the bdr1,2,3 mutant, particularly at highly expressed genes. The centerline of boxplots is the median. The bounds of the box are thefirst and third quartiles (Q1 and Q3). Whiskers represent data range but are bounded to 1.5-fold the interquartile range (Q3–Q1); points outside this range are represented individually
Supplementary Fig. 5B). In all, 74% of BDR-protected genes are
on the same strand as their immediate upstream neighbor,
compared to 50% for all genes in the genome (Fig.
5
a and
Sup-plementary Fig. 5B). No significant enrichment for orientation
was found in the downstream neighbor of BDR-protected genes,
although BDR-repressed genes showed a slight preference for
having a downstream tandem neighbor (Supplementary Fig. 5B).
In addition to orientation, we also examined the intergenic
dis-tances between BDR-protected genes and their upstream
neigh-bors. The TES of the upstream gene is much closer to the TSS of
BDR-protected genes (244 bp) compared to the genome-wide
median of 859 bp (Fig.
5
b). Finally, we examined the expression
levels of tandem upstream genes. The tandem upstream
neigh-bors of BDR-protected genes were more highly expressed
(~2.5-fold higher) than the tandem upstream neighbors of
non-differentially expressed controls or BDR-repressed genes (Fig.
5
c).
These tandem upstream genes were enriched for functions related
to protein translation, subcellular targeting, and salt stress
(Fig.
5
c). In contrast to the BDR-protected genes themselves, the
tandem upstream neighbors of BDR-protected genes were
typi-cally not differentially expressed in the bdr1,2,3 triple mutant.
Thus BDR-protected genes preferentially occur a short distance
downstream of a highly expressed gene on the same strand and
BDR proteins are required to maintain the expression of the
downstream gene but not the upstream neighbor.
BDR proteins promote 3′ Pol II pausing. Given that
BDR-protected genes are generally located a short distance
down-stream of a highly expressed neighbor on the same strand, we
speculated that 3′ pausing at the upstream gene might be
important in protecting the downstream gene from TI. TI is
broadly defined as the direct negative impact of one gene’s
transcription on a second gene that is located in cis
1. For
example, it is possible for elongating Pol II from one gene to
intrude into the promoter of a downstream gene on the same
strand, disrupting its expression
2–5.
b
c
−5 0 5 10 mRNA expression ofupstream tandem gene
log2(RPKM)
n
= 11,271
n
= 543 n = 243 n = 416
All genes Not DE BDR-repressed BDR-protected p = 3e–19 Salt stress Vacuole targeted Ribosome biogenesis Translation 0 2 4 6 % annotated genes All genes Upstream of
BDR-protected p = 4e–07 p = 2e–06 p = 4e–04 p = 6e–04 0.01 0.1 1 10 Intergenic distance (Kb) Upstream intergenic distance p < 1e–300 p = 1e–06 Median = 859 bp n = 12,011 Median = 900 bp n = 679 Median = 1310 bp n = 300 Med. = 244 bp n = 438 0 Not DE BDR-protected BDR-repressed All genes BDR-regulated gene
a
−2 Kb TSS TES +2 Kb 0.00 0.25 0.50 0.75 0.00 0.25 0.50 0.75 Genomic coordinateCoverage of TAIR10 annotations
BDR-regulated gene Not DE (n = 1408) BDR-protected (n = 592) BDR-repressed (n = 529) Same strand Opposite strand
Fig. 5 Genes positively regulated by BDR proteins tend to have highly expressed upstream neighbors on the same strand. a Fraction of BDR-regulated genes that have upstream or downstream neighbors at various orientations, within the indicated distances.b BDR-protected genes and their upstream tandem neighbors have short intergenic distances. Distribution of intergenic distances between tandem genes. Distribution differences relative to all genes were evaluated by Kolmogorov–Smirnov test with BH correction. c The upstream tandem neighbors of BDR-protected genes have relatively high expression levels. Wild-type gene expression levels for upstream tandem neighbors from the indicated groups of genes (left panel). Differences are evaluated by Mann–Whitney U test. Right panel, gene ontology analysis (goseq R package) of the upstream tandem neighbors of BDR-protected genes. Categories with p < 0.001 are shown. The centerline of the boxplot is the median. The bounds of the box are the first and third quartiles (Q1 and Q3). Whiskers represent data range but are bounded to 1.5-fold the interquartile range (Q3–Q1); points outside this range are represented individually
To explore the model that BDR proteins might be important
in promoting 3′ pausing at the upstream neighbors of
BDR-protected genes, we examined the Pol II occupancy at the
upstream neighbors of BDR-protected genes in wild type. We
found that the upstream neighbors of BDR-protected genes have
elevated 3′ pausing compared to a set of 1500 control genes with
levels of expression similar to the upstream neighbors of
BDR-protected genes (Fig.
6
a and Supplementary Fig. 6). To determine
whether the increased 3′ pausing is correlated with BDR proteins,
we examined BDR protein occupancy at the upstream neighbors
of BDR-protected genes. Compared to BDR-repressed genes or
expression-matched control genes, BDR protein occupancy was
BDR-protected
d
BDR1 0 50 BDR2 0 50 0 10 0 2.5 wt wt wt 0 40 wt 0 40 bdr1,2,3 RNAseq Pol II BDR3 wt 0 40 wt 0 40 0 150 0 150 bdr1,2,3 S2P 0 2.5 0 150 0 100 0 10 0 4 0 400 0 400 0 4 bdr1,2,3 7.232 mb 7.235 mb 8.961 mb 8.966 mb AT3G24550 AT3G24560 AT1G20810 AT1G20816f
p = 6e−08 0 3 6 9 Genes with loops (%) All genes BDR-protected BDR-represseda
c
20 30 40 15 20 25 15 20 Genomic coordinate Coverage (FP10M) –2 Kb TSS TES +2 Kb Control Pol II S5P –1000 –500 TES 500 1000 20 30 40 20 25 16 18 20 22Position relative to TES (bp)
Coverage (FP10M) WT bdr1,2,3 97 bp 93 bp 99 bp Pol II S5P S2P S2P
Pol II Pol II S2P Pol II S5P
−200 0 200 −200 0 200 −200 0 200 Shift (bdr1,2,3 − WT) in coverage maximum (base pairs)
0.004
4e–05 6e–12 7e–09
e
Not DE All genes BDR-protected BDR-repressedb
−2 Kb TSS 50% TES +2 Kb 0.0 0.5 1.0 1.5 0.0 0.4 0.8 0.0 0.2 0.4 Genomic coordinatelog2(BDR ChIP/WT control)
BDR1 BDR2 BDR3 BDR-regulated gene Control BDR-protected BDR-repressed 0 0.5 0 0.5 0 0.25 0 0.25
higher at the upstream neighbors of BDR-protected genes
(Fig.
6
b), particularly near the TES. Because BDR occupancy is
correlated with gene expression levels and Pol II occupancy
(Figs.
2
b and
3
a and Supplementary Fig. 3), we investigated
whether Pol II occupancy could account for this enrichment.
Even after normalization of BDR ChIP-seq coverage by Pol II
occupancy, the enrichment in BDR1 and BDR2 binding at
tandem genes upstream of BDR-protected genes is still apparent
(Supplementary Fig. 7).
We also examined Pol II occupancy in the bdr1,2,3 mutant
background. In the absence of the BDR proteins, the magnitude
of 3′ pausing at the upstream neighbors of BDR-protected
genes is reduced (Fig.
6
c). We also found that peak 3′ pausing
shifted ~96 bp toward the TSS of downstream BDR-protected
genes (Fig.
6
c). Because most BDR-protected genes are <250 bp
away from their upstream tandem neighbor, 96 bp represents a
significant fraction of the intergenic distance and has the
potential to interfere with transcription initiation of the
downstream gene or result in readthrough transcription. To
investigate the latter possibility, we looked for evidence of
chimeric readthrough transcripts, which have been reported in
mutants for the RNA-binding protein fpa
29. We saw no
evidence, however, of chimeric transcripts between
BDR-protected genes and their upstream tandem neighbors (Fig.
6
d
and Supplementary Fig. 8). This suggests that the reduced
expression of downstream tandem genes in bdr1,2,3 may be due
to a failure of transcription factors to assemble at the promoter.
Interestingly, while BDR proteins affect the magnitude of 3′
pausing for a large fraction of the genome (Fig.
4
c), a significant
shift in the position of 3′ pausing was consistently observed
only for the upstream neighbors of BDR-protected genes
(Fig.
6
e).
BDR proteins are correlated with gene loops. Genome-wide
application of chromatin conformation capture-based methods,
such as HiC, revealed that large topologically associating
domains (TADs) are a prominent feature of most eukaryotic
genomes
30–33. Arabidopsis was thought to be an exception to this
trend, as large-scale TADs were not detected
34. This initial
observation, together with the lack of homologs of loop-forming
insulator proteins such as CCCTC-binding factor (CTCF)
35,
sug-gested that Arabidopsis may not make significant use of chromatin
loops. Analyses performed at higher resolution, however, showed
that short-range interactions are a major structural feature of the
Arabidopsis genome. Approximately 1800 intragenic interactions
have been identified between the 5′ and 3′ ends of genes
36. To
determine whether these
“gene loops” might be associated with
BDR protein function, we looked for an enrichment of loops in
BDR-regulated genes. In BDR-protected and BDR-repressed genes,
gene loops were not significantly overrepresented (Fig.
6
f). Given
the evidence that BDR proteins aid in preventing TI in particular
genomic contexts, we also determined the frequency of gene loops
in the upstream and downstream neighbors of BDR-regulated
genes. A significant enrichment in gene loops was only observed
for the tandem upstream neighbors of BDR-protected genes
(Fig.
6
f). This correlation suggests that chromatin architecture may
play a role in preventing TI.
BDR proteins attenuate TI in response to
photomorphogen-esis. If reduced gene expression in bdr1,2,3 is the result of TI
from upstream genes on the same strand, then increasing or
decreasing the expression of upstream genes might exacerbate
or relieve TI, respectively. To explore this possibility, we
examined the changes in gene expression that occur at closely
spaced tandem genes during photomorphogenesis, which
results in the differential expression of a significant fraction of
the genome. Wild-type and bdr1,2,3 seedlings were grown for
4 days in the dark. On the
fifth day, seedlings were either
maintained in darkness or transferred to white light for the
final
2 or 4 h prior to RNA isolation (Fig.
7
a). Gene expression
changes in response to light were largely similar between
bdr1,2,3 and wild type (Fig.
7
b, c).
To look for evidence of increased TI when upstream genes are
upregulated by light, we selected tandem genes with intergenic
distances <600 bp, where expression of the upstream gene was
similarly upregulated by light in both bdr1,2,3 and wild type. We
then determined the ratio of expression levels (bdr1,2,3/wt) for
the downstream genes under dark and light conditions.
Consistent with our model, we found that expression of the
downstream gene was significantly reduced in bdr1,2,3 upon
upregulation of the upstream gene by light (Fig.
7
d). We also
found that TI could be relieved via the downregulation of
upstream genes. Downstream genes that showed potential
TI under dark conditions (i.e., reduced expression in the
bdr1,2,3 mutant) showed a significant increase in expression
when the upstream gene was downregulated by light (Fig.
7
e).
Taken together, these experiments show that the TI in bdr1,2,3
can be modulated by changing the expression of the
upstream gene. Thus, in wild type, BDR proteins help to ensure
the stable expression of downstream genes as their upstream
tandem neighbors undergo light-regulated changes in gene
expression.
We also observed that BDR proteins contribute to the rapid
activation of light-regulated genes that have nearby upstream
neighbors on the same strand, regardless of whether the upstream
gene is light regulated. Among all genes that were light induced in
wild type, we observed significantly reduced expression in
bdr1,2,3 when the light-induced gene had an upstream neighbor
on the same strand and <600 bp away (Fig.
7
f). For example,
biochemical pathway analysis of the genes showing reduced
Fig. 6 BDR proteins protect downstream genes from TI. a Levels of 3′ paused Pol II are elevated at tandem upstream neighbors of BDR-protected genes compared to expression-matched control genes. Metagene profiles of Pol II, Pol II-S5P, and Pol II-S2P ChIP-seq coverage across expressed genes in Arabidopsis seedlings. b BDR1 and BDR2 are enriched in the intergenic region between BDR-protected genes and their upstream tandem neighbors. Metagene profiles of ChIP-seq coverage at genes located upstream, on the same strand, as BDR-protected, BDR-repressed, or expression-matched control genes.c 3′ paused Pol II at upstream genes is reduced and shifted downstream in the absence of BDR proteins. Pol II near the TES of tandem upstream neighbors of BDR-protected genes is shifted ~96 bp downstream in the bdr1,2,3 mutant. Average Pol II ChIP-seq profiles are presented. d Browser tracks of BDR-protected genes and their upstream tandem neighbors. Note the high BDR1 and BDR2 occupancy in the intergenic region, reduction in the expression of the downstream gene in the bdr1,2,3 mutant (red arrows), and the reduction in 3′ paused Pol II at the upstream gene (blue arrows). e The downstream shift in the position of 3′ pausing in bdr1,2,3 occurs preferentially at the upstream tandem neighbors of BDR-protected genes. The centerline of boxplots is the median. The bounds of the box are thefirst and third quartiles (Q1 and Q3). Whiskers represent data range but are bounded to 1.5-fold the interquartile range (Q3-Q1); points outside this range are omitted.f Upstream tandem neighbors of BDR-protected genes are enriched in gene loops36. Enrichment of gene loops in BDR-regulated genes and their neighbors. Statistics reflect the presence of loops in the circled gene in each context. p Values are shown for Fisher exact test with BH p value correction
induction in bdr1,2,3, showed a significant enrichment for genes
encoding Calvin–Benson–Bassham (CBB) cycle enzymes
(Sup-plementary Fig. 9), which uses ATP and NADPH created by
photosynthesis to convert carbon dioxide and water into organic
compounds
37. Three CBB cycle genes are located a short distance
from an upstream gene on the same strand (Fig.
7
g). Even though
the upstream genes are not induced by light, the downstream
CBB cycle genes show attenuated induction by light in the
absence of BDR proteins (Fig.
7
g).
Discussion
TI between tandem genes was described in human alpha-globin
genes >30 years ago
38and similar examples have been reported in
yeast
39,40, Drosophila
41, or following a T-DNA insertion in
Arabidopsis
42. At the genome-wide scale, however, our
under-standing of how often and to what degree TI might shape the
transcriptome is still limited. Examples from yeast suggest that
transcription-dependent changes in nucleosome occupancy and
histone marks at the promoter of the downstream gene may
Dark Light 2 h Light 4 h
d
e
g
f
4.062 Mb 4.064 Mb 16.126 Mb 16.130 Mb 13.284 Mb 13.390 Mb BDR1 15 40 BDR2 10 25 –60 0 wt wt 0 60 0 60 bdr1,2,3 wt RNAseq (wt) Pol II –60 0 –60 0 –60 0 –60 0 –60 0 10 50 10 25 0 100 0 60 0 60 0 100 0 100 0 100 0 100 0 100 20 50 10 25 0 2.5 0 30 0 30 0 2.5 0 2.5 0 2.5 0 2.5 0 2.5 AT3G12800 PGK/AT3G12780 AT1G42960 GAPDH AT4G26510 AT4G26520 FBA7 dark 2 h 4 h RNAseq ( bdr1,2,3 ) dark 2 h 4 h O S O S O S 0 1 0 1 0 1Orientation of the upstream gene
AT1G42970 –1 –1 –1 <600 bp 600–12,00 bp >1200 bp
Distance from upstream gene
Differential expression [log2(
bdr1,2,3
/WT)]
p = 6e–8 p = 1e–16 p = 1e–16
p = 0.03
–1 0 1
Differential expression of
downstream gene log2(
bdr1,2,3
/wt
)
Differential expression of
downstream gene log2(
bdr1,2,3 /wt ) Not DE (n = 214) Upreg. (n = 231) Not DE (n = 70) Downreg. (n = 148) 0 –1 –2 p = 2e–5 p = 0.016 p = 1e–4 p = 2e–4 p = 0.015 Regulation of upstream gene by light Regulation of upstream gene by light Light (h) Light (h) 0 2 4 0 2 4 0 2 4 0 2 4 Germination 5 days Dark Light 2 h Light 4 h
a
b
–10 –5 0 5 10 –20 0 20 PC1 (88%) PC2 (6%) Light 2 h Light 4 h wt bdr1,2,3 bdr1,2,3 887 893 6559 Downregulated by 2 h or 4 h light Upregulated by 2 h or 4 h light 834 906 6802 wtc
Dark wt bdr1,2,3contribute to TI
2,43. This does not appear to be the case for
BDR-protected genes, however, as our MNase and histone ChIP-seq
data indicate that the intergenic regions upstream from
BDR-protected genes are nucleosome depleted. Rather, our data suggest
that a reduction in 3′ Pol II pausing and a shift in Pol II
occu-pancy at the upstream gene are likely responsible for perturbing
the function of the downstream promoter in bdr1,2,3 mutant. The
precise mechanism by which BDR proteins promote 3′ Pol II
pausing is unclear; however, it is tempting to speculate that an
increased Pol II elongation rate in bdr1,2,3 mutant might be
responsible for a shift in Pol II termination site, as a downstream
shift in termination has been observed using a
“fast” elongating
Pol II in human cells
44.
Although plants lack homologs of canonical animal insulator
proteins, such as CTCF, the role of BDR proteins in ensuring that
transcription of an upstream gene does not interfere with the
expression of a closely spaced downstream neighbor can be thought
of as a type of insulating activity. This suggests interesting parallels
in the relationships between gene expression and chromatin
orga-nization in animals and Arabidopsis. In animals, it is common for
enhancer elements to be located many kilobases away from the
target gene
45. This creates a twofold problem of how to ensure that
an enhancer element associates with/promotes the expression of the
correct gene, while making sure that it does not affect the
expres-sion of other nearby genes. In animals, CTCF and cohesin help to
solve both problems through the formation of loops/TADs, where
sequences inside the loop are more likely to interact with each other
than with sequences outside the loop. In this way, enhancer
ele-ments preferentially associate with genes inside the same loop and
are
“insulated” from genes outside the loop
35. Arabidopsis
reg-ulatory sequences, in contrast, are most often located near the
promoter; examples of enhancer elements acting at a significant
distance are rare
46. Thus there may be less need for CTCF-type
insulators and large-scale TADs. The relatively compact genome of
Arabidopsis, however, creates other problems, such as TI between
closely spaced genes. Interestingly, part of the solution in plants
may also involve chromatin loops. The enrichment of gene loops
and BDR proteins in upstream tandem genes suggests that they
may play a role in promoting 3′ pausing and/or Pol II recycling
47thereby preventing TI with downstream neighbors.
Taken together, these results indicate that BDR proteins inhibit
TI by promoting 3′ pausing at upstream genes, thereby protecting
the promoter region of the downstream gene from invasion by
upstream, terminating Pol II. It is interesting to note that,
although 3′ pausing is reduced at upstream genes in bdr1,2,3, the
expression of the upstream genes themselves is usually not
affected. This suggests that a gene’s 3′ pausing may be more
important for protecting the expression of its neighbors than for
its own expression. This type of an activity would be predicted to
be particularly important in an organism, such as Arabidopsis,
with relatively short intergenic regions.
Methods
Plant material and growth conditions. bdr1-1, SALK_142108C; bdr2-1, WISCD-SLOX352H03; and bdr3-1, SALK_059905C were obtained from the Arabidopsis Biological Resource Center (Columbus, OH) and confirmed by Sanger sequencing. Plants were grown at 22 °C in long days (16-h light/8-h dark) under cool-white fluorescent light with a light intensity of approximately 125 μmol m−2s−1. Constructs. For epitope tagged constructs, the BDR1, BDR2, and BDR3 genomic DNAs without stop codons were transferred from pENTR to the destination vector pGWB1648, which contains 4xMYC. Resulting constructs were used as templates to amplify BDR1::4×MYC, BDR2::4×MYC, and BDR3::4×MYC using primers that incorporate Sbf I and Spe I sites (for BDR1: At5g25520-P1-sbf I-F cacctgcaggtc tctctttcccaaaaatttcaaaac+2701-pGWB16-myc-spe I-R actagtgatcggggaaattcgagctct aagcgctaccg; for BDR2: At5g11430-P1-Sbf I-F cacctgcaggatggccattgttttatttctaagg +2701-pGWB16-myc-spe I-R; for BDR3: At2g26540-P1-Sbf I-F cacctgcaggacttttg atatatccaaagggaattcg+2701-pGWB16-myc-spe I-R). The resulting fragments were first cloned into pENTR/D-TOPO and subcloned between Sbf I and Spe I sites in pMDC3049.
RNA expression analysis. For RNA-seq, total RNA was isolated from Arabidopsis seedlings using the Trizol reagent (Sigma) or Spectrum Plant Total RNA Kit (Sigma) or Plant/Fungi Total RNA Purification Kit (Norgen) following the man-ufacturer’s instructions. The integrity of RNA samples was analyzed with Agilent Technologies 2200 Tape Station (Agilent Technologies). Input was quantified by using the Qubit RNA BR Assay Kit. RNA-seq Libraries were prepared from total RNA using the TruSeq Stranded mRNA LT Sample Prep Kit (Illumina) and were sequenced on an Illumina NextSeq 500 at the Center of Genomics and Bioinfor-matics, Indiana University or Illumina Hiseq 2000 at the Genome Sequencing Facility in the Greehey Children’s Cancer Research Institute of University Texas Health Science Center, San Antonio. All high-throughput sequencing data and corresponding experimental details are available in GEO SuperSeries GSE112443. Chromatin immunoprecipitation followed by next-generation sequencing. Nuclei were isolated from cross-linked samples as described previously50and resuspended in nuclei lysis buffer (50 mM Tris-HCl pH8, 10 mM EDTA, 1% sodium dodecyl sulfate (SDS), 1 mM phenylmethanesulfonylfluoride (PMSF), 1% Plant Protease Inhibitors from Sigma). After fragmentation using a Covaris S200, the chromatin samples were diluted with ChIP dilution buffer (final concentration: 1% Triton X-100, 2 mM EDTA, 20 mM Tris-HCl pH8.0, 150 mM NaCl, 1 mM PMSF, 0.1% SDS, 1% Plant Protease Inhibitors, Sigma). The diluted chromatin samples were subjected to immunoprecipitation with antibodies (anti-MYC tag, clone 4A6, Millipore 05–724 (30 μg); Anti-RNA polymerase II CTD repeat YSPTSPS antibody [8WG16] Abacm ab817 (20μg); Anti-RNA polymerase II CTD repeat YSPTSPS (phospho S2) antibody, Abcam ab5095 (30μg); Anti-RNA poly-merase II CTD repeat YSPTSPS (phospho S5) antibody Abcam ab5131 (30μg); and control IgG Abcam ab18413 (20μg)).
Native histone ChIP was performed as described previously51using anti-Histone H3 Abcam ab1791 (10μg).
The ChIP libraries were prepared using the NEBNext® Ultra™ DNA Library Prep Kit (New England Biolabs) and then sequenced on a NextSeq 500 (Illumina) Fig. 7 Modulation of TI during photomorphogenesis. a Schematic illustrating growth conditions used to generate 2 and 4-h light samples, as well as dark-grown controls.b, c Principal component analysis and Venn diagrams on RNA-seq data show the overall similar response of wild-type and bdr1,2,3 mutant to light.d BDR proteins help prevent TI when nearby tandem upstream genes are upregulated by light. From all tandem gene pairs with an intergenic distance <600 bp, we selected those with upstream genes that were either upregulated or not differentially expressed at both 2 and 4 h light. Boxplots show decreased relative expression (log[bdr1,2,3/wt] values) of the downstream gene when the upstream gene is upregulated by light. Significant changes of log2(bdr1,2,3/wt) are evaluated by Wilcoxon signed-rank test. e Downregulation of the upstream tandem neighbor by light can attenuate TI in bdr1,2,3. From all tandem gene pairs with an intergenic distance <600 bp, we selected those with a downstream gene showing some evidence (p < 0.05) of transcriptional interference (i.e., downregulated in bdr1,2,3 vs wt) under the darkness. Tandem pairs were then selected where the upstream gene showed either downregulation or no change in expression at either 2 or 4 h light. Boxplots show the upregulation of the downstream gene when the upstream gene is repressed by light (log[bdr1,2,3/wt] values). Significant changes of log2(bdr1,2,3/wt) are evaluated by Wilcoxon signed-rank test. f Light-upregulated genes show decreased expression in bdr1,2,3 when located a short distance from an upstream neighbor on the same strand. Genes activated by light in wild type were binned by distance to their upstream neighbor. In each case, the expression ratio (bdr1,2,3/wt) was compared for genes having upstream neighbors on the same vs opposite strands using Mann–Whitney U test with BH adjustment. The centerline boxplots is the median. The bounds of the box are thefirst and third quartiles (Q1 and Q3). Whiskers represent data range but are bounded to 1.5-fold the interquartile range (Q3–Q1); points outside this range are represented individually.g Browser tracks showing genes encoding three CBB cycle enzymes. PGK, GAPDH, and FBA are rapidly induced by light and are located a short distance from an upstream neighbor on the same strand. In bdr1,2,3, the upregulation by light is reduced
at the Center of Genomics and Bioinformatics, Indiana University. All high-throughput sequencing data and corresponding experimental details are available in GEO SuperSeries GSE112443.
RNA-seq computational analysis. Two independent RNA-seq studies each with biological triplicates were performed in wild type and bdr1,2,3 triple mutant seedlings that were grown under standard conditions (GSE112440 and GSE112441). The second study (GSE112441) also included bdr1, bdr2, and bdr3 single mutant seedlings. Except when otherwise stated, study GSE112441 was used to compute thefigures presented in this manuscript. We systematically verified that consistent results were obtained with both the RNAseq studies.
For GSE112440 (49 bp single-end reads sequenced on Illumina HiSeq 2000 instrument) and GSE112441 (2 × 43 bp paired-end reads sequenced on Illumina NextSeq 500 instrument), read alignments (For GSE112440: topHat 252; for GSE112441: STAR53),filtering to keep uniquely aligned reads (samtools and grep commands54), and gene-level read counting (featureCounts55and differential expression analysis with DESeq256) were performed as described in the corresponding GEO records. Genes with Benjamini–Hochberg (BH)-adjusted p values <0.05 were considered differentially expressed. Using GSE112441 RNA-seq data, we defined a list of 1408 control, non-differentially expressed genes (“Not DE”) by selecting genes with high p values (p > 0.45) and low absolute log2(fold-change) (<0.25) for all comparisons (single bdr1, bdr2, and bdr3 mutants and the bdr1,2,3 triple mutant vs wild type) and removing genes with extreme read counts (DESeq2 basemean >3 and <1e5). Enrichments for Gene Ontology (GO) biological processes among the gene sets (upregulated or downregulated) were evaluated using the goseq package57.
ChIP-seq computational analysis. All ChIP-seq samples were sequenced in paired-end mode on an Illumina NextSeq500 instrument (read length of 40, 43, or 155 bp, as specified in the corresponding GEO entries). Sequencing adapters were removed using Trimmomatic 0.33 in paired-end mode58and reads were aligned to the Arabidopsis genome using Bowtie259using the–dovetail parameter and a maximum insert size of 1 Kb. Duplicate fragments were removed with Picard 2.2.4 MarkDuplicates (http://broadinstitute.github.io/picard/). Samtools v 1.3 was used to keep only reads mapped in proper pairs with mapping quality (MapQ) >2. For MNase-seq and ChIP-seq on histone modifications, we found that fragments <70 bp were enriched for background signal and fragments >250 bp for signal corre-sponding to dinucleosomes. Thus we only kept the reads correcorre-sponding to frag-ment sizes between 70 and 250 bp. Aligned reads were imported in R (v.3.3.2) to obtain coverages using Bioconductor v3.460. Coverages were normalized as frag-ments per 10 million fragfrag-ments (FP10M) and exported to bigWigfiles with the rtracklayer package61. ChIP-seq peaks were detected using MACS2 2.1.062in paired-end mode. Peaks located in blacklisted regions were removed. Annotation of peaks relative to genomic features were obtained using the ChIPpeakanno package63.
Average profiles and metagene plots. Coverages (e.g., FP10M for ChIP-seq data, phatsCons score, or annotation coverages) or normalized coverages (e.g., log2(BDR ChIP/WT control ChIP)) were directly used, without binning or smoothing, to produce average profiles centered on genomic features of interest (e.g., peak cen-ters, TSS, or TES). After selecting a gene set of interest, the most extreme 0.01% coverage values were replaced by the upper 99.99th percentile value before cal-culating the average value (“metagene”, solid line) and the associated 95% con-fidence interval (CI) (shade). For the latter, we used a normal approximation, which on several examples gave results nearly identical to bootstrap estimates of the CIs as implemented in the ChIPseeker package64. For metagene plots centered on gene bodies, wefirst averaged the signal in 100 bins covering the gene body (i.e., bin size of 1% of gene length).
Multigene heatmaps. Multigene heatmaps were produced with the Enriched-Heatmap package65from coverages (in FP10M) or normalized coverages that were averaged in 20 bp bins before/after genomic features of interest (TSS, TES, or peak center) or in bins covering every 1% of gene length along gene bodies. Definition of a blacklist for the Arabidopsis genome. We used 20 control samples (input DNA or IgG ChIP) obtained in our laboratory from different ChIP-seq experiments (both sonicated and MNase-fragmented chromatin) to define a blacklist of genomic regions with systematically high signal in control samples. We used the Bioconductor package GreyListChIP66to generate a list of regions with high signal (95th percentile of negative binomial distribution estimated from 100 random samples of size 30,000) in >50% of the control samples and refined these regions manually on a genome browser using independent ChIP and control samples. A bedfile of blacklisted regions is provided as a supplementary file (BlackList_TAIR10.bed).
Bioinformatic methods for eachfigure. Figure2a. Coverages from BDR1::MYC (GSE113059), BDR2::MYC (GSE113059), BDR3::MYC (GSE131772), and Pol II (GSE113078) ChIP-seq fragments (units: FP10M) and average coverage from
RNA-seq (GSE112441) fragments obtained from 3 wild-type samples (units: RPM, sign indicating on which strand the reads align) were plotted for ~32 Kbp region of chromosome 5 using the Gviz package67.
Figure2b. Metagene profiles of BDR1::MYC, BDR2::MYC, and BDR3::MYC
normalized ChIP-seq signal were obtained for 9 groups of genes defined by increasing mRNA expression levels in wild type (n= 2232–3005 genes per group, Supplementary Data 1, Table S1). The average BDR-normalized ChIP-seq signal for each group (line) and the associated 95% CI based on a Gaussian assumption (shade) are represented. Signal in gene bodies was averaged in bins of 1% of the gene size. For each group, we obtained metagene profiles using the ChIP-seq data for BDR1::MYC (left), BDR2::MYC (center), or BDR3::MYC (right) as described above.
Figure2c. ChIP-seq peaks for BDR1::MYC, BDR2::MYC, and BDR3::MYC were identified using MACS 2.1.062in paired-end mode using the corresponding control ChIP performed on the same day in wild-type plants using the same anti-MYC antibody. After removing peaks located in blacklisted regions, we obtained 21,334 peaks for BDR1, 11,997 peaks for BDR2, and 12,178 peaks for BDR3 (p < 0.01, peak coordinates available in GSE113059 and GSE131772). Overlaps between the peaks were evaluated with the ChIPpeakAnno package63and plotted as a Venn diagram using the Vennerable R package68.
Figure2d. The summits of BDR1, BDR2, and BDR3 peaks were annotated relative to genomic features with the ChIPpeakanno package63using the following order of precedence (e.g., once a peak is annotated as promoter, it cannot be attributed to another category): Promoters (<300 bp upstream of TSS), immediate downstream (<300 bp downstream of TES), 5′-UTR, 3′-UTR, exons, introns, intergenic regions (>300 bp from any gene annotation). The percentage of peaks annotated in each category is shown. For comparison, the distribution of each genomic feature in the whole genome (using the same annotation precedence) is also illustrated (gray bars). Asterisk (*) indicates a significant enrichment of peaks within the corresponding annotation. Statistical significance of the enrichment for each genomic feature was assessed using 10,000 random samples of genomic positions.
Figure2e. For each BDR protein, we identified all the protein-coding genes
having a BDR peak within 300 bp of their TSS and plotted the average normalized coverage of the corresponding BDR::MYC ChIP. Maximum normalized coverage were found at−87, −31, and −148 bp upstream of the TSS for BDR1, BDR2, and BDR3, respectively. The Venn diagram illustrates the overlap between the gene lists obtained for the different BDR proteins.
Figure2f. As for Fig.2e, we identified for each BDR protein the protein-coding
genes with a BDR peak within 300 bp of their TES and plotted the corresponding average profiles around the TES and the Venn diagram illustrating the intersections of gene lists. Maximum normalized coverages were found at+106, +131, and +117 bp downstream of the TES for BDR1, BDR2, and BDR3 respectively.
Figure3a. Coverages (normalized by WT ChIP for BDR proteins) were averaged in 20 bp bins before the TSS and after the TES, and in bins of 1% of gene length along the gene bodies. For each gene, we summed BDR1 signal at the TSS ±10 bins and at the TES ±10 bins to obtain gene-specific BDR1 occupancy. The top 15,000 genes in terms of BDR1 occupancy were sorted in decreasing order to draw heatmaps using the EnrichedHeatmap package65. DNase-hypersensitivity signal was obtained from GSE3431869.
Figure3b. Sequence conservation (phastCons) scores from the alignment of 20 angiosperm plant genomes were obtained from ref.25and values overlapping with TAIR10 gene annotations were masked in order to focus on intergenic sequence conservation only. We selected:
1. 19,317 (BDR1), 10,020 (BDR2), or 9,204 (BDR3) ChIP-seq peaks that overlapped to some extent with intergenic regions;
2. 12,431 random regions overlapping with intergenic regions but not overlapping with BDR1 peaks or with blacklisted regions; and
3. 18,255 nucleosome-free regions defined as regions with >500 bp of consecutive MNase-seq and H3 ChIP-seq coverage below thefirst quartile of the respective datasets (GSE113076) and not overlapping with BDR1 peaks or blacklisted regions.
For each of these groups, we plotted the average phastCons scores around the respective BDR peak summits (±500 bp) or the respective region centers. Shades around the lines show the associated 95% CI using a Gaussian approximation.
Figure3c. For the two motifs that were found to be enriched under BDR1 and BDR2 peaks (see Fig.3d), the TCP-like motif and the E-box motif, we plotted their distribution around BDR1 or BDR2 peak summits and around the TSS or TES of protein-coding genes. At each base, the plot represents the percentage of bases that overlap with a TCP-like (blue) or an E-box motif (green), along with the 95% CI based on a Gaussian assumption (shade).
Figure3d. We performed a de novo search for motifs enriched under BDR1 and BDR2 peaks using the peak-motif program from Regulatory Sequence Analysis Tools: RSAT70. We found highly similar motifs using BDR1 or BDR2 peaks so we only present the results for BDR1. We resized BDR1 peaks to ±50 bp around their summit and kept the peaks contained within intergenic regions (12,573 BDR1 peaks). We used control 101 bp intergenic regions with low nucleosome-associated signals (MNase and H3 ChIP), as defined for Fig.3b, as background. Applying RSAT matrix-clustering, we identified two clusters of motifs corresponding to a TCP-like motif and an E-box motif. The core motifs from these two clusters were further trimmed to remove edges with low information content. We used the