HAL Id: hal-02316402
https://hal.archives-ouvertes.fr/hal-02316402
Submitted on 15 Oct 2019
HAL is a multi-disciplinary open access
archive for the deposit and dissemination of
sci-entific research documents, whether they are
pub-lished or not. The documents may come from
teaching and research institutions in France or
abroad, or from public or private research centers.
L’archive ouverte pluridisciplinaire HAL, est
destinée au dépôt et à la diffusion de documents
scientifiques de niveau recherche, publiés ou non,
émanant des établissements d’enseignement et de
recherche français ou étrangers, des laboratoires
publics ou privés.
Experimental Characterization of LoRaWAN Link
Quality
Takwa Attia, Martin Heusse, Bernard Tourancheau, Andrzej Duda
To cite this version:
Takwa Attia, Martin Heusse, Bernard Tourancheau, Andrzej Duda. Experimental Characterization
of LoRaWAN Link Quality. IEEE Global Communications Conference (GLOBECOM), Dec 2019,
Waikoloa, United States. �hal-02316402�
Experimental Characterization of LoRaWAN
Link Quality
Takwa Attia, Martin Heusse, Bernard Tourancheau, and Andrzej Duda
Univ. Grenoble Alpes, CNRS, Grenoble INP, LIG F-38000 Grenoble, France
Email: {[email protected]}
Abstract—In this paper, we present the results of extensive experiments on a testbed in the The Things Network (TTN), a public LoRa network. We evaluate the transmission quality of LoRa links by measuring the Packet Reception Rate (PRR) as a function of the payload length.
The results show that there is only a slight impact of the payload length on PRR, which means that the bit error rate does not strongly influence the probability of packet reception. Our measurements show that the LoRa channel behaves like a slow
fading Rayleigh channel, which translates into probability Psof
being (or not) in a favorable condition for each frame reception: once the frame preamble is received, there is great chance that
the whole frame is correctly received. Probability Psdepends on
the Spreading Factor and the Signal to Noise Ratio, and often becomes a dominant factor of successful reception depending on the signal strength at a gateway.
Index Terms—LoRa, LoRaWAN, Packet Reception Rate
I. INTRODUCTION
The LoRa technology is gaining an increasing interest from both academia and industry. It perfectly addresses the Internet of Things (IoT) needs for a Low Power Wide Area Network (LPWAN) able to provide connectivity to a wide area with a large number of IoT devices. It defines a specific radio layer based on the Chirp Spread Spectrum (CSS) modulation [1], much different from the modulations used in other types of wireless networks. The LoRa CSS modulation results in good sensitivity levels enabling transmissions over long distances: a range of several kilometers outdoors and hundreds of meters indoors.
LoRaWAN [2] defines an access method to the radio chan-nel similar to ALOHA: a device wakes up and sends a packet to the gateway right away. This choice of the access method highly impacts the quality of transmissions in terms of Packet Reception Rate (PRR) and scalability to a large number of devices.
Like for any new emerging technology, it is crucial to investigate its performance in terms of transmission qual-ity and abilqual-ity to scale. Many authors addressed the issue of evaluating LoRa performance and scalability with ana-lytical modeling [3], [4], simulation [5]–[10], or measure-ments [7], [9], [11]–[14]. In previous work, we designed WiSH-WalT, a framework for controllable and reproducible LoRa testbeds [15]. WiSH-WalT enables easy configuration of motes with several configuration parameters and running
measurement experiments. We began to investigate how the quality of reception depends on the main LoRa configuration parameters: Spreading Factor (SF) and Transmission Power (TP) [15].
In this paper, we report on the results of extensive exper-iments on the WiSH-WalT testbed in The Things Network (TTN), a public LoRa network [16] during several months. The goal of these experiments is to characterize the transmission quality of LoRa links by measuring PRR as a function of the payload length. Several factors may impact PRR and we wanted to evaluate how they influence the probability of correct frame reception.
Our main finding is that there is only a slight impact of the payload length on PRR, which means that the bit error rate does not strongly influence the probability of packet reception. Successful reception rather depends on favorable conditions for receiving the whole frame (the preamble, the header, and the payload): no collisions as well as no strong attenuation during the transmission so that preamble detection and time synchronization succeeds at the gateway and successful packet reception ensues. Our measurements show that the LoRa channel behaves like a slow fading Rayleigh channel—each transmission faces an exponentially distributed Rayleigh chan-nel gain that remains mostly constant during the transmission. We quantify successful reception with probability Psof being (or not) in a favorable condition for each frame reception: once the frame preamble is received, there is great chance that the whole frame is correctly received. We estimate probability Ps and show that it depends on SF and Signal to Noise Ratio (SNR), and often becomes a dominant factor of successful reception depending on the signal strength at a gateway.
These findings have important implications for LoRaWAN application designers: to achieve high levels of data delivery, devices need to consider packet retransmissions because they have to cope with frame losses not only due to the ALOHA access method, but also to the channel variability. As larger frames have similar PRR as smaller ones, retransmitting data aggregated in larger frames is not only more efficient in terms of overhead, but it also significantly improves the data delivery rate, as long as the duty cycle limit is met.
In the rest of the paper, we describe the basics of LoRa networks (Section II), present our testbed (Section III), and re-port on the results of our experiments (Section IV). In Section V, we analyze the PRR anomaly, relate it to the probability
of failed receiver synchronization, and present measurements showing its dependence on SF and SNR. Finally, we briefly discuss related work (Section VI) and draw some conclusions (Section VII).
II. LORA ANDLORAWAN BASICS
LoRa is a wireless modulation based on the principle of Chirp Spread Spectrum (CSS) [1]. CSS consists of cyclic frequency varying chirps that encode bits of information. It requires strong temporal synchronization to reach a good decoding level (we discuss this issue in Section V).
We can control the physical layer of LoRa through the following parameters [17]:
• Bandwidth (BW): it is the range of transmission frequen-cies. We can configure the bandwidth between 7.8 kHz and 500 kHz. Larger bandwidth allows for a higher data rate, but results in lower sensitivity.
• Spreading Factor (SF) characterizes the number of bits carried by a chirp: SF bits are mapped to one of N = 2SFpossible frequency shifts. SF varies between 6 (7 in practice) and 12 with SF12 resulting in the best sensitivity and range, at the cost of achieving the lowest data rate and worst energy consumption. Decreasing the SF by 1 unit roughly doubles the transmission rate and divides by 2 the transmission duration as well as energy consumption. • Coding Rate (CR): it corresponds to the rate of Forward Error Correction (FEC) applied to improve packet error rate in presence of noise and interference. A lower coding rate results in better robustness, but increases the transmission time and energy consumption. The possible values are: 4/5, 4/6, 4/7, and 4/8.
• Transmitted Power (TP): LoRaWAN defines the follow-ing values of TP for the EU 863-870 MHz band: 2 dBm, 4 dBm, 6 dBm, 8 dBm, 12 dBm, and 14 dBm.
Table I: LoRa parameters for 125 kHz BW.
SF SNR limit Airtimefor 10 B Bit rate PLmax
7 -7.5 dB 56 ms 5469 b/s 230 B 8 -10 dB 103 ms 3125 b/s 230 B 9 -12.5 dB 205 ms 1758 b/s 123 B 10 -15 dB 371 ms 977 b/s 59 B 11 -17.5 dB 741 ms 537 b/s 59 B 12 -20 dB 1483 ms 293 b/s 59 B
Table I presents the main performance parameters: SF, data rate, SNR limit, the airtime for a 10 byte packet, and the maximum payload length (PLmax).
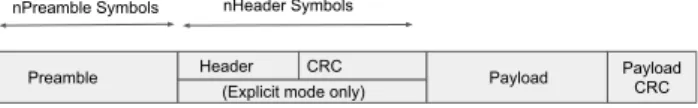
Preamble Header CRC
(Explicit mode only) Payload
Payload
CRC
nPreamble Symbols nHeader Symbols
Figure 1: LoRa frame structure.
A LoRa frame starts with a preamble followed by an explicit header, a payload, and CRC [17] (see Figure 1). The preamble
length is programmable and takes values from 10 to 65,536 symbols in total (by default, 12 symbols). In explicit mode, the explicit header contains information about the payload: length, CR, and the information whether CRC is used.
LoRaWAN is a MAC protocol proposed by the LoRa Alliance [2] over the physical layer based on the LoRa mod-ulation. It defines the network architecture, the radio access method, and the MAC frame structure. LoRaWAN defines a star topology network composed of end devices and gateways connected through the Internet to a network server. For class A devices (those that may achieve long lifetimes through the use of low duty cycles), LoRaWAN defines an access method similar to ALOHA: a device wakes up and sends a packet on a chosen radio channel. One or several gateways nearby can receive the packet and forward it further on to a network server. The difference with pure ALOHA is the variable packet length in LoRaWAN. End devices have to respect the regulatory restrictions with a duty cycle of less than e.g. 1% in each of the European (EU) 868 MHz bands.
This choice of a simple access method highly impacts the reliability of LoRaWAN and its scalability to a large number of devices—the well-known theoretical channel utilization for ALOHA with fixed packet sizes is around 18% (1/e). It results in a high level of packet loss due to collisions as the number of devices increases. Even if we take into account the capture effect1, which increases the packet reception probability in case of collisions, the access method strongly limits the capacity of the network to scale.
III. TESTBED ANDEXPERIMENTALSETUP
Our testbed consists of five STMicroelectronics motes [19] that operate under the WiSH-WalT framework [15] in the TTN network, an open source free-of-charge LoRa network. Its gateways forward traffic to the EU TTN server from which we collect data for characterizing transmission quality. WiSH-WalT enables easy configuration of motes with several parameters and running experiments. Each gateway performs a CRC check: if CRC is valid, the gateway forwards the packet to the TTN server, otherwise, it drops the packet. The number of gateways correctly decoding a given packet mainly depends on SF of each transmission, since higher SF trades data rate for transmission quality to reach larger distances. Up to 13 gateways were receiving the traffic from our motes.
We ran a background script that saves all generated traffic through an MQTT client. A mote periodically sends packets while varying the payload length (PL) from 0 to PLmax with 1% of duty cycle and respecting the limitations given in Table I. We performed experiments in three configurations:
• CONF-A: SF = 9, TP = 14 dBm, and we vary the payload length from 0 to 120 bytes.
• CONF-B: same as CONF-A, but we alternate between TP = 10 dBm and TP = 2 dBm.
1The capture effect refers to the capacity of correctly receiving a significant
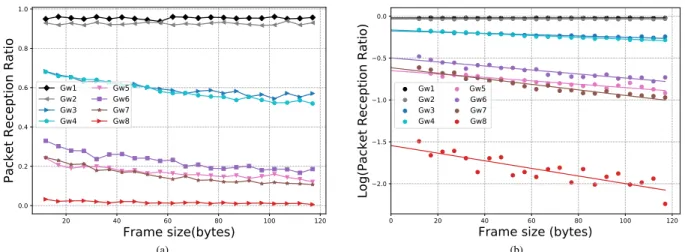
20 40 60 80 100 120 Frame size(bytes) 0.0 0.2 0.4 0.6 0.8 1.0 Pa cket R ec ep ti o n R a ti o Gw1 Gw2 Gw3 Gw4 Gw5 Gw6 Gw7 Gw8 (a) 0 20 40 60 80 100 120
Frame size (bytes)
2.0 1.5 1.0 0.5 0.0 Lo g (Pa cket R ec ep ti o n R a ti o ) Gw1 Gw2 Gw3 Gw4 Gw5 Gw6 Gw7 Gw8 (b)
Figure 2: a) PRR vs. frame size for SF9, TP = 14 dBm. b) log(PRR) vs. frame size for SF9.
• CONF-C: TP = 14 dBm, we vary the payload length from 0 to 55 bytes, and alternate between SF = 11, SF = 9, and SF = 7.
We set BW to 125 kHz and CR to 4/5 in all configurations. Table II: Altitude of the gateways and distance to them ordered by reception quality.
Id. Altitude (m) Distance (km)
Gw1 220 0.01 Gw2 240 0.03 Gw3 220 2.4 Gw4 - -Gw5 253 3.9 Gw6 233 4.4 Gw7 246 2.9 Gw8 210 1.7 Gw9 249 5.2 Gw10 256 5.5 Gw11 244 5.7 Gw12 238 7.1 Gw13 2253 18.3
Table II gives, when available based on the GPS location, the altitude of the gateways collecting packets during the experiments and the distance from our motes to them. We number the gateways in the order of the reception quality to make the figures more readable.
IV. EXPERIMENTALRESULTS
Packet Reception Rate (PRR) is a key metric that measures the reliability of transmissions. Figure 2a presents PRR as a function of the frame size for CONF-A. Notice that a mandatory explicit LoRaWAN frame header of 13 bytes is added to the frame—this is why we plot the result as a function of the frame size observed at gateways.
We can notice that the PRR curves are almost flat, which demonstrates only a slight impact of PL on the frame re-ception. The important finding is the anomaly of the curves that do not tend to 1 for the frame size going to 0, which is unexpected on a wireless channel. To observe the shape of the
curves better, Figure 2b presents the same data in the log scale with a linear regression function to show the limit behavior of PRR when the frame size goes to 0. We provide more in-depth analyses of this behavior in Section V.
We also notice that the shape of PRR curves is slightly different for each gateway depending on its position as de-scribed in Table II, which strongly impacts channel quality. Moreover, although the distance that separates our mote from both Gw1 and Gw2 is almost the same, PRR of Gw1 is better then Gw2. This effect probably comes from the fact that Gw2 is outdoor on a higher altitude so it captures more traffic, which means more possibility of collisions with our packets. The marginal difference incidentally shows that there are relatively few collisions for the selected channels and SF. This conjecture is corroborated by the fact that longer frames, which are more likely to collide at some instant during their reception, are only slightly more likely to be dropped.
We ran many other configurations with different values of SF and the results were similar to CONF-A, for which PRR is only slightly impacted by PL.
Figure 3a shows PRR for CONF-B for Gw3, as a function of the frame size for TP = 2 dBm and TP = 10 dBm, and Figure 3b presents PRR as a function of the frame size for all gateways when TP = 10 dBm. We observe the same behavior—only a slight impact of the payload length on PRR: when we increase TP, PRR increases, but it keeps the same almost flat shape.
V. ANALYSIS OFPRR ANOMALY
In general, on wireless channels, Packet Reception Rate PRR is a function of Bit Error Rate BER and packet length PL:
PRR = (1 BER)PL. (1) When the PL value approaches 0, PRR increases to 1. We would therefore expect that the PRR value of each gateway starts close to 1 and then drops when PL increases. However,
20 40 60 80 100 120
Frame size (bytes)
0.0 0.2 0.4 0.6 0.8 1.0 Pa ck et R ec ep ti on R at io TP = 2 dBm TP = 10 dBm (a) 20 40 60 80 100 120
Frame size (bytes)
0.0 0.2 0.4 0.6 0.8 1.0 Pa cket R ec ep ti o n R a ti o Gw1 Gw2 Gw3 Gw4 Gw5 Gw6 Gw7 Gw8 (b)
Figure 3: a) PRR vs. frame size for Gw3. b) PRR vs. frame size, TP = 10 dBm, SF9.
t f f0-BW/2 f0+BW/2 N/BW Data f0, ∆t A => B => ∆t Preamble Receiver:
2 inverted chirps + 1/4 symbol
Sender:
8 upchirps
Figure 4: Receiver synchronization with preamble.
our results shown in all figures strongly differ from this expected theoretical PRR dependence on the packet size.
To investigate further the effect, we propose to introduce an extra multiplicative factor that represents its impact on PRR in addition to SNR, PL, and SF through probability Ps, which accounts for the uncertainty of successfully initiating the reception. To this goal, we apply the log function on the PRR formula. Since the majority of the curves are linear, we perform linear regression:
log(PRR) = PL ⇥ log(1 BER) + log(Ps). (2)
When we vary the payload of the LoRa packets between 0 and 120 bytes, the frame size changes from 13 to 133 bytes because of an additional 13 byte overhead corresponding to the mandatory LoRaWAN header. By extending the regres-sion function to the payload size of 0, we obtain the value characterizing the multiplicative factor as shown in Figure 2. Successful reception of a frame mainly depends on three conditions: i) absence of collisions, ii) preamble detection and time synchronization with the gateway, and iii) valid decoding. Assuming low traffic, so rare collisions, we investigate the effects of channel variability on packet reception.
A. Preamble detection and time synchronization
To correctly receive a frame, the gateway should first detect the frame preamble and synchronize the reception process. As the CSS modulation is sensitive to synchronization issues between the transmitted packet and the reception process at the gateway, errors may occur during the preamble detection process. If the preamble is not correctly detected by the receiver, the complete frame is lost.
Figure 4 illustrates the process of receiver synchronization: a sender transmits a preamble of 8 upchirps followed by 2 inverted chirps (downchirps) and 1/4 of a symbol. The receiver multiplies the upchirps by downchirps so it can find two unknown variables: precise transmitter frequency f0 and relative time reference t between the sender and the receiver, to decode correctly further symbols that encode data. If the synchronization process fails, the receiver cannot receive the frame. Note that for low values of SF (e.g., SF7), chirps are short and they double their duration for each increment of SF. So, the synchronization process is more fragile for SF7 and becomes more reliable for larger SF.
B. Channel attenuation
To characterize further Ps, we ran experiments in the CONF-C configuration in which we varied the frame size cyclically and alternated between SF 7, 9, and 11 for two
20 30 40 50 60 Frame size (bytes)
0.0 0.2 0.4 0.6 0.8 1.0 Pa cket R ec ep ti o n R a ti o Gw1 Gw6 SF7 SF9 SF11
Figure 5: Gw1 and Gw6: PRR as a function of the frame size for several SF. 7 9 11 SF 0.0 0.2 0.4 0.6 0.8 1.0 Ps Gw1 Gw2 Gw3 Gw5 Gw6 Gw8 Gw13 Figure 6: Psas a function of SF.
weeks. Then, we determined Ps for each gateway and each SF with the following method:
• for each couple (Gwi, SF), we plot PRR vs. frame size like in Figure 5 (we give the data for Gw1 and Gw6 as an example, we skip other Gwi due to the lack of space). • we apply log(PRR) and perform the linear regression to obtain the value of log(Ps)for PL= 0 for each pair (Gwi, SF).
Figure 6 presents the data for Ps in function of SF for gateways 1 to 3, 5, 6, 8, and 13 (they are seven gateways that receive packets for three configured values of SF: 7, 9, and 11). We can notice in this figure that, as expected, Ps depends on SF: Ps increases for larger SF. Nevertheless, the improvement is relatively limited between SF9 and SF11: there is no threshold SF (or transmission power) above which PRR would notably raise. This behavior bears similarity with what is expected for a slowly varying Rayleigh channel.
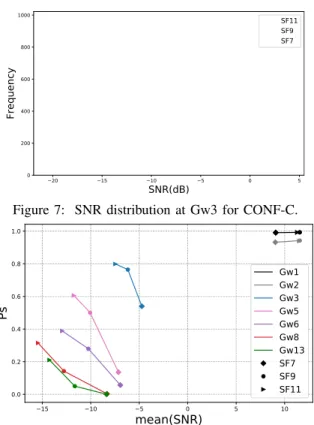
So, we represent in Figure 7 the measured SNR distribu-tions. We can observe that they closely follow the distribution of the Rayleigh channel gains for SF11. For smaller SFs, the distribution is truncated to the left because the corresponding packets are simply not received. In essence, each transmission faces an exponentially distributed Rayleigh channel gain, which remains mostly constant during the transmission.
Figure 8 presents Ps as a function of mean SNR for each
Figure 7: SNR distribution at Gw3 for CONF-C.
15 10 5 0 5 10 mean(SNR) 0.0 0.2 0.4 0.6 0.8 1.0 Ps Gw1 Gw2 Gw3 Gw5 Gw6 Gw8 Gw13 SF7 SF9 SF11
Figure 8: Ps as a function of mean SNR.
couple (Gwi, SF). To understand the curves, we need to explain how we compute mean SNR—it is the mean of the SNR values computed for all received packets at each SF so it does not take into account the packets that are lost. Mean SNR grows for smaller SF, since only the packets with higher SNR are effectively received for less robust modulations, whereas for greater SF, the packets with smaller SNR are included in the mean. For instance, mean SNR for Gw13 is computed only on a small fraction of packets that made it through.
In the figure, we do not observe a clear relationship between measured SNR and SF to use: there is approximately 5 dB of SNR difference between Gw3 and Gw5, which should theoretically be compensated by using SF11 instead of SF9, as each SF step brings 2.5 dB of the coding gain. This is what we see with similar PRR between Gw5 at SF9 and Gw3 at SF7. However, at SF11, Gw5 is still well below PRR of Gw3 at SF9. In other words, PRR reaches a plateau above which switching to higher SF brings little improvement.
PRR at Gw6 stands out: it is below the general PRR vs. SNR trend. This gateway also shows an unusual behavior in Figure 2 with even less influence of the packet size than the other gateways. We have not identified the reason that makes this gateway special, but the investigation into its behavior helped us to identify the limiting factor for PRR.
VI. RELATEDWORK
Several authors experimentally evaluated LoRa performance with the focus on different parameters, types of hardware, and various network characteristics. Augustin et al. [7] measured
LoRa packet loss rate on a LoRa testbed showing: i) less than 10% of loss rate over a distance of 2 km for SF 9-12 and ii) more than 60% of loss rate over 3.4 km for SF12.
Haxhibeqiri et al. [9] studied LoRa scalability. Their sim-ulation model based on the measurements of the interference behavior between two nodes shows that when the number of nodes with the duty cycle of 1% increases to 1000 per gateway, the loss ratio increases to 32%, which is low compared to 90% in pure ALOHA for the same load. This difference comes from taking into account the capture effect.
Petri´c et al. [11] observed a highly variable packet error rate (between 3% and 90%) for the range of 3 km from a gateway under the following conditions: bandwidth of 125 kHz, coding rate of 4/5, transmission power of 14 dBm, and spreading factor SF 7, 9, and 11.
Mikhaylov et al. [13] studied the variation of the payload length, however, in a synthetic setup based on motes connected by cables and involving an artificial interferer, therefore, the results are not representative for real operational traffic.
Blenn et al. [14] provided statistics of the TTN traffic based on global TTN logs: number of received frames, number of gateways, number of devices etc. They reported on the probability density function of RSSI and SNR, and presented the histograms of the payload length and spreading factors. They used the observed parameter in simulations to estimate collision probability as a function of the traffic intensity.
To the best of our knowledge, our work is the first one to study the impact of the payload size on PRR measured in an operational LoRaWAN network and reveal the behavior different from other types of wireless networks. We also point out the influence of receiver synchronization on successful packet reception.
VII. CONCLUSION
In this paper, we present the results of extensive experiments in the TTN public LoRa network to evaluate the transmission quality of LoRa links by measuring PRR as a function of the payload length.
The results show that there is only a slight impact of the payload length on PRR, which means that the bit error rate due to the ambient noise at the receiver and collisions are not the only factors that impact the probability of packet reception. We find that successful reception requires effective preamble acquisition and that this step is the limiting factor: a low channel attenuation favors the initial signal acquisition and persists for the remainder of the packet. Our measurements show that the LoRa channel behaves like a slow fading Rayleigh channel, which also influences probability Ps of successful preamble reception. Our measurements of Psshow that it depends on SF and SNR, and often becomes a dominant factor of successful reception depending on the signal strength at a gateway.
These findings have important implications for the Lo-RaWAN application designer: to achieve a good level of data delivery, devices need to consider packet retransmissions because they have to cope with frame losses not only due to the ALOHA access method, but also to the channel variability.
Moreover, it is always better to group past data with new measurements and send them in long packets instead of more numerous short packets because the actual frame size has little influence on transmission reliability.
In future work, we plan to investigate a model that takes into account all factors influencing the packet reception probability, which will lead to a more realistic evaluation of the LoRaWAN cell capacity.
ACKNOWLEDGMENTS
This work has been partially supported by the French Ministry of Research project PERSYVAL-Lab under contract ANR-11-LABX-0025-01.
REFERENCES
[1] A. Berni and W. Gregg, “On the Utility of Chirp Modulation for Digital Signaling,” IEEE Trans. Commun., vol. 21, 1971.
[2] N. Sornin, “LoRaWAN 1.1 Specification,” LoRa Alliance Technical Committee, LoRa Alliance, Tech. Rep., Oct. 2017.
[3] K. Mikhaylov, J. Petäjäjärvi, and T. Hänninen, “Analysis of Capacity and Scalability of the LoRa Low Power Wide Area Network Technology,” in European Wireless Conference, May 2016, pp. 1–6.
[4] O. Georgiou and U. Raza, “Low Power Wide Area Network Analysis: Can LoRa Scale?” IEEE Wireless Commun. Letters, vol. 6, no. 2, pp. 162–165, 2017.
[5] B. Reynders, W. Meert, and S. Pollin, “Range and Coexistence Analysis of Long Range Unlicensed Communication,” in International Confer-ence on Telecommunications (ICT), Thessaloniki, Greece, May 2016, pp. 1–6.
[6] M. Bor, J. Vidler, and U. Roedig, “LoRa for the Internet of Things,” in Proceedings of the 2016 International Conference on Embedded Wireless Systems and Networks, ser. EWSN ’16. USA: Junction Publishing, 2016, pp. 361–366. [Online]. Available: http://dl.acm.org/citation.cfm?id=2893711.2893802
[7] A. Augustin, J. Yi, T. H. Clausen, and W. M. Townsley, “A Study of LoRa: Long Range & Low Power Networks for the Internet of Things,” Sensors, vol. 16, no. 9, p. 1466, 2016.
[8] F. Adelantado, X. Vilajosana, P. Tuset-Peiró, B. Martínez, J. Melià-Seguí, and T. Watteyne, “Understanding the Limits of LoRaWAN,” IEEE Communications Magazine, vol. 55, no. 9, pp. 34–40, 2017. [9] J. Haxhibeqiri, F. V. D. Abeele, I. Moerman, and J. Hoebeke, “LoRa
Scalability: A Simulation Model Based on Interference Measurements,” Sensors, vol. 17, no. 6, p. 1193, 2017.
[10] T.-H. To and A. Duda, “Simulation of LoRa in NS-3: Improving LoRa Performance with CSMA,” in IEEE ICC, Kansas City, USA, 2018. [11] T. Petri´c, M. Goessens, L. Nuaymi, L. Toutain, and A. Pelov,
“Mea-surements, Performance and Analysis of LoRa FABIAN, a Real-World Implementation of LPWAN,” in IEEE PIMRC, Sept 2016, pp. 1–7. [12] M. C. Bor and U. Roedig, “LoRa Transmission Parameter Selection,”
in ACM DCOSS, Ottawa, ON, Canada, 2017, pp. 27–34.
[13] K. Mikhaylov, J. Petäjäjärvi, and J. Janhunen, “On LoRaWAN Scala-bility: Empirical Evaluation of Susceptibility to Inter-Network Interfer-ence,” in 2017 European Conference on Networks and Communications (EuCNC), June 2017.
[14] N. Blenn and F. A. Kuipers, “LoRaWAN in the Wild: Measurements from The Things Network,” CoRR, vol. abs/1706.03086, 2017. [Online]. Available: http://arxiv.org/abs/1706.03086
[15] Q. Lone, E. Dublé, F. Rousseau, I. Moerman, S. Giannoulis, and A. Duda, “WiSH-WalT: A Framework for Controllable and Reproducible LoRa Testbeds,” in IEEE PIMRC, Bologna, Italy, Sep. 2018. [Online]. Available: https://hal.archives-ouvertes.fr/hal-01835904 [16] W. Giezeman and J. Stokking, “The Things Network.” [Online].
Available: https://www.thethingsnetwork.org
[17] Semtech, “SX1272/73 - 860 MHz to 1020 MHz Low Power Long Range Transceiver,” 2017. [Online]. Available: https://www.semtech. com/uploads/documents/sx1272.pdf
[18] A. Kochut, A. Vasan, A. U. Shankar, and A. K. Agrawala, “Sniffing Out the Correct Physical Layer Capture Model in 802.11b,” in IEEE ICNP, Berlin, Germany, 2004, pp. 252–261.