HAL Id: tel-00084812
https://tel.archives-ouvertes.fr/tel-00084812
Submitted on 10 Jul 2006
HAL is a multi-disciplinary open access archive for the deposit and dissemination of sci-entific research documents, whether they are pub-lished or not. The documents may come from teaching and research institutions in France or abroad, or from public or private research centers.
L’archive ouverte pluridisciplinaire HAL, est destinée au dépôt et à la diffusion de documents scientifiques de niveau recherche, publiés ou non, émanant des établissements d’enseignement et de recherche français ou étrangers, des laboratoires publics ou privés.
animal par spectroscopie RMN in vivo, application à la
maladie de Parkinson
Nils Kickler
To cite this version:
Nils Kickler. Mesure de glutamate cérébral chez l’homme et le petit animal par spectroscopie RMN in vivo, application à la maladie de Parkinson. Biological Physics [physics.bio-ph]. Université Joseph-Fourier - Grenoble I, 2006. English. �tel-00084812�
présentée par
Nils Kickler
pour obtenir le titre de
Docteur de l’Université Joseph Fourier – Grenoble 1
(Arrêtés ministériels du 5 juillet 1984 et du 30 mars 1992)
Spécialité: Physique
Mesure de glutamate cérébral chez l’homme et
le petit animal par spectroscopie RMN in vivo,
application à la maladie de Parkinson
soutenue le 30 juin 2006
Jury
M. von Kienlin
Rapporteur
F. Durif
Rapporteur
C. Segebarth
Directeur de thèse
C. Feuerstein
Examinateur
C. Roby
Examinateur
V. Lebon
Examinateur
Thèse préparée au sein du laboratoire INSERM U594 Neuroimagerie fonctionnelle et métabolique, Grenoble
J’aimerais utiliser cette première page pour remercier tous ceux qui m’ont aidé et accompagné au cours de ces trois dernières années de thèse.
Sans l’énorme soutien de Christoph Segebarth, en tant que directeur de thèse, et de
Chantal Rémy, ce travail n’aurait certainement pas été terminé à ce jour. Je tiens à
vous remercier pour votre encouragement, votre patience, vos discussions et corrections, pour l’ensemble de la direction d’un projet que vous avez repris. J’aimerais de même exprimer mon estimation pour Anne Ziegler, avec qui le travail commun était d’un grand bénéfice pour moi en ce qui concerne l’apprentissage de la RMN, mais aussi en ce qui concerne le plan personnel.
Ensemble, mais surtout avec l’aide et la grande patience de Laurent Lamalle, le travail sur notre imageur corps entier 3T était un vrai plaisir, révélant un appareil fascinant. Je voudrais remercier Laurent également pour sa grande disponibilité.
Les questions de la biologie et de la médicine rencontrées au cours de cette thèse m’inspirent une grande fascination et j’aimerais remercier chaleureusement tous ceux qui m’ont permis d’apprendre un tout petit peu de leur domaine de compétence.
Jonathan Coles n’a jamais hésité d’abandonner son ordinateur pour se lancer dans des
discussions sur la biologie qui étaient certainement basiques pour lui, mais d’un mystère pour moi. Du département de neurologie du CHU de Grenoble je tiens à remercier les professeurs Pierre Pollak et Paul Krack ainsi que Valérie Fraix, avec qui l’étude chez le patient Parkinsonien a été réalisée et qui m’ont permis au cours de ce travail d’apprendre des notions de cette maladie. Egalement, je voudrais remercier leurs patients dont la volonté de participer à notre étude et l’intérêt m’ont inspiré un grand respect. Il n’aurait pas été possible de réaliser nos mesures sans le grand soutien du professeur Jean-François LeBas et son équipe du service d’imagerie du CHU de Grenoble, auxquelles je voudrais également adresser mes remerciements.
L’étude sur le petit animal a été réalisée en coopération avec l’équipe de Marc Savasta, directeur de l’INSERM U704, et avec Emilie Lacombe, qui étaient responsables de tous les aspects « modèle animal ». Régine Farion et Emmanuelle Grillon assuraient la préparation des animaux pour les examens RMN. Les mesures sur les extraits PCA ont été réalisées au sein de l’équipe du professeur Franck Durif à l’INRA de Clermont-Ferrand, par Carine Chassain, et j’aimerais leur adresser mes remerciements ainsi que à nos partenaires de l’U704.
Alexandre Krainik était d’une énorme aide pendant l’évaluation des données, surtout
de celles issues de l’étude sur le petit animal, et m’a ainsi « débloqué » plus qu’une fois. De même, je voudrais remercier Roger Dupeyre pour son soutien tout au long de cette thèse, surtout en ce qui concerne la spectroscopie RMN. Je ne saurais plus les répéter, mais j’aimerais remercier Peggy Provent pour son support lors d’à peu près une million
d’occasions, commencé par la commande de produits et allant jusqu’aux manips de RMN in vivo. Merci pour trois ans de collégialité et cordialité ! Sans doute, le bureau de Peggy avec ses autres « habitants », Emmanuel Barbier, Olivier Detante, Samuel
Valable et Aktham Asfour, était une source constante de réponses et d’inspiration. Et
même si son bureau se trouvait plus loin, je ne voudrais pas oublier tout le soutien d’Alban Caporossi avec le domptage de notre parc informatique. Encore un grand merci à mes collègues de bureau, Boudewijn van der Sanden et Hervé Mathieu, pour leur support moral et une agréable « collocation » au cours de la dernière année de thèse !
Si cette thèse présente une mise en page acceptable, c’est aussi le mérite de notre secrétaire Marie-Claude Zanoni et sa maîtrise de microsoft word.
Permettez-moi à la fin encore un dernier remerciement : J’aimerais remercier ma mère et son marie qui non pas seulement pendant ces trois derniers années mais pendant bien plus longtemps sont un soutien dans toutes les situations de la vie.
Enfin, merci beaucoup à vous tous, aussi à celles et à ceux que je n’ai pas nommé dans ce texte, cette thèse est issue d’un véritable travail d’équipe !
REMERCIEMENTS ... 3
1 INTRODUCTION ... 7
1.1 GENERAL INTRODUCTION (ENGLISH AND FRENCH) ... 7
1.2 BRAIN GLUTAMATE MEASUREMENT USING PROTON MAGNETIC RESONANCE SPECTROSCOPY.... 9
1.3 BRAIN GLUTAMATE MEASUREMENT IN RESEARCH ON PARKINSON’S DISEASE... 14
2 A LOCALIZED DOUBLE QUANTUM FILTER (DQF) SEQUENCE FOR BRAIN GLUTAMATE DETECTION AT 3 TESLA ... 19
2.1 INTRODUCTION TO DOUBLE QUANTUM FILTERING... 19
2.2 SEQUENCE DESIGN OF A DOUBLE QUANTUM FILTER FOR IN VIVO APPLICATIONS... 23
2.3 IMPLEMENTATION OF A DQF SEQUENCE ON A 3T WHOLE BODY IMAGER... 24
2.3.1 Radiofrequency pulses ... 24
2.3.2 Water suppression... 26
2.3.3 Voxel positioning and phase calibration... 29
2.3.4 Sequence design – Summary ... 33
2.4 EXPERIMENTAL VALIDATION OF A DQF SEQUENCE ON A 3T WHOLE BODY IMAGER... 34
2.4.1 Validation of the phase calibration procedure ... 34
2.4.2 Experiments on metabolites in solution ... 39
2.4.3 In vivo application ... 41
2.5 CONCLUSION AND PERSPECTIVES... 47
3 TE AVERAGED PRESS FOR BRAIN GLUTAMATE DETECTION AT 3 TESLA ... 49
3.1 INTRODUCTION... 49
3.2 EXPERIMENTS ON METABOLITES IN SOLUTION... 50
3.2.1 Materials and methods... 50
3.2.2 Results ... 51
3.2.3 Discussion ... 53
3.3 IN VIVO APPLICATION... 54
3.3.1 Materials and methods... 54
3.3.2 Results ... 55
3.3.3 Discussion ... 59
3.4 CONCLUSION AND PERSPECTIVES... 59
4 TE AVERAGED PRESS AND PRESS FOR BRAIN GLUTAMATE DETECTION AT 7 TESLA ... 61
4.1 INTRODUCTION... 61
4.2 EXPERIMENTS ON METABOLITES IN SOLUTION AND IN VIVO... 62
4.2.1 Materials and methods in vitro experiments ... 62
4.2.3 Materials and methods in vivo experiments ... 68
4.2.4 Results of in vivo experiments ... 68
4.2.5 Discussion in vitro and in vivo experiments... 69
4.3 CONCLUSION... 70
5 STUDY OF GLUTAMATE LEVELS IN HUMAN PARKINSON’S DISEASE ... 71
5.1 INTRODUCTION... 71
5.2 PATIENTS AND METHODS... 72
5.3 RESULTS... 75
5.4 DISCUSSION... 81
5.5 CONCLUSION AND PERSPECTIVES... 83
6 STUDY OF GLUTAMATE LEVELS IN A 6-OHDA RAT MODEL OF PARKINSON’S DISEASE ... 85
6.1 INTRODUCTION... 85
6.2 MATERIALS AND METHODS... 87
6.2.1 Experimental procedure... 87
6.2.2 In vivo MRS ... 89
6.2.3 Postprocessing of in vivo spectra ... 91
6.2.4 In vitro MRS ... 92
6.2.5 Postprocessing of in vitro spectra ... 92
6.2.6 Statistics ... 93
6.3 RESULTS... 93
6.4 DISCUSSION... 107
6.5 CONCLUSION AND PERSPECTIVES... 109
7 GENERAL CONCLUSION AND PERSPECTIVES (ENGLISH AND FRENCH)... 111
8 ANNEX... 115
8.1 CHEMICAL SHIFTS AND COUPLING CONSTANTS OF SOME BRAIN METABOLITES... 115
8.2 METABOLITE CONCENTRATIONS IN THE RAT BRAIN:LITERATURE VALUES... 117
8.3 TE AVERAGED PRESS AT 7TESLA:NUMERICAL SIMULATIONS... 118
8.3.1 Materials and Methods... 118
8.3.2 Results ... 119
8.3.3 Discussion ... 121
8.4 PRESS AT 7TESLA AND AN ECHO TIME OF 136 MS:EXPERIMENTS ON METABOLITES IN SOLUTION... 122
8.4.1 Materials and methods ... 122
8.4.2 Results ... 122
8.4.3 Discussion ... 123
1.1
General introduction (English and French)
Français
La résonance magnétique nucléaire (RMN) constitue de nos jours l’un des outils les plus importants pour l’étude de systèmes biologiques. Utilisée in vitro, les applications les plus courantes concernent les analyses biochimiques et la détermination de la structure et du dynamique de grandes molécules biologiques comme les protéines. Au cours des dernières vingt années, l’imagerie par résonance magnétique est devenue un outil de routine, tant dans la pratique clinique que dans la recherche médicale et biomédicale, offrant un contraste supérieur entre différents tissus mols sans recours aux radiations ionisantes. La spectroscopie par résonance magnétique a été appliquée in vivo dès les premiers jours, mais ce n’est que depuis les années 1980 avec la mise en place des bobines de surface que des techniques optimisées pour une pareille utilisation ont été développées. La mise en place de techniques de localisation du signal et des progrès concernant la suppression du signal de l’eau en spectroscopie du proton (1H) ont permis d’obtenir une multitude d’informations spectroscopiques, par exemple, concernant le métabolisme énergétique du cerveau ou concernant les acides aminées.
Les signaux de lactate, n-acetylaspartate, créatine et choline sont facilement observés dans des spectres du proton acquis sur le cerveau. La mesure de la plupart des autres molécules présentes dans le cerveau est rendue difficile du fait de leur signature spectrale compliquée, par l’importante largeur des raies habituellement observée in vivo et par la présence d’un grand nombre de raies dans une petite largeur spectrale. Ainsi, l’observation du neurotransmetteur glutamate dans des spectres RMN reste difficile malgré sa concentration relativement élevée qui est de l’ordre de 10 mM dans le cerveau humain. La détection de glutamate, l’un des neurotransmetteurs les plus importants du cerveau humain, présente pourtant un grand intérêt, d’autant de plus qu’il est impliqué dans certaines maladies neurodégénératives, comme la maladie de Parkinson.
Le but du présent travail était la mise en place de techniques de spectroscopie RMN permettant la détection de glutamate chez l’homme et le petit animal et l’évaluation de leur potentiel dans le cadre de la recherche sur la maladie de Parkinson.
La suite de ce premier chapitre situe la mesure du glutamate dans le contexte de la méthodologie RMN et dans celui de la recherche sur la maladie de Parkinson. Pour des applications chez l’homme à 3 Tesla, une technique de filtrage à double quanta ainsi qu’une méthode liée à la spectroscopie bidimensionnelle ont été mises en place. L’évaluation de ces techniques est décrite dans les chapitres 2 et 3. La méthode basée
sur la spectroscopie bidimensionnelle a ensuite été comparée à des techniques PRESS conventionnelles à 7 Tesla pour des applications sur le petit animal, voir chapitre 4. Les chapitres 5 et 6 présentent les résultats de deux études faites chez le patient Parkinsonien et sur le modèle animal de cette maladie pour évaluer la possibilité de mesurer des changements pathologiques des concentrations de glutamate.
English
Nuclear magnetic resonance techniques present today one of the most important tools for studies of biological systems. In vitro, common applications of magnetic resonance spectroscopy (MRS) concern biochemical analysis as well as the determination of structure and dynamics of large biomolecules such as proteins. During the last two decades, magnetic resonance imaging has developed to a routine tool for medical diagnosis and fundamental research, providing high soft tissue contrast without requiring ionizing radiation. Magnetic resonance spectroscopy has been applied in vivo from the early beginning of NMR, but dedicated techniques for in vivo MRS were not developed until the 1980s after surface coils had been set up. Especially mono- or multi-voxel localization techniques, using magnetic field gradients, as well as advancements concerning water suppression in proton (1H) spectroscopy, have permitted in vivo MRS to provide a wealth of non-invasive spectroscopic information on, for example, energy metabolism and amino acids.
Signals of lactate, n-acetylaspartate, creatine and choline containing compounds are easily observed in in vivo 1H spectra of brain structures. Detection of other brain metabolites presents difficulties, mainly due to complicated spectral signatures and large linewidths in vivo. The neurotransmitter glutamate is present at relatively high concentration in the human brain (about 10 mM) but figures among the metabolites that are not readily observable. As one of the principal neurotransmitters in the brain, its detection in vivo is however of high interest in many pathologies, such as Parkinson’s disease (PD). Abnormal activation of glutamate systems in the basal ganglia has been recognized to play a central role in the pathophysiology of this disease.
In the present work, we aimed at evaluating the potential of in vivo magnetic resonance spectroscopy for the detection of brain glutamate and examine the utility of such measurements for research on Parkinson’s disease. The following sections of this first chapter situate the detection of brain glutamate within the methodological context of magnetic resonance spectroscopy and within the medical context of Parkinson’s disease. For application in a clinical context, a double quantum filter technique and a technique related to two dimensional MRS were evaluated for glutamate detection at three Tesla field strengths. Results of this methodological evaluation are presented in chapters 2 and 3. The method based on two-dimensional spectroscopy was then examined for use at higher field strengths (7 Tesla) for research applications in a biomedical context and compared to a standard (PRESS) technique (chapter 4). To investigate the possibility to detect pathological abnormalities of glutamate concentrations in Parkinson’s disease,
MRS was applied to measurements on patients affected by Parkinson’s disease (chapter 5) and to a rat animal model (chapter 6) of PD.
1.2
Brain glutamate measurement using proton magnetic
resonance spectroscopy
Proton NMR spectra of the mammalian brain present high information content, as 1H atoms, of which the magnetic resonance signal is used, are present in almost every brain metabolite. At the same time, because of the small chemical shift range of the proton, the abundance of signals leads to strong overlap between peaks of different molecules and thereby to serious problems of analytical discrimination. At least 35 different brain metabolites give rise to multiple resonances in a spectral range of only 2.4 ppm (Govindaraju, Young et al. 2000). Standard techniques as PRESS or STEAM readily allow the identification of resonances of n-acetylaspartate (NAA) and of choline (cho) and creatine (cr) containing compounds at field strengths of 1.5 T. The identification and quantification of other metabolite resonances often requires a more sophisticated approach. When trying to obtain information about the less concentrated metabolites, which very often present strongly coupled spins giving rise to complicated multiplett structures, three broad options are available in vivo:
The most straightforward method to reduce or even eliminate spectral overlap is to increase the magnetic field strength. Higher frequency dispersions due to chemical shift together with higher sensitivity and reduced strong coupling effects increase significantly the number of identifiable metabolites. In combination with very short echo times of about 2 ms, up to 18 molecules can be identified in vivo (Pfeuffer, Tkac et al. 1999). High field magnets (7 to 9.4 Tesla) for in vivo NMR applications are however very expensive and only very few machines for human applications exist to this day. Full gain in spectral quality may only be obtained if increased susceptibility differences, caused by increased field strengths, are compensated by optimized shimming, as can be achieved for example using the FASTMAP procedure (Gruetter 1993). Strong shimming coil systems, allowing adjustment of at least second order terms, are needed, which until recently were only available as custom made fabrications. Implementation and use of short echo time techniques furthermore demands effective water and macromolecule suppression and precise calibration of the gradient coil system to prevent contamination by eddy currents. In summary, next to high field strengths this approach demands strong gradient coil systems and extensive machine calibrations. Another approach consists in the acquisition of more information by way of a two-dimensional spectrum (Ziegler, Izquierdo et al. 1995). Some signals of coupled spins overlapping in normal one dimensional spectra become resolved in the second dimension of a 2D spectrum. The acquisition of a two dimensional spectrum is however time consuming, as the second spectral dimension, comparable to the second spatial dimension of an image, is obtained following repeated acquisitions with a parameter varied within the sequence.
Spectral editing techniques that utilize differences in scalar coupling present a third approach. The information content of the one dimensional spectrum is reduced so as to observe only a single spectral shape from a single metabolite ((Shen, Rothman et al. 2002) for example). As usually only one metabolite is targeted, phasing and quantification of an edited spectrum is difficult due to lack of a reference signal. Quantification may for example be achieved using the (singlet-) signal of an unedited reference spectrum acquired from the same region. Phasing problems may be circumvented by evaluating the spectrum in magnitude mode or by comparison to a simulated spectrum. The major drawback of many editing approaches is however their overall signal loss. As a part of this work concerns double quantum filtered editing, further details are discussed in the next chapter.
Together with all approaches of signal acquisition, identification of overlapping resonances is further improved by use of adapted quantification methods.
In some cases, resonance lines may be approximated by Lorentzian peakshapes; these can be fitted directly to the spectrum. Related approaches, instead of working in the spectral domain, rely on adjusting exponentially decaying functions in the time domain (Vanhamme, van den Boogaart et al. 1997). Prior knowledge, such as peak positions and frequency spacing between peaks, may be incorporated in the fitting routine and improve its reliability.
Instead of fitting Lorentzian peakshapes to each resonance line observed, it is also possible to adjust complete spectra of individual metabolites to the in vivo spectrum (Provencher 1993). The model spectra may be obtained from simulations or from in
vitro solutions. Complicated, non-Lorentzian spectral shapes can be evaluated and it is possible to resolve complex spectral pattern (Pfeuffer, Tkac et al. 1999). This approach is laborious, as model spectra using exactly the same parameters as for the acquisition in
vivo have to be produced for all metabolites.
The task of glutamate measurement is part of the general challenge to gain information about coupled brain metabolites. Glutamate presents five coupled 1H spins, resonating at 3.7 ppm and in a small region near 2.3 ppm. The molecule and its chemical shifts are displayed in Fig. 1.1, together with the molecules of glutamine, NAA and GABA. In usual in vivo spectra, the glutamate signal overlaps strongly with the signals of glutamine, γ-aminobutyric acid (GABA) and the aspartate moiety of NAA (Govindaraju, Young et al. 2000). Fig. 1.2 shows a high resolution spectrum acquired from a PCA extract of a rat brain to demonstrate the proximity of resonances in the spectral area at 2.3 ppm (reproduced from (Govindaraju, Young et al. 2000)).
Fig. 1.1: Molecular structure of n-acetylaspartate (NAA), gamma aminobutyric acid (GABA), glutamate and glutamine. In the targeted chemical shift range for in vivo glutamate measurement, near 2.3 ppm, the resonance lines of these four molecules overlap. Chemical shifts were taken from (Govindaraju, Young et al. 2000). Protons marked by an asterix are in rapid exchange with water.
Fig. 1.2: High resolution 1H spectrum of a PCA extract from a rat brain obtained at 600 MHz (dashed line) and results of spectral analysis (solid line). The vertical scale has been increased, resulting in truncation of the NAA singlet resonance. Figure reproduced from (Govindaraju, Young et al. 2000).
Efforts to measure glutamate unobstructed from contributions of other metabolites usually target the chemical shift range near 2.3 ppm, because glutamate overlaps inseparably with glutamine at 3.7 ppm. The challenge of glutamate measurement stems from four principal difficulties.
First, the spectral pattern of glutamate in the 2.3 ppm region is highly complicated and analytically difficult to predict because of strong coupling effects at most field strengths that are available for in vivo experiments. At 3 Tesla, all spin groups resonating in the 2.3 ppm region have to be considered as strongly coupled, as can be seen in Table 8.1, annex. At 7 T, most spin groups are at the limit where strong coupling effects may be neglected.
A second difficulty is the low intensity of glutamate pattern in vivo. As the signal intensity is split on a multitude of peaks (see (Govindaraju, Basus et al. 1998), the signal amplitude of each peak remains low in spite of the relatively high glutamate concentration in the human brain (6 mmol/kgww to 12 mmol/kgww). The spectrum shown
in Fig. 1.2 has been acquired at a field strength, where glutamate, glutamine, NAA and GABA may be described as weakly coupled system. At 2.15 ppm and 2.35 ppm, the numerous peaks of glutamate are well visible. The maximal amplitude of glutamate remains far below the amplitude of the (cropped) NAA singlet at 2.0 ppm. NAA is present in the rat brain in concentrations of about 9 mmol/kgww.
Glutamate and glutamine present a highly similar molecular structure, leading to almost equal chemical shifts and coupling constants in the proton spin groups of both metabolites. Separating glutamate from glutamine presents a third major difficulty. The spin groups of glutamine, NAA and GABA giving rise to resonances in the targeted chemical shift range for glutamate measurements, near 2.3 ppm, present strong coupling features themselves, complicating further all approaches for glutamate measurement. At 3 Tesla field strength the respective spin groups have to be considered strongly coupled, as for glutamate. At 7 Tesla, glutamine (as glutamate) is at the limit to weak coupling behavior for most of its spins. GABA may be considered weakly coupled, but the two spins of NAA present in the targeted chemical shift range, resonating at 2.5 ppm and 2.7 ppm, remain strongly coupled.
Several studies concerning glutamate measurement may be found in the literature. A very successful approach combines high fields (7 T, 9.4 T), short echo time (2 ms to 6 ms) and high performance shimming (FASTMAP, (Gruetter 1993)) and uses a fit of model spectra (LC model, (Provencher 1993)) for quantification (Pfeuffer, Tkac et al. 1999; Tkac, Andersen et al. 2001). Glutamate and glutamine may be resolved from each other and from the resonances of NAA and GABA and can be quantified by this technically and instrumentally highly demanding technique.
At lower field strengths, at 3 Tesla, short echo time spectra do not display a visually distinguishable glutamate signal (Zhong and Ernst 2004). In this case, some authors propose to rely on fitting procedures, fitting model spectra to the in vivo spectrum, in
order to obtain information about glutamate concentrations (Boumezbeur, Besret et al. 2005; Jang, Lee et al. 2005).
At these field strengths, editing techniques present another promising approach. Double quantum filter sequences and J-refocused (Lee, Yaman et al. 1995) spectral editing techniques have been applied to in vivo glutamate measurement at 3 Tesla (Thompson and Allen 1998; Schubert F 2001) and 4.1 Tesla (Pan, Mason et al. 1996) field strengths. Double quantum filtering will be further detailed in the following chapter. J-refocused editing relies on suppression of J-coupling evolution, assuring that spectra acquired at different echo times present similar spectral shapes for coupled spin systems (for details, see (Lee, Yaman et al. 1995; Pan, Mason et al. 1996)). Glutamate and glutamine have shorter transverse relaxation times than the other metabolites as NAA, creatine and GABA. Glutamate (glu) and glutamine (gln) can therefore be differentiated from the other metabolites using their T2 relaxation rate: Two measurements with
different TE values are performed and subtracted in the J-refocused editing technique. The difference spectrum contains mainly glutamate and glutamine, whereas other metabolites are reduced by subtraction.
Only recently, two-dimensional spectroscopy techniques have been successfully applied to glutamate measurement at 3 Tesla field strengths. These techniques rely on J-resolved acquisitions (Hurd, Sailasuta et al. 2004) or constant time PRESS (CT-PRESS) (Mayer and Spielman 2005; Schulte, Trabesinger et al. 2005) sequences, that have been optimized for glutamate detection. Not the whole two dimensional spectrum is used for evaluation but only one dimensional cuts, fixing one of the two frequency dimensions. For example, TE averaged PRESS uses the central trace of a 2D spectrum (f1 = 0).
J-resolved acquisitions of this type will be described in a later chapter. CT-PRESS uses signal preparation as PRESS. Spectra with different echo times are acquired; the acquisition window starts however always at a fixed delay after the first PRESS excitation pulse. The different spectra display identical J coupling evolutions but differing chemical shift evolutions. A Fourier transformation as a function of the echo time therefore gives a two dimensional spectrum where the usual frequency domain contains J and chemical shift information, the additional dimension, corresponding to the echo time, however displays only chemical shift information. After optimization of the sequence parameters, spectra displaying a glutamate signal almost free of contamination by other metabolites can be acquired (Mayer and Spielman 2005). The present work concerns glutamate measurement at low field (3 T) in a clinical environment and at high field (7 T) for biomedical research. In the clinical environment, we have first followed an editing and later a 2D approach for glutamate measurement. At high field, satisfactory results for biomedical research were obtained with a standard point resolved spectroscopy (PRESS) method.
1.3
Brain glutamate measurement in research on
Parkinson’s disease
Parkinson’s disease (PD) was first described by James Parkinson in the year 1817 as a single disease entity. PD is a chronic, progressive neurodegenerative brain disease, afflicting about 1 in 1000 persons of the population and about 1 in 100 persons older than 60 years. Principal clinical symptoms are tremor, rigidity and akinesia (loss or impairment of voluntary activity, as of a muscle). Between 15 and 30 % of the patients develop psychological problems as depression or dementia in an advanced disease state. Eighty percent of all patients suffer from idiopathic Parkinson’s disease for which no cause is known.
Degeneration of the melanized neurons in the substantia nigra pars compacta (SNc), which contain the chemical dopamine as neurotransmitter, is one of the most important neuropathological features of Parkinson’s disease. The reduction of dopamine affects functioning of the basal ganglia, implied in the control of movement. A model of the functional organization of the basal ganglia and alterations in the case of Parkinson’s disease is shown in Fig. 1.3 (Obeso, Rodriguez-Oroz et al. 2000). Fig. 1.4 and Fig. 1.5 situate the implied brain structures in the human and in the rat brain. In this (simplified) model, the putamen is the “input” structure, receiving inhibitory projections (blue) from the cortical areas implied in movement control. In a more developed model of the same reference (Obeso, Rodriguez-Oroz et al. 2000), these projections are assumed as excitatory. The “output” structure are the internal segment of the globus pallidus (GPi) and the reticular part of the substantia nigra (SNr). These send inhibitory projections to the ventral anterior – ventral lateral thalamus (VL), which send back excitatory (red) projections to the cortical motor areas. Input and output structures are connected via two pathways, the direct pathway, projecting from putamen to GPi and SNr and the indirect pathway. The indirect pathway links the putamen with the “output structure” via projections to the external part of the globus pallidus (GPe) and from there to the subthalamic nucleus (STN). The arrangement of excitatory and inhibitory projections is such that stimulation of the direct pathway facilitates thalamocortical excitatory activity and stimulation of the indirect pathway exerts an inhibition. The role of nigrostriatal dopamine is to balance these two functionally opposing systems. Different dopamine receptors, D1 and D2, of the neurons projecting to GPe (D2) and GPi (D1) from the putamen make that dopamine enhances the activity of the direct pathway and inhibits the indirect pathway.
In the case of Parkinson’s disease, the degeneration of the melanized neurons in the substantia nigra pars compacta (SNc) leads to reduction of dopamine concentration in the putamen and thereby to a reduction of the balancing dopamine influence on the two pathways. The end result of this misbalance is a reduction of the thalamocortical excitatory projection and thereby an inhibition of the cortically initiated movement. As can be seen in Fig. 1.3, right, dopamine reduction stimulates the inhibitory projection of the external part of the globus pallidus (GPe) and thereby releases the
subthalamic nucleus (STN) from its inhibition. This release leads to hyperactivity of the glutamatergic (excitatory) projections from the subthalamic nucleus to the internal part of the globus pallidus and the reticular part of the substantia nigra (SNr). Inhibition of the thalamus is thereby increased and feedback to the cortical motor areas decreased. Most current treatments of the symptoms of Parkinson’s disease rely on replacement of dopamine by administration of its precursor, L-DOPA (levodopa), which is transformed to dopamine in the striatum. About 90% of patients respond to levodopa treatment. Whereas in the first years of treatment, levodopa administration strongly reduces Parkinson symptoms, side effects appear after several years. Probably because of loss of storage capacity of the formed dopamine, action duration of an administered levodopa dose becomes shortened. Dyskinesias (impairment of voluntary movements resulting in fragmented motions) may appear at any time during chronic levodopa treatment. They may be due to relative overdosage or development of supersensivity of dopamine receptors.
Fig. 1.3: Schematic of the classic model of the basal ganglia, reproduced from (Obeso, Rodriguez-Oroz et al. 2000). The left figure displays the normal state, the right figure the case of Parkinson’s disease. Blue arrows indicate inhibitory projections and red arrows excitatory projections. In the parkinsonian state (right figure), thick arrows indicate hyperactivity of the representative projection and double lines hypoactivity. For further descriptions please refer to the text, for a placement of the anatomical structures in human and rat brain to Fig. 1.4 and Fig. 1.5. Abbreviations: GPe: globus pallidus pars externa, GPi: globus pallidus pars interna, SNc: substantia nigra pars compacta, STN: subthalamic nucleus, SNr: substantia nigra pars reticularis, VL: ventralis lateralis (of thalamus), PPN: pedunculopontine nuclei.
The existence of animal models allows the study of specific aspects of Parkinson’s disease, as functional organization of the basal ganglia and its alteration following dopamine depletion. A widely used model, in the rat, relies on administration of the neurotoxin 6-hydroxydopamine (6-OHDA). Injection of 6-OHDA in the substantia
nigra of the rat brain leads to degeneration of the dopaminergic neurons and thereby to lesion of the nigrostriatal pathway. The mechanisms of toxicity of 6-OHDA rely on introduction of oxidative stress via inhibition of mitochondrial respiration.
Functional organization and interaction of different brain structures as the basal ganglia are far from being understood and remain a field of intensive research. The model shown in Fig. 1.3 certainly represents a strong simplification and may only explain specific facts. It demonstrates however how the loss of striatal dopamine via the interaction between different structures may give rise to changes in other basal ganglia neurotransmitter systems.
Several results demonstrate increase of striatal glutamatergic activity in case of Parkinson’s disease or in the animal model. Increased glutamate concentrations as compared to a control group have been measured post-mortem in the putamen of PD patients (subgroup of three from nine patients) (Kish, Rajput et al. 1986) using high performance liquid chromatography (HPLC). Anatomical studies in the 6-OHDA rat model have demonstrated an increase in the density of synapses associated with glutamatergic activity one month following the lesion of the nigrostriatal pathway (Meshul, Emre et al. 1999; Meshul, Cogen et al. 2000). In vivo microdialysis allows the direct assessment of extracellular glutamate levels. In the same animal model, increases of striatal extracellular glutamate as compared to control rats have been demonstrated by several groups. Measured increases vary from 45% (Jonkers, Sarre et al. 2002) and 56% (Bruet, Windels et al. 2003) up to 146% (Meshul, Emre et al. 1999). However, also contradictory results have been found by other groups (Robelet, Melon et al. 2004). Changes in striatal glutamatergic activity caused by dopamine depletion present a central point in Parkinson’s disease. It has been hypothesized that agents acting to restore normal glutamatergic function may provide therapeutic interventions improving current levodopa therapies (Chase, Oh et al. 2000; Marino, Valenti et al. 2003). The ability to measure glutamate in the framework of research on Parkinson’s disease is therefore of strong interest.
Most studies concerning glutamate measurement in Parkinson’s disease have been performed post-mortem or using invasive techniques as microdialysis. Magnetic resonance spectroscopy (MRS) is non invasive, permitting the measurement of principal brain metabolites. Clinical studies involving patients are possible without major problems. Animal studies may profit from the possibility to follow long term disease developments on the same animal (Brownell, Jenkins et al. 1998). Compared to microdialysis techniques, MRS brings in a complementary point of view. Microdialysis assesses extracellular glutamate concentrations, which are on the scale of nanomol (Fillenz 2005). Glutamate concentrations measured by MRS are on the order of millimol and stem mainly from an intracellular origin (see Table 8.3).
In the clinical environment, Parkinson’s disease has been extensively studied using MRS (Bowen, Block et al. 1995; Davie, Wenning et al. 1995; Holshouser, Komu et al. 1995; Clarke, Lowry et al. 1997; Cruz, Aminoff et al. 1997; Ellis, Lemmens et al. 1997;
Federico, Simone et al. 1997; Tedeschi, Litvan et al. 1997; Hoang, Bluml et al. 1998; Hu, Taylor-Robinson et al. 1999; Ross, Hoang et al. 1999; Taylor-Robinson, Turjanski et al. 1999; Abe, Terakawa et al. 2000; Clarke and Lowry 2000; Lucetti, Del Dotto et al. 2001; O'Neill, Schuff et al. 2002; Baik, Choe et al. 2003; Camicioli, Korzan et al. 2004). The strong peaks of choline, creatine and n-acetylaspartate have been investigated to detect differences between healthy subjects and PD patients or to distinguish between forms of Parkinsonism. Because of different experimental protocols, results are difficult to compare (Clarke and Lowry 2001; Firbank, Harrison et al. 2002) and are contradictory. For the NAA to creatine or NAA to choline ratios for example, some groups find decreased values in PD whereas others state no difference between healthy subjects and PD patients (Clarke and Lowry 2001).
Only very few investigators have so far addressed the problem of glutamate measurement (Clarke, Lowry et al. 1997; Taylor-Robinson, Turjanski et al. 1999; Clarke and Lowry 2000). Alterations of the glutamate level in patients affected by PD could not be demonstrated in these studies, using however MRS techniques not optimized for glutamate measurement.
Magnetic resonance spectroscopy has as well been used for studies on the animal model (Brownell, Jenkins et al. 1998; Podell, Hadjiconstantinou et al. 2003). Only a recent study addresses the specific problem of glutamate measurement, using carbon-13 MRS at 4.7 Tesla field strengths (Chassain, Bielicki et al. 2005). Using the carbon-13 nucleus for MR spectroscopy facilitates resolution of glutamate from other metabolites. However, it is dependant on the infusion of an agent enriched in 13C, such as [2-13C] sodium acetate in the study of Chassain et al. The authors demonstrate that significant increase of 13C label incorporation into glutamate occur in the rat Parkinson model. These changes are normalized by L-DOPA administration. The information obtained from 13C experiments is different from the one obtained with proton spectroscopy, as the incorporation of the marker in the molecule to be studied is observed, not solely the (static) molecule content.
It was therefore interesting to address the problem of glutamate measurement in Parkinson’s disease using proton magnetic resonance spectroscopy. Proton MRS was chosen for its high sensitivity and as the equipment, as opposed to the one necessary for carbon spectroscopy, is usually available with any MR machine. Furthermore, proton-MR spectroscopy techniques present higher potential for transfer to the clinical environment.
With this work, we would like to add a study addressing the problem of glutamate measurement in human PD, using a new MRS technique (TE averaged PRESS (Hurd, Sailasuta et al. 2004)) optimized for glutamate detection. Complementary to the study on the patient, we have performed MRS experiments on the 6-OHDA rat model of PD.
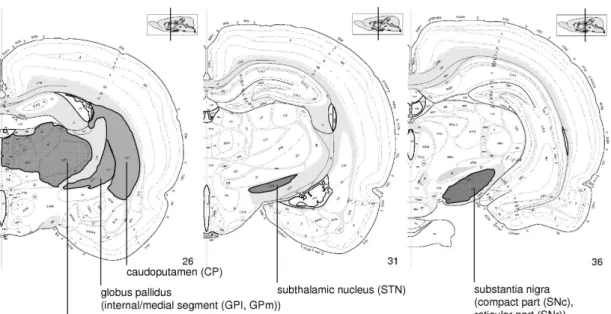
Fig. 1.4: Schematic picture of the basal ganglia (striatum (putamen and caudate nucleus), globus pallidus (internal and external segment), subthalamic nucleus and subastantia nigra) and other structures in the human brain. The combined structure of putamen and globus pallidus is sometimes called lentiform nucleus.
Fig. 1.5: Map of the rat brain (single hemisphere) as taken from (Swanson 1998/1999). Structures implied in the basal ganglia motor cycle as described in Fig. 1.3 have been indicated. The small insert on the top-right of each picture situates the position of the cut in the rat brain. The caudoputamen in the rat brain corresponds to the striatum in the human brain, as caudate nucleus and putamen are not distinguished in the rat.
sequence for brain glutamate detection at 3
Tesla
Les séquences de filtrage à plusieurs quanta offrent des propriétés intéressantes pour les applications in vivo. Une bonne suppression du signal de l’eau indépendamment de sa fréquence de résonance est autant un facteur clé que la possibilité de filtrer un signal sans la nécessité d’additionner plusieurs acquisitions. Le filtrage à deux quanta avec localisation spatiale du signal a été proposé pour la mesure de glutamate cérébral (Thompson and Allen 1998).
Ce chapitre présente une introduction aux principes de filtrage à deux quanta. Ensuite, une séquence optimisée pour la détection de glutamate cérébral est présentée (Thompson and Allen 1998). Son implémentation sur un imageur corps entier à 3 Tesla est décrite en détail.
Double and multiple quantum coherence editing sequences present properties interesting for in vivo applications. Of advantage are good, frequency independent water suppression and single-scan editing capability. Localized double quantum filtering (dqf) has for example been proposed for the in vivo detection of cerebral glutamate at field strengths of 3 Tesla (Thompson and Allen 1998).
This chapter begins with an introduction to the principles of double quantum editing. Then, a sequence optimized for brain glutamate detection (Thompson and Allen 1998) is described. Its implementation and test on a 3 Tesla whole body MRI is in the following reported in detail.
2.1
Introduction to double quantum filtering
Multiple quantum coherence editing sequences use selective preparation of multiple quantum coherences (mqc) on a targeted molecule to distinguish it from the overlapping signals of its vicinity. Subgroups of this type of sequences are double quantum filters using magnetic field gradients. This sequence type, as used for homonuclear spectral editing, will be described in this section.
Double and multi quantum coherence editing has been applied targeting different brain metabolites such as GABA (Du, Chu et al. 2004), glucose (Keltner, Wald et al. 1997), taurine (Lei and Peeling 1999) or glutathione (Trabesinger, Weber et al. 1999). But also other regions of the body (Jouvensal, Carlier et al. 1996) have been examined using this type of sequence. The scheme of a double quantum filter sequence is shown in Fig. 2.1.
Fig. 2.1: Radiofrequency and gradient pulse scheme of a double quantum filter (dqf) sequence. Double quantum coherences are created by the second 90° pulse and converted back to observable single quantum coherences by the third 90° pulse.
For a weakly coupled two spin system (I-S), the delay τ is ideally chosen to 1/(4J), with J the coupling constant between I and S. At the end of the first evolution period (2 τ) and before the second 90x pulse, the state of the spin system can then be written as
(Ernst, Bodenhausen et al. 1987; de Graaf 1998)
Z XS I 2 ) 2 (
τ
− =σ
(2.1)In this description we only look at the I part of the spin system. The symbol σ designates the systems density operator and I and S are the product operators of the respective spins. Application of the second 90x pulse, called “double quantum
coherence” (dqc) pulse, generates double and zero quantum coherences:
) ( 2 2 ) 2 ( − − + − − + + + − + − = − = + S I S I S I S I i S IX Y τ σ (2.2)
A corresponding contribution arises from the S spin. In the gradient field of G1 each
product operator accumulates a phase shift Φ proportional to its coherence order. The delay ∆t in this example is considered short enough to neglect chemical shift and coupling evolution. At the time t =2τ +∆t, before the third 90x pulse, the system state
is characterized by ) ( 2 ) 2 ( τ 2φ1 2φ1 σ +∆t = i I+S+e−i −I+S− +I−S+ −I−S−e+i (2.3) with r r G t dt t i i i
∫
∆ ⋅ = Φ = Φ 0 ) ( ) ( r r rγ
. The vector r designates the localization of the considered spin group; γ is the proton gyromagnetic ratio. The phase Φ is determined by the gradient amplitude and duration of its application. Often, these are summarized in the variable k so that one may write i i r r kir r r ⋅ = Φ = Φ ( ) 2
π
with k r G t dt t i i∫
∆ ⋅ = 0 ) ( 2 r r rπ
γ
.The third 90x pulse, called “read pulse”, converts double quantum coherences back to
following. This is justified because dqc present in the system after the third 90x pulse
will not -in the weak coupling approximation and assuming ideal rf pulses- develop into observable coherences. Other single quantum coherences produced will be dephased by the second gradient G2. At the beginning of the signal detection period, the chemical
shift evolution has been refocused by the second 180° pulse and the spins have acquired an additional phase shift due to the second gradient pulse G2. The system state is written
as 2 2 2 1 2 1 2 1 2 1 4 4 8 8 8 8 ) 4 ( ) 2 ( ) 2 ( ) 2 ( ) 2 ( φ φ φ φ φ φ φ φ φ φ
τ
σ
i i i i i i e I i e I i e I i e I i e I i e I i t + − − + + + − + − + − − − − + − + − + − = ∆ + (2.4)For double quantum filtering, as in our case, k2 equals 2k1 and therefore Φ2 becomes
equal to 2Φ1. Integrated over the sample volume, only operators without phase term
give a resulting signal. The resulting signal is therefore determined by
y I I I i 4 1 ) ( 8 − =− = + −
σ
(2.5)The same contribution arises from the S spin, which has not been observed since the beginning of this calculation.
Uncoupled spin groups, giving rise to strong singlet signals in NMR spectra, are unable to produce double quantum coherences that follow the process described above. Transverse magnetization produced on these spin groups by the first pulse of the sequence is still present as observable transverse magnetization after the second 180° pulse, but then dispersed by the second gradient pulse G2. This is not only useful for
effective water suppression, but also for the elimination of singlet resonances that may cover the signal of coupled spins in in vivo NMR spectra. An example is the detection of GABA at 3 ppm which is covered by the singlet peaks of creatine / phosphocreatine and choline in unedited spectra (McLean, Busza et al. 2002). Also the unwanted contribution of coupled spin groups other than the one targeted can be attenuated. Differentiation is done by the differing J couplings constants of the different molecules. The sequence timing assures optimal production of double quantum coherences only for molecules with a coupling constant of J = 1/(2t). In the example of our sequence t equals 2τ, see Fig. 2.1. The magnetization of molecules with differing J values will remain partially in a single quantum state and be suppressed, leading to an attenuation of the signal from this molecule.
The disadvantage of the filtering approach presented in this section is an overall signal reduction of about (exactly only in our example) 75% for the signal coming from the targeted molecule. This signal loss is caused by the only partial transformation of single
quantum coherence to double quantum coherence, as can be seen in equation (2.2), and the fact that, using gradient filtering, only one coherence transfer pathway is refocused. Designing and using double quantum filter sequences for in vivo applications presents several difficulties.
The strong reduction of the signal from the targeted molecule is an important drawback, as the concentration of brain metabolites is low, around 8 mMol / kg w.wt in vivo. Reliable signal quantification using dqf sequences therefore needs large acquisition volumes or long acquisition durations.
The dqf sequence shown in this chapter is a very strong simplification of a sequence useable for in vivo spectroscopy. Efficient in vivo spectroscopy needs spatial localization of the acquisition volume, demanding either a preparation module before the dqf sequence or volume selective pulses within the dqf sequence. It has been shown that the use of shaped pulses and the process of volume selection has an important influence on the evolution of coupled spin systems (Slotboom and Mehlkopf 1994; Thompson and Allen 2001). Optimization of sequences incorporating spatial localization is therefore more difficult as described in the preceding paragraph.
Molecules that present an interest in medical or biomedical research have more than two observable spins, as it was the case in the calculation of an I-S system. An example is glutamate or GABA, having five and six observable spins. At the currently available field strengths for medical research (up to 3 T), most molecules of interest can not be considered in the weak coupling approximation, as has been done for the calculation presented in this section. Optimal timing parameters are therefore difficult to determine. Several authors show the optimization of localized dqf sequences, adjusting the sequence timing (Wilman and Allen 1995; Trabesinger, Weber et al. 1999), the read pulse flip angle (Wilman and Allen 1993; Lei and Peeling 1999) or even the dqc pulse phase (Kim and Allen 2003) and using an experimental approach or simulations. A major improvement can be achieved using read pulses that are selective only on the coupling partner of the spin to be observed. In our example such a read pulse would be frequency selective on the S spin, if we wanted to observe signal from the I spin. A recovery of 50% of the signal amplitude instead of only 25% can be achieved. The suppression of contributions from other coupled spins than the one targeted may be improved as the double quantum coherences of these spins are not transformed back into single quantum coherences by the read pulse. In the literature binomial pulses (Trabesinger, Weber et al. 1999), shaped pulseforms (Lei and Peeling 1999), block pulses (Keltner, Wald et al. 1998) or even composite pulses (DANTE pulse train) (Trabesinger and Boesiger 2001) can be found for the realization of frequency selective read pulses. More recently developed filter sequences use refocusing pulses pulses that are selective on certain resonances of the targeted molecule (Shen, Rothman et al. 2002; Choi, Lee et al. 2004; Choi, Lee et al. 2005). These sequences thereby achieve a further improvement in resolving the targeted molecule from its overlapping background.
2.2
Sequence design of a double quantum filter for in vivo
applications
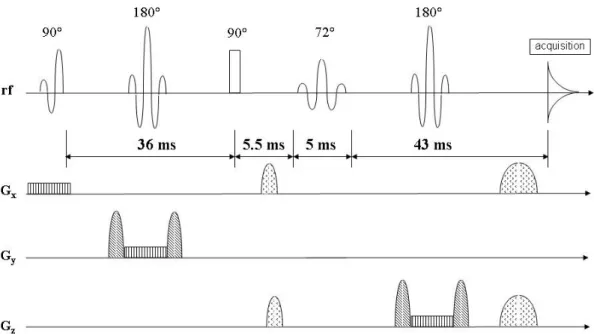
The pulse sequence evaluated in this work is based on a proposition of Thompson et al (Thompson and Allen 1998). The rf and gradient pulse scheme is reproduced in Fig. 2.2.
Fig. 2.2: Sequence design of a localized double quantum filter (Thompson and Allen 1998). Sequence timings and the flip angle of the fourth pulse (called “read” pulse) have been determined numerically to optimize glutamate detection at 2.3 ppm at a field strength of 3 Tesla.
The sequence design incorporates spectral editing into a PRESS localization module by making the excitation pulse and the two refocusing pulses slice selective. A self refocusing BURP pulse (Geen and Freeman 1991) of 4 ms length is used for excitation in order to begin the evolution period with completely refocused magnetization. Optimized sinus cardinal pulses of 4 ms length are used for refocusing and slice selection in the two directions perpendicular to the excitation slice. The authors emphasize to use optimized pulses, as the slice profile is not only important for proper localization, but also plays a role in coherence transfer (Thompson and Allen 1999). The second 90° pulse, which has the function of producing multiple quantum coherence orders is realized as a rectangular shaped pulse of 250 µs length. Its length is kept short in order to achieve as well as possible the behavior of an ideal pulse that would be infinitely short. The read pulse is a sinus cardinal shape multiplied with a Gaussian function. This apodization renders its frequency profile stable to a range of flip angles differing from 90° at the cost of a larger transition band. The pulse is applied with a flip angle of 72°. Filtering gradients of 2 ms and 4 ms length are used, oriented at the “magic angle” (see section 2.3.2).
The target of this dqf sequence is the glutamate resonance in the 2.3 ppm region. While a maximum of glutamate signal should be produced, the close and underlyig resonances of glutamine, NAA and GABA should be suppressed. Furthermore, the aim is to keep only one single peak from the complicated glutamate lineshape (Govindaraju, Basus et al. 1998).
Optimal sequence parameters are difficult to determine. Glutamate, glutamine, NAA and GABA present strong coupling behavior at field strengths of 3 Tesla. The evolution of the spin systems can therefore not be described easily. Furthermore, the influence of shaped pulses has to be taken into account. Depending on their length and shape, coherences in the spin systems are produced and redistributed (Thompson and Allen 1999). As already mentioned, some dqf sequences use pulses that are selective on certain resonances of the targeted molecule. Multiple quantum coherences are prepared only on the targeted molecule (for example GABA or glutathione (Trabesinger and Boesiger 2001; Shen, Rothman et al. 2002)). This way to proceed is not possible for targeting glutamate while suppressing glutamine, NAA and GABA. Coupled resonances of glutamate, glutamine, NAA and GABA overlap in a small spectral area of only 0.2 ppm. Separating glutamate from its background with double quantum filtering therefore relies on an adapted timing of the sequence. The coherence transfer properties of the pulses used for slice selection and the read pulse may be used.
In the dqf sequence proposed by Thompson et al (Fig. 2.2), several sequence parameters have been optimized numerically. A density matrix description of the spin system has been used to predict the spectral shape in dependence of the sequence delays, the read pulse length and the read pulse flip angle. Optimal parameters are derived for these parameters from the simulations.
2.3
Implementation of a dqf sequence on a 3 T whole body
imager
In this section the implementation and parameterization of the dqf sequence, especially with respect to water suppression and rf pulses, will be detailed. A procedure assuring optimal results from freely positioned voxels will further be described.
2.3.1 Radiofrequency pulses
All radiofrequency pulses are applied with the carrier frequency set to the glutamate resonance at 2.3 ppm. The position of the volume selected for the spins resonating at 2.3 ppm thereby coincides exactly with the chosen position. Voxels for differing resonance frequencies will be slightly displaced.
2.3.1.1 Excitation and refocusing pulses
For excitation and refocusing, 3-lobe sinus cardinal (sinc) pulses have been chosen. The excitation profile of a BURP pulse (Geen and Freeman 1991) is very sensible to small rf
power maladjustments. During in vivo tests, time consuming fine adjustments were necessary to achieve an acceptable slice selection. Still, the profile stayed improper compared to that of a normal sinc pulse. In simulations (Smith, Levante et al. 1994), no difference in the lineshape of a glutamate and glutamine dqf spectrum using a BURP or a sinc pulse could be found. The refocusing profile quality as produced by a normal sinc pulse was estimated to be sufficient.
An improvement of the glutamate peak intensity could be achieved shortening the excitation and refocusing pulse lengths from 4 ms to 2 ms. Experiments on phantoms containing only glutamate in solution show an increase of the 2.3 ppm glutamate resonance of about 15%. The excitation and refocusing pulses that are used for spatial localization interfere with the coherence transfer (Thompson and Allen 1999). Shorter pulses approximate better the behavior of ideal pulses. Shorter pulses used for voxel localization therefore interfere less with the double quantum filtering and lead to improved performance. Also, the relative displacement of the volumes selected for the glutamate resonances near 2.3 ppm and 3.7 ppm is reduced, increasing the volume in which double quantum coherence between these two spin groups can be produced. Even shorter pulses could possibly further improve the performance. Due to rf power limitations a duration of 2 ms is although the experimental limit for the moment on our system.
2.3.1.2 DQC pulse
The dqc pulse (second 90° rf pulse of the sequence) is realized as block shaped pulse. The length of this pulse was kept as short as possible to approximate the behavior of an ideal pulse. A duration of 250 µs presents the minimum length with respect to rf power limitations of our system. First in vivo and in vitro tests on centered voxels were conducted with dqc pulse lengths of 250 µs. In later experiments on freely positioned voxels, it was necessary to match the length of the dqc pulse with the length of a 180° block shaped pulse. This pulse was used in a complementary sequence necessary for calibration purposes, see section 2.3.3. As minimal common pulse duration, we chose a length of 350 µs.
2.3.1.3 Read pulse
A sinus cardinal shape with two lobes (two zero passages to each side) was used for the read pulse. This sinc shape has been multiplied with a Gaussian profile cut off at 25% of its maximal amplitude. Fig. 2.3 shows the calculated excitation profile of this pulse to illustrate its characteristics. A flip angle of 72° and a length of 5 ms, as used in the dqf sequence, have been simulated. A solid line indicates the real part, a dotted line the imaginary part of the magnetization. The Gaussian apodization of the sinc shape allows the pulse to have a flat excitation band for flip angles differing from 90°. The spectral region, near 2.3 ppm, is homogenously excited. The water resonance is situated slightly next to the excitation band; its content in the spectrum is only slightly reduced in this way.
2.3.2 Water suppression
Double quantum filtered spectroscopy sequences have intrinsic water suppression, as the water molecule presents only uncoupled resonances. Under certain circumstances it is however possible to create multiple quantum coherences between separate water molecules. These can pass the filter and give rise to relatively strong water signals in the spectrum. A qualitative description of this circumstance known as “intermolecular multiple quantum coherences (iMQC)” will be given in the following. In this work, the objective was to circumvent this effect in order to completely eliminate the water signal from the spectrum.
Multiple quantum coherences between water molecules are created by the dqc and read pulse together with the two filter gradients. This sequence part is shown in Fig. 2.4. A review of the fundamental principles of how multiple quantum coherences are formed by this sequence has been given Richter et al (Richter and Warren 2000).
Fig. 2.3: Excitation profile of the read pulse as used in our sequence implementation. Frequency positions of the glutamate and water resonances are indicated, assuming the pulse carrier frequency centered on the glutamate 2.3 ppm multiplet. The simulated pulse is a two lobe sinc shape (two zero crossings to each side) multiplied with a Gauss form. The Gauss shape has a cutoff factor of 25%, the simulated flip angle was 72° and the pulse length 5 ms. The solid line indicates the real part, a dotted line the imaginary part of the magnetization. The Gaussian apodization assures a flat excitation band at a flip angle below 90°. All glutamate resonances are homogeneusly excited.
Fig. 2.4: Radiofrequency and gradient pulse scheme for the generation of intermolecular multiple quantum coherences (“CRAZED” (Richter and Warren 2000)). The dqc pulse, read pulse and the filter gradients of a double quantum filter sequence correspond to the “CRAZED” scheme. Intermolecular multiple quantum coherences can be created on the water molecules and lead to a strong water signal in the spectrum.
Two generally made assumptions have to be revised to explain the formation of iMQC. The first assumption is the “high temperature approximation” for the density operator. This assumption says that the general density operator given by
)) / (exp( ) ) / exp(( kT H tr I kT i Zi − − =
ω
∑
ρ
h (2.6)may be approximated by a Taylor series that is cut after the linear term, giving
)) / (exp( ) / ( 1 kT H tr I kT i Zi − − =
ω
∑
ρ
h (2.7)This simplification is not justified for macroscopic samples, as, because of an important number of spins, higher order terms in the Taylor series are not small compared to one and therefore not negligible. A valid description has to consider higher order terms, that make appear two spin operators as Iz1Iz2 not present in (2.7).
The second assumption concerns dipolar couplings between spins. The dipolar coupling Hamiltonian for the spin system may be written in polar coordinates as
) 3 ( 0 0 l N k N l k lZ kZ kl d D I I I I H =
∑∑
− ⋅ = = (2.8)with the “dipolar coupling constant” D that evaluates to
) cos 3 1 ( 4 4 2 3 0 kl kl l k kl r D
γ
γ
θ
π
µ
− = h (2.9)In the equation for D, θkl indicates the angle between the internuclear vector and the
main magnetic field.
In liquid samples, dipolar couplings add to zero. To demonstrate this, equation (2.8) and (2.9) are evaluated looking at two limits, the interaction of a two spins at a close distance (short range dipolar interactions) and the interaction of a spin with a great number of other spins situated at a fixed, large radial distance (long range dipolar
interactions). For the formation of iMQC, long range dipolar couplings are of importance. Integrating (2.8) for a fixed distance r we obtain the following expression:
∫ ∫
= Θ = − ⋅ − π π ϕϕ
θ
θ
θ
0 2 0 2 sin ) cos 3 1 )( 3 ( ~ I I I I d d Hd kZ lZ k l r r (2.10)If the sample is homogeneously magnetized, the term in the first parenthesis of (2.10) is independent of θ and φ. In the vector model, one can imagine that all magnetization vectors are parallel. Hd is therefore proportional to
∫ ∫
= Θ = Θ Θ − Θ π π ϕϕ
0 2 0 2 sin ) 1 cos 3 ( d d (2.11)which is zero. If magnetic field gradients have been present at a time during the sequence (after excitation of the spin system), the sample is not homogeneously magnetized. The magnetic moments of the spins in the sample are no longer aligned but wound up in a helix characterized by the gradient strength. The expression in the first parenthesis of (2.10) becomes a function of of θ and φ and Hd no longer adds to zero.
The spins evolve under the influence of spin-spin dipolar coupling between distinct molecules.
Longitudinal two spin terms in the equilibrium density matrix and the presence of dipolar couplings together explain the production of a signal from the sequence displayed in Fig. 2.4. The first pulse transforms longitudinal two spin operators as Iz1Iz2
to transverse spin operators as Ix1Ix2 for example. These represent a mixture of zero and
double quantum coherence. Chemical shift evolution makes appear terms as Ix1Iy2,
which are being transformed to Iz1Iy2 by the second pulse. The first and the second
gradient have introduced inhomogeneous magnetization in the sample; terms of the form Iz1Iy2 evolve under dipolar couplings to Ix1, which is measurable magnetization. It
can be shown that the strength of the signal S is proportional to 1
cos 3
~ 2Θ−
S (2.12)
where θ is the angle between the B0 field axis and the magnetic field gradient axis.
Alone the dqc and read pulse of the double quantum filter sequence together with the two filter gradients produce detectable signal. These pulses are non selective, they act on the whole sample volume. Intramolecular multiple quantum coherence signal from the water is therefore produced from almost the whole volume. The last refocussing pulse of the dqc sequence however reduces the contributing volume, as a slice is selected. At the start of the acquisition, two major signal contributions are present: A double quantum filtered signal from the voxel, which is the signal of interest, and water iMQC signal originating from the whole slice that has been selected by the last rf pulse. As the volume of the voxel is much smaller than the slice volume, and as the water concentration is much higher than the metabolite concentration in vivo, iMQC signal from the water strongly contaminates the spectrum.