Computational Fluid Dynamic (CFD) Optimization of Microfluidic Mixing in a MEMS Steam Generator
by Kimberlee C. Collins MASSACHL3ES N::. I• OF TECHOLOC
AUG 1 4 2008
LIBRARIES
SUBMITTED TO THE DEPARTMENT OF MECHANICAL ENGINEERING IN PARTIAL FULFILLMENT OF THE REQUIREMENTS FOR THE DEGREE OF
BACHELOR OF SCIENCE IN MECHANICAL ENGINEERING AT THE
MASSACHUSETTS INSTITUTE OF TECHNOLOGY
JUNE 2008
@2008 Kimberlee C. Collins. All rights reserved. The author hereby grants to MIT permission to reproduce
and to distribute publicly paper and electronic copies of this thesis document in whole or in part
in any medium now known or hereafter created.
Signature of Author:
Department of Mechamcal Engineering 05/09/08
Certified by:.
Carol Livermore SMA Assistant Professor of Mechanical Engineering and Manufacturing Thesis Supervisor
Accepted by:
,
-.Htn" H. Lienhard V Professor of Mechanical Engineering Chairman, Undergraduate Thesis Committee
Computational Fluid Dynamic (CFD) Optimization of Microfluidic Mixing in a MEMS Steam Generator
by
Kimberlee C. Collins
Submitted to the Department of Mechanical Engineering on May 9, 2008 in partial fulfillment of the requirements for the Degree of Bachelor of Science in
Mechanical Engineering
ABSTRACT
The challenge of achieving rapid mixing in microchannels is addressed through a
computational fluid dynamics (CFD) study using the ADINA-F finite element program. The study is motivated by the need to design an adequate mixing chamber for aqueous chemical reactants in a micro steam generator. The study focuses on the geometric optimization of a static micromixer channel by considering the trade-off between mixing quality and pressure drop. Both zigzag and straight channels are evaluated, in addition to channels with differing amounts of added obstruction features.
Due to computational limits, the numerical analysis is conducted in two
dimensions. The results indicate that hydrodynamic focusing of the reactant at the inlet, in addition to the amount and density of added obstruction features, has the most significant impact on mixing efficiency and increased pressure drop. The study presents mixing quality and pressure drop trends that provide useful
information for the micro steam generator mixing chamber design.
Thesis Supervisor: Carol Livermore
NOMENCLATURE
A cross sectional area of channel
Ainlet, cross sectional area of channel inlet c, concentration at node i
cM mean concentration
D diffusion coefficient Dh hydraulic diameter
m bulk mass flow rate
n number of nodes
P perimeter of channel cross section Re Reynolds number
t mixing time (residence time)
x mixing length a mixing quality
t fluid viscosity p fluid density
a~ standard deviation in concentration
ma maximum standard deviation in concentration
~a,g average flow velocity
,peak peak flow velocity
INTRODUCTION
One crucial aspect to many microfluidic devices is need to effectively carry out chemical reactions. Often a reaction depends on the speed at which reactants are combined, which stimulates interest in the ability to achieve rapid mixing at microliter scales. Mixing in
microchannels proves challenging, however, due to the strictly laminar nature of the flow. In the absence of turbulence, fluid mixing slows considerably. Existing micromixing research provides a valuable starting point for the design of rapid micromixers geared towards specific applications. This study focuses on the numerical optimization a micromixer for the application of a micro
steam generator. Preliminary design for the micromixer is based on micromixing literature [1-8], and numerical optimization of the mixer geometry is explored.
The micro steam generator motivating this study is aimed at addressing the challenge of microfluidic pumping, and is an ongoing research project by MIT doctoral student Feras Eid and MIT Professor Carol Livermore. Microfluidic pumps and mixers are both fundamental
components necessary for integrating complex microfluidic systems. The steam generator operates by reacting liquid hydrogen peroxide with a homogeneous catalyst. Steam is produced which is accelerated to supersonic velocities, and can subsequently be used to drive a micro pump. Achieving complete mixing of the liquid H202 and catalyst solution within a short time frame is crucial for the successful progression of the reaction.
The literature provides a basis for an efficient mixer design, but numerical confirmation and optimization provide essential application-specific information. Optimization of the reactant mixer for the micro steam generator depends both on maximizing mixing quality and on maintaining a sufficiently low pressure drop. The amount of pressure drop is of concern due to physical limitations on O-rings used in the micro steam generator assembly. The micro steam
generator will also prove more useful as a pumping mechanism if it does not require a high driving pressure. A computational fluid dynamics (CFD) analysis using the commercial finite element program ADNIA-F on a 3 GHz Intel Pentium 4 processor is conducted to investigate the optimal microfludic mixer.
BACKGROUND
Although the dynamics of microfluidic mixing remains an active area of research, many numerical and experimental studies have investigated the governing factors that contribute to mixing [1-8], which provide helpful principles upon which to base an initial micromixer design. Micromixers divide into two basic groups: active and passive mixers. Active micromixers rely on an external energy source, while passive mixers operate solely from the fluid driving pressure [1]. In theory, active mixers have the ability to scale to a range ofmicrofluidic applications, whereas the effectiveness of passive mixers relies heavily on specific system parameters like flow rate and fluid mass ratios. For the application of the micro steam generator, however, a passive design is preferred for reasons of simplicity, since the mixer is to be integrated into a much more complex system. Given fixed input flow conditions, an effective passive design is appealing.
Passive, or static, micromixers largely rely on molecular diffusion to achieve mixing. Small length scales dictate low Reynolds numbers that result in strictly laminar flow. Consequently, rapid mixing of fluid layers that are thicker then the diffusion length is difficult. The Einstein formula, x
-
2-D-t, provides a method for approximating diffusion length. Reducing the thickness of fluid layers and increasing the interfacial area of adjacent fluid streams are common methods used to speed up diffusion. Such methods include hydrodynamic focusing andmultilamination by flow splitting and recombination [2]. Other research explores increasing the rate of diffusion by inducing regions of laminar recirculation [2-4].
Different laminar flow regimes may be exploited to facilitate mixing by inducing recirculations and streamline bending [5-6]. Engler et al. and Kockmann et al. found that the
laminar flow in static micromixers has three distinct regimes in which the mixing characteristics differ: stratified laminar flow, vortex flow, and engulfment flow. Generally, the engulfment flow regime, which occurs at higher fluid velocities, displays superior mixing characteristics, followed by vortex and stratified laminar, which occur at lower fluid velocities. In the stratified laminar regime, flow streamlines follow the channel walls with minimal bending. In vortex flow, the fluid exhibits some swirling behavior while maintaining axial symmetry. Engulfment flow causes instabilities that break axial symmetry and provide conditions for increased mass transfer [5-6]. Engler et al. point out that the development of the vortex and engulfment regimes depends on channel geometry as well as flow velocity [5].
By taking advantage of different flow regimes, researchers have investigated increasing mixing in static micromixers by careful engineering of channel geometry [2-4]. Mengeaud et al. studied mixing in zigzag channels both numerically and experimentally. Back flows induced by certain zigzag angles at high flow velocities caused laminar flow recirculations that improved mixing efficency [2]. Wong et al. and Rawool et al. reported the observation of recirculation regions downstream from manufactured channel wall obstructions. The obstructions were in the
form of rectangular or trapezoidal nubs. The nubs resulted in greater mixing efficiency and uniformity [3-4]. Rawool et al. also noted that increasing the taper on the nubs reduced the pressure drop caused by the obstructions [4].
The successful implementation of static mixromixers in the literature [2-8] provides the basis for our micro steam generator reactant mixing chamber. Primarily, the addition of zigzag and obstruction numbs is investigated. Hydrodynamic focusing of H202at the inlet is also
incorporated into the mixer design. Numerical simulations are used to optimize the mixer geometry for mixing efficiency and minimal pressure drop.
NUMERICAL SIMULATION
Automatic Dynamic Incremental Nonlinear Analysis (ADINA) finite element software developed by ADINA R&D Inc. is a proven program for fluids simulations [9-11 ]. A steady
state, two dimensional, CFD analysis in ADINA-F was performed using Flow-Condition-Based-Interpolation (FCBI-C) elements. ADINA uses a segregated method for iteratively solving nonlinear fluid systems comprised of FCBI-C elements. Since the solution variables are not directly coupled in a single matrix, some adjustment of residual variable parameters is required in order to obtain a fully converged solution [ 11].
The analysis included mass transfer to account for molecular diffusion, and assumed an incompressible fluid. A no slip boundary condition was applied to all of the channel walls with the exception of the inlet and outlet faces. The loading applied to each inlet comprised of a parabolic Poiseuille velocity profile and a mass ratio. A free condition was assumed at the outlet.
The mesh was generated automatically by ADINA under the constraint that no element be larger then 1 unm2 for a channel width of 100Pmn2. Experimentation with various mesh sizes revealed that the fine mesh size chosen was necessary to obtain reasonable results for mass transfer and velocity. Due to the necessity of a fine mesh, computational limits required that the analysis be conducted in two dimensions. Furthermore, to minimize rounding errors, a
MIXING QUALITY
The criteria for mixing quality chosen depends on the standard deviation of the fluid concentration as defined by Eqs. 1-3. The maximum standard deviation in concentration is defined as the standard deviation at the inlet. Thus, at the inlet, the mixing quality is zero. A mixing quality of 1 indicates perfect mixing.
1n Mean concentration: CM c i (1) n
Standard deviation:
o
-c~-)(2)
n
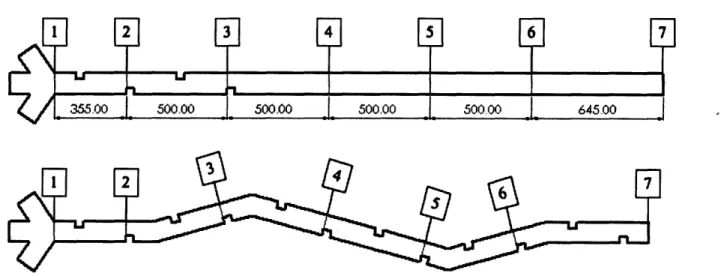
Mixing quality: a = 1- a (3) OUmax MIXER MODELSThe mixer designs considered are illustrated in Figures 1 and 2. The channel has three inlets and one outlet. The reactant, hydrogen peroxide, flows through the center inlet, and the catalyst is injected through the two surrounding inlets. Two overall channel profiles are explored: zigzag and straight. The addition of channel obstructions in the form of rectangular notches is also investigated. For each profile, simulations are run for different numbers of notches, from no notches to the first four notches. The zigzag channel is also considered with a total of 12 notches and with 4 closely spaced notches as shown in Figure 2b. Comparisons of
mixing quality and pressure drop for each case are considered. Optimization of the mixer depends on maximizing mixing quality while minimizing pressure drop.
250.00 40.00
.30.0 100.00
77
3000.00
Figure 1: Straight mixer channel. Dimensions are in microns.
A ^AA
250.00 100.00
Figure 2a: Zigzag mixer channel. Dimensions are in microns.
250.00
Figure 2b: Zigzag mixer channel with closely spaced notches. Dimensions are in microns.
FLOW PARAMETERS
Some known parameters for the micro steam generator served as constant values in the simulation including the bulk mass flow rate, diffusion coefficient, fluid densities and viscosities
"`' `4u
as listed in Table 1. Although values are listed in SI units for convenience, recall that in the simulation a picogram-micron-microsecond system of units is adopted. The inlet velocity profile is assumed to be parabolic, and the peak is found with Eq. 4. The Reynolds number for the flow can be calculated from Eq. 5. Calculations of cross sectional area assume a channel height of
100 mn. Peak velocity: Reynolds number: m Opeak = 20 where = n PAinlet p6a D, 4A Re = P" where Dh, = 9 P
Table 1: Fluid property values
(4)
(5)
Pcatays, = 998 kg /m3 density pHo, = 1446 kg /m 3 icatalys, = 0.001 Ns/ m2 viscosity lH,o, =0.0013 Ns/m2 bulk mass flow rate m = 5x10-' kg/sdiffusion coefficient D = 1.40x10- 9 2 /s
mass fraction catalyst = 0.15 mass fraction
CFD MIXING RESULTS
Mixing quality was evaluated at the channel cross sections illustrated in Figure 3. The results for mixing quality are plotted against distance of the cross section along the length of the channel in Figures 4 and 5. Pressure drop verses number of notches for both channel profiles are shown in Figure 7. Band plots of the simulation results for the straight channel mixer are shown in Figures 7a-7e, and results for the zigzag mixer are shown in Figures 8a-8f. An illustrative plot of the flow velocity vectors is shown in Figure 10.
1. 0.9. 0.8. 0.7-0.6. 0.5. 0.4. 0.3. 02. 0.1.
014
1000 1500 2000distance along channel [um]
2500 3000
Figure 4: Mixing quality verses distance along channel for straight mixer
-#- 0 notches --W- 1 notch 2 notches -- 3 notches -- 4 notches -+-- 12 notches -- 4 close notches 500 1000 1500 2000 2500 3000
distance along channel [um]
Figure 5: Mixing quality verses distance along channel for zigzag mixer -*- 0 notches -1-U 1 notch 2 notches --- 3 notches -0- 4 notches 500 I' 0.9. 0.8 0.7 0.6 0.5. 0.4 0.3-
0.2-0.1.
0 --- c-- --- - - - - - - ---- --- --- --- -~---~---~-4 0
1
0.9
0.8.
0.7-500 1000 1500 2000 2500 3000 distance along channeml [um
Figure 6: Comparison of mixing quality in zigzag and straight channels
3000 um
0.837 0.852 0.881 0.880 0.914 0.928 0.9471355 umr
0.620 0.691 0,730 0.766 0.819 0.856 0.853 355 umrn 0 umr 0 notches 1 notches 2 notches 3 notches 4 notches 4 close notches A12 notches zigzag
Table 2: Mixing quality verses distance along channel 1855 umrn
--- -
--- --- - --- --- --- S---
---0.6.
0.5.0.4-
0.3-0.2 0.1 855 umrn w1 • w . - - -500 1000 1500 2000 2500 3000 i2355 umr
0.772
0.807
0.837
0.848
0-888
0-909
0.931
I0.000
0.000
0.000
0.000
0.000
0.000
0.000
0.312
0-441
0 462
0-428
0 465
0.708
0.467
0.490 0.587 0.639 0.686 0.719 0.809 0.722 0.705 0.757 0.790 0.814 0.859 0.885 0.908 * -- •straight- 0 notches ---- zigmg - 0 notches* -A- -straight- 2 notches
z-- gzag - 2 notches
-4- -straght- 4 notches
- - zigzag - 4 notches
--- I I I I I I I I I I I I I I
-
---50O
45-40a 35. 304 251 20. 156number of notches
Figure 7: Pressure drop
concentration: MASý_RAI•_, MAXIMUMI
TrIt 1 & 0.8500 NODE 42153 S MINIMUM W 0.1500 NODE 9492 TgW 14M A 5877 NODE 34850 MINIMUM 0.000 NODE 29801 I-NODALftsusSE MAXIMUMI I1K LM A 24.28 NODE 10085 m44 MINIMUM S 06800 f NODE 73575
Figure 8a: Simulation results for straight channel mixer with 0 notches
14
*
zigzag
channel
* straight channel
A zigzag close channel1
pressure:
. .
concentration:
4dI
-I& pressure: uAss0.r1o_-1 MAXIMUM 1n' 0o a0.8500 NODE 29801 * MINIMUH - W 1 0.1500 NODE 46 WELD1.11' MAXIMWU , a. 8.788 NODE 6195 MINIMUM V *>0.000 NODE 29801 4OWALMPSSULE MAXIMUM Im 14M A 2n57 NODE 10005 33.3$ 0.000 0204 NOCE 73381 2040 'At Ms0
Figure 8b: Simulation results for straight channel mixer with 1 notch
pressure: W1s$SYAIO- MAXIMUM TV* 110W .0.8500 NODE 39984 ONO- MINIMUM '.o1 MAXIMUMh 10E 14~ 8.841 NODE 88286 MINIMUM W 0.000 NODE 29801 NCOAL-PRSSURE MAXIMUM 11K uLo A 26.92 NODE 2Wg]0 Mr INIMUM u• * 0.000 264 NODE 287681 34M ""t-0.00
Figure 8c: Simulation results for straight channel mixer with 2 notches
'6
concentration: -- -1Lvelocity: S-0.A1••toI. MAXIMUM 0t00 *6o 6A 0.850 NODE 39964 -n MINMUM Dow. * 0.1500r
" NODE 27532 Ob MI M• l AXIHMUM NODE 88286 i1 MINIMUM NODE 29801 N•DAPRESSURE MAXIMUt Ali A 28.44 NODE 29801 HIN)MUH 3 * 4140.000 *44 NODE M285571'
pressure:
Figure 8d: Simulation results for straight channel mixer with 3 notches
I
a
'I II ' ·
WCILF~L
-- I ' I
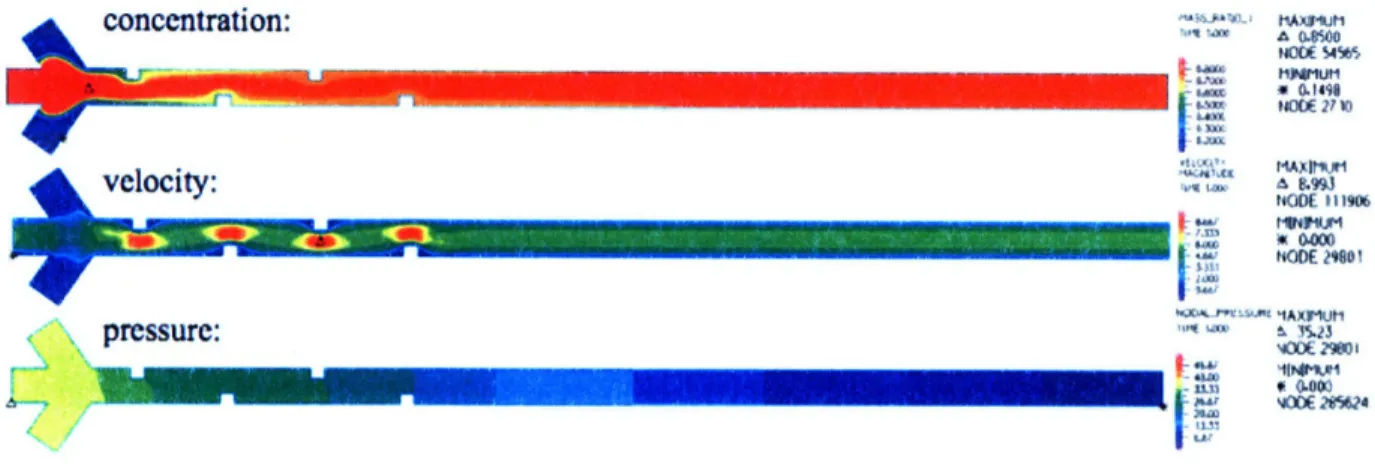
concentration: velocity: A M050W NODE 5455 4,t , 4 041980~~ c~u-u t36X 2110) NODE 111906 I '. 4000W W tODE Ae VAIUM29801 EiBs 4W1W sotE29WoI W3
0Ei
0.000AWr 4WEAW4L~LAZ a~ pressure:
~ :e R
Figure 8e: Simulation results for straight channel mixer with 4 notches
F- UQ-ow velocity: pressure:
fjjj;:
-
Ok-Im
-iI
26t7 20411 I 3-33 (.67 Tjý* 14W o a .8500 NODE 45927 MINIMUM W0.1500 NODE 5762 C MAXIMUM A 6.074 NODE 167541 NODE 29801 kEA&JRt MAXIMUM a 2%97 NODE 29801 MINIMUM * 0.00 NODE 306596Figure 9a: Simulation results for zigzag channel mixer with 0 notches
concentration: M&S$ -RAIO- MAXIMUM
& 0.8500 NODE 39985 S MINIMUM oow A3 0.1500 9-%* NODE 15189 velocity: pressure: 40* VEL~OO , TlrK 14W JLM, ý,C NOAL-P ton 240 31.33 AV. 21-0 MAXIMUM A 8.39 NODE 65615 MINIMUM NODE 29801 NODE 29801 Ass1It MAXIMUM NODE 52204 MINIMUM Sa.000 NCIE 312143
Figure 9b: Simulation results for zigzag channel mixer with 1 notches
I-L
pressure:L MIC~ ~·
MASSRAT7J.I MAXIMUM Tilt14 a 0&8501 NODE 39988 0IM Q MINIMUM S W 0.1500 C" NODE I vELOVC' TitE 1,1011 MAXIMUM NODE 863 NODE 61795 Lr MINIMUM NODE 29601 NOIL4APRESSUAE MAXIMU linp L= A 31.17 NODE 2901 460~ MINIMUM 3 00 I N00E 305443000 133 SA?
Figure 9c: Simulation results for zigzag channel mixer with 2 notches
ASSRAIIO.1 MIAXI(U. 1t~ 10 m a 0.8500 NODE 47075 imo MINIMUM oD )o I 0.1500 1sm' NODE 1 MAXIMIMU lit* 14 a 9.534 NODE 63889 tw MINIMUM W *0. 4t4 NODE 29801 13W Nom.•,ssU MAXIMUM ;W WOO A 33.36 NODE 39900 a67 NODE 311072 040
Figure 9d: Simulation results for zigzag channel mixer with 3 notches
,MAPS.R•4LI MAXIMIUM TIE • A 0.8501 NODE 56259 MINIMUM 04M ) 0.1500 G.M 0NODE 1 D 3" NELOCIII TIo 14001 Sressure: MAXIMUM A 9037 NODE 63889 -- o HINIIJH 4W NODE 29G0 r= 04M NOALPIOESSRM MAXIMUH TIM LM A 35M82 NODE 39900 MN HMMUH 20.00 -,:• 13-10 • 0.000 DIV
Figure 9e: Simulation results for zigzag channel mixer with 4 notches
pressure: MUMSSll: AI
EWI.
88 - - -- -- -- A,! -AAU~~~k~~AI·r
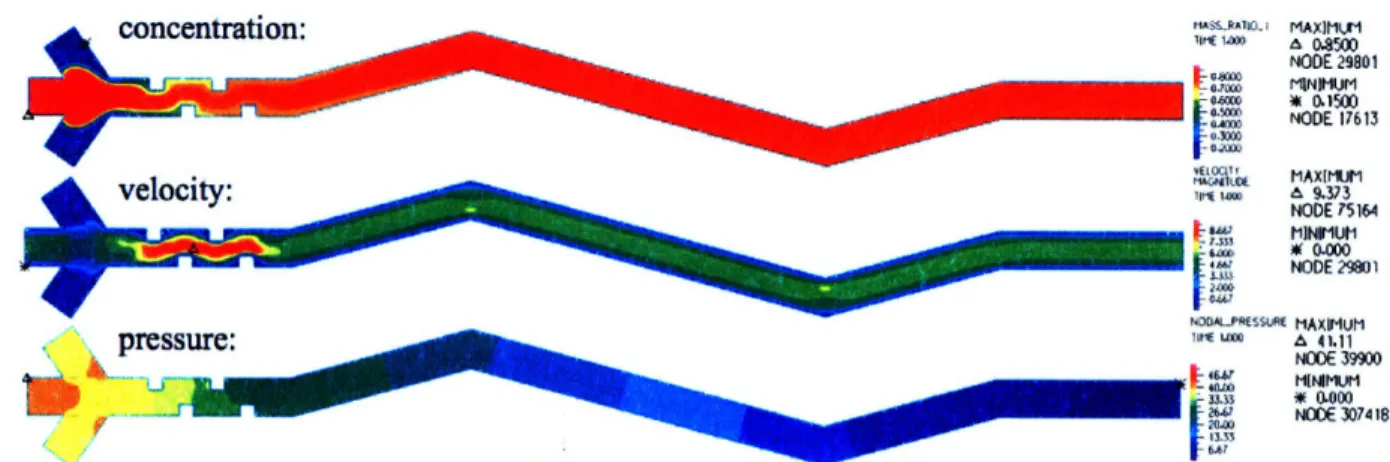
• - ,•,,, -,,• ,- I- ,• wtlASRA110OtlC ~ -,, GAO 0-M $am Tirle 14 NODALP 1 L -14W •"3333 13-" -60 -1 MAX)Mr S08500 NODE 29801 MINDMM * 0 1500 NODE 17613 MAx[MUM A 9.373 NODE 75164 MINIMUM W 0.000 NODE 29801 REssuRE MAIMUM a 41.11 NODE 39900 HINIMUM m 0.000 NODE 307418
Figure 9f: Simulation results for zigzag channel mixer with 4 close notches
MA%..sjojL MAXIMUM Wl l.a0 A -M50 NODE 29801 t.,m MINIMUM oae WE 0.1500 0M NODE 2681 VELCII I K"Wit"t TO 140U MAXIMUMA 9.249 NODE 213564 MINIMUM * 0.000 NODE 29801 RESSURE MAXIMUM A 45.54 NODE 39799 MINIMUM * -0.7127 NODE 341832 1W NODALP •ME l•W 33M 2Wl 20-WQ 13.33
Figure 9g: Simulation results for zigzag channel mixer with 12 notches
concentration:
pressure:
=" ·' ':' ; ·--·- ·· r· i · 14i : r ii;
D
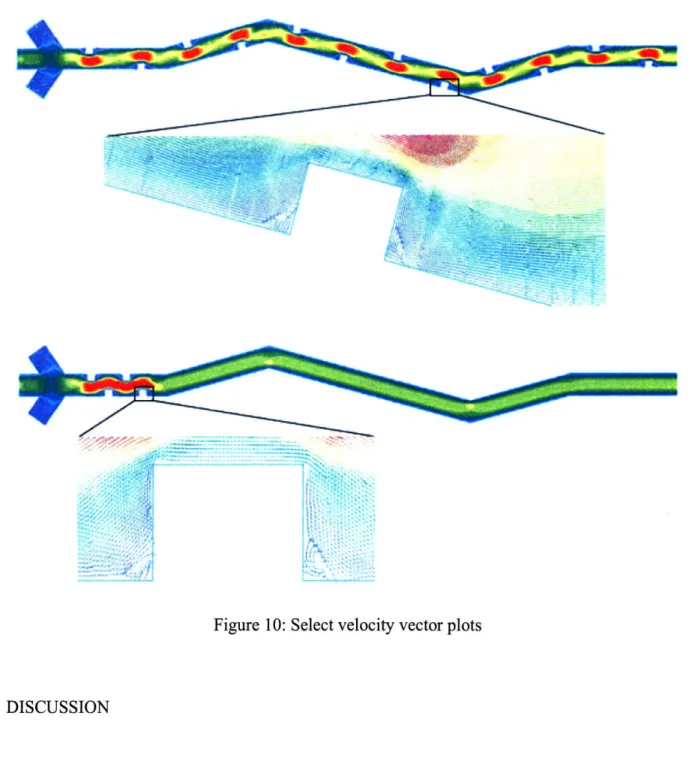
la; · · ~ I; I' ·. ·- ·: ;:,;;·,i· -*~b~LI-l IFigure 10: Select velocity vector plots
DISCUSSION
The CFD results indicate that the addition of obstructing notches and bends in the channel increase mixing quality. The zigzag profile with 12 notches has the highest mixing
quality with a quality value of 0.947 at the end of the channel. Similarly, the straight profile with 0 notches has the lowest mixing quality with a quality value of 0.744 at the end of the channel as
r d S~c~h~~::(:i -:;!:~,,;-: d·,t~ """"·· :-I"-·"': ,i .~:aj~E c~_ ·· i· Ili~_ ;-2·~-: ·-.-:~, V--~-~·· ~~···· ·· · ;·· - ~-~-- ;-~--~·_
shown in Table 2. A trade-off exists, however, between improvements in mixing quality and increases in pressure drop.
The amount and density of notches as well as the overall channel profile all factor into the calculated pressure drop. Differences in pressure drop between zigzag and straight profiles were observed, but show less significance then the number and density of notches. Figure 7 shows the pressure drop for different channel profiles based on the number of added notches. The pressure drop data seems to follow a gradually increasing trend with the number of notches. Channel profile effects pressure drop somewhat. The pressure drop for the zigzag profile is higher then for the straight channel. Notch density also factors into pressure drop significantly. The case of 4 close notches in a zigzag channel shows a higher pressure drop then the similar case of 4 notches in a zigzag channel. The dominant factor in pressure drop appears to be the number and density of added channel obstructions rather than the channel profile. Pressure drop and mixing quality relate inversely, and the challenge is to find the optimal balance between the two.
In each case considered the flow was strictly laminar. The Reynolds numbers based on maximum velocities (an overestimate for actual flow Reynolds numbers which should be based on average flow velocities) range from 650 to 1030. Although the Reynolds numbers are somewhat high, they are well within the laminar regime. The effect of high Reynolds numbers can be noted from the shape of the velocity profile at the outlet in Figures 7 and 8, which is that of a flattened parabola.
Despite the restriction of strictly laminar flow, adjustments to channel geometry improved mixing. Notch obstructions resulted in recirculation regions as seen from the fluid velocity profile shown in Figure 10. These recirculation regions near the base of the notches may
have helped improve mixing efficiency. The notches also cause streamline bending in the fluid that increases the amount interfacial area available for diffusion. In general, velocity profiles
follow the channel geometry, but regions near the base of notches show some vortex formation, which suggests the flow may have entered the vortex flow regime from the stratified laminar regime.
Qualitatively, notches appear to increase mixing efficiency. Figures 7 and 8 have
numerous examples of increased mixing due to a notch obstruction. For instance, Figure 8b of a straight channel with one notch shows that the catalyst on the side of the channel with the notch mixes faster then catalyst on the side of the channel without a notch.
Hydrodynamic focusing of the reactant near the inlet by the two catalyst streams also had a noticeable effect on mixing efficiency. Figures 4 and 5 show a rapid rise in mixing quality near the inlet. Even cases with no notches show a steep rise in mixing close to the inlet. The presence of notches steepened the rise, and the case of dense notches caused the sharpest rise as shown in Figure 5.
Some noticeable deviations from data trends occurred in a few cases. For example, the pressure drop in the case of the straight channel with 4 notches shown in Figure 7 seems to deviate from the gradually increasing trend of the pressure loss data for the other straight channel cases. This deviation may be due to an issue of convergence rather than a physical result.
Discrepancies in the numerical data may be the result of a not fully converged solution. While the segregated solution method used in ADINA-F has some advantages when solving coupled fluid variable problems, it has the disadvantage of possible convergence to a non-physical
full convergence. Running several cases for each channel profile (0 notches, 1 notch, etc.) has the advantage of producing trends that can be used to identify possibly convergence issues in a particular case.
The data trends show that the highest mixing quality comes at the expense of higher pressure drops. Both the zigzag channel with 12 notches and the zigzag channel with 4 close notches produce comparably high mixing qualities: 0.947 and 0.928 respectively, and comparable values for pressure drop: 45.54 kPa and 41.11 kPa respectively. Either of these designs ought to produce similar results if used in the micro steam generator.
CONCLUSION
Overall, CFD provides valuable information to inform the design of a rapid static micromixer for use in a micro steam generator. Hydrodynamic focusing of the reactant and the added obstruction features had the most significant effect on mixing efficiency. Increases in pressure drop and mixing quality depend primarily on the number and density of nubs. The results can be used to decide on the optimal trade-off between mixing quality and pressure drop for the design of the micro steam generator reactant mixing chamber. Subsequent experimental verification of the mixing results will provide useful validation of two-dimensional CFD analysis with mass transfer in ADINA-F. With increased computing ability, a full three-dimensional
analysis could be conducted that would likely provide more physically accurate results, particularly for pressure drop values.
ACKNOWLEDGEMENTS
The author gratefully acknowledges the contributions of Professor Carol Livermore and Feras Eid, who motivated and advised this research. The author also acknowledges the valuable consultations of Jared Ahern on numerical analysis in ADINA. Finally, the author recognizes Professor Klaus-Jurgen Bathe and ADINA R&D Inc. for providing the ADINA software license used in this study.
REFERENCES
1. Z. Yang, S. Matsumoto, H. Goto, M. Matsumoto, R. Maeda, Ultrasonic micromixerfor
microfluidic systems, Sensors and Actuators A 2001, vol. 93, pp. 266-272.
2. V. Mengeaud, J. Josserand, H. H. Girault, Mixing Processes in a Zigzag Microchannel: Finite
Element Simulations and Optical Study, Anal. Chem. 2002, vol. 74, pp. 4279-4286.
3. S. H. Wong, P. Bryant, M. Ward, C. Wharton, Investigation of mixing in a cross-shaped
micromixer with static mixing elements for kinetics studies, Elsevier, Sensors and Actuators B
2003, vol. 95, pp. 414-424.
4. A. S. Rawool, S. K. Mitra, S. G. Kandlikar, Numerical simulation offlow through
microchannels with designed roughness, Microfluid Nanofluid, Springer-Verlag, 2005.
5. M. Engler, N. Kockmann, T. Kiefer, P. Woias, Numerical and experimental investigations on
liquid mixing in static micromixers, Chemical Engineering Journal 2004, vol. 101, pp.
315-322.
6. N. Kockmann, C. Foll, P. Woias, Flow regimes and mass transfer characteristics in static
micro mixers, Microfluidics, BioMEMS, and Medical Microsystems, Proceedings of SPIE
2003, vol. 4982, pp. 319-329.
7. S. H. Wong, M. C. L. Ward, C. W. Wharton, Micro T-mixer as a rapid mixing micromixer, Elsevier, Sensors and Actuators B 2004, vol. 100, pp. 359-379.
8. D. Gobby, P. Angeli, A. Gavriilidis, Mixing characteristics of T-type microfluidic mixers, Institute of Physics Publishing, Journal of Micromechanics and Microengineering 2001, vol. 11, pp. 126-132.
9. K. J. Bathe, J. Dong, Solutions of incompressible viscous fluidflow with heat transfer using
10. K. J. Bathe, H. Zhang, M. H. Wang, Finite element analysis of incompressible and
compressible fluid flows, Computers and Structures 1995, vol 56/3, pp. 193-213.
11. ADINA Theory and Modeling Guide Vol. III: ADINA CFD and FSI, ADINA R&D Inc.,