HAL Id: hal-02089383
https://hal.archives-ouvertes.fr/hal-02089383
Submitted on 23 Nov 2020HAL is a multi-disciplinary open access archive for the deposit and dissemination of sci-entific research documents, whether they are pub-lished or not. The documents may come from teaching and research institutions in France or abroad, or from public or private research centers.
L’archive ouverte pluridisciplinaire HAL, est destinée au dépôt et à la diffusion de documents scientifiques de niveau recherche, publiés ou non, émanant des établissements d’enseignement et de recherche français ou étrangers, des laboratoires publics ou privés.
Cold atmospheric plasma-induced acidification of tissue
surface: visualization and quantification using agarose
gel models
Giovanni Busco, Azadeh Valinataj Omran, Loick Ridou, Jean-Michel
Pouvesle, Eric Robert, Catherine Grillon
To cite this version:
Giovanni Busco, Azadeh Valinataj Omran, Loick Ridou, Jean-Michel Pouvesle, Eric Robert, et al.. Cold atmospheric plasma-induced acidification of tissue surface: visualization and quantification using agarose gel models. Journal of Physics D: Applied Physics, IOP Publishing, 2019, 52 (24), pp.24LT01. �10.1088/1361-6463/ab1119�. �hal-02089383�
1 Cold atmospheric plasma-induced acidification of tissue surface: visualization and 1
quantification using agarose gel models 2
3 4
Giovanni Busco1, Azadeh Valinataj Omran2, Loïck Ridou1, Jean-Michel Pouvesle2, Eric
5
Robert2 and Catherine Grillon1
6
1Centre de Biophysique Moléculaire, UPR4301CNRS, 45071 Orléans, France
7
2GREMI, UMR 7344 CNRS/University of Orléans, 45067 Orléans, France
8 9
ABSTRACT 10
11
The biological effects induced by cold atmospheric plasmas (CAPs) on human tissues are 12
mainly due to the production of reactive oxygen and nitrogen species (RONS). Some RONS 13
are also responsible for pH lowering of the treated medium. The CAP-induced acidification 14
has beneficial effect on biological tissues, contributing to the anti-bacterial effect and to the 15
healing improvement observed in treated wound. In this work we investigated the local 16
acidification induced by a helium CAP treatment using tissue models made of agarose gels 17
with adjusted pH around 7.4 to mimic generic organs or around 5.5 to simulate skin surface 18
pH. Using fluorescein as a pH-sensitive fluorescent marker, we developed a useful technique 19
to visualize and quantify the local acidification induced by CAP exposure of tissue surface. 20
The different capillaries used to produce the plasma jet, the treatment time, the initial pH of 21
the surface and the buffer capacity of the tissue model were shown to modulate both the size 22
of the impacted surface and the intensity of the pH decrease. The proposed technique can 23
be advantageous to study the acidifying effect induced by plasma. This method can help to 24
plan safe and controlled plasma treatments in order to avoid hyper-acidification of the tissue, 25
especially when a localized treatment is administered. 26
27 28
Keywords: plasma, CAP, pH measurement, fluorescence, fluorescein, agarose model 29
2 Today cold plasmas generated at atmospheric pressure (CAPs) are extensively exploited for 30
biomedical applications [1, 2]. Dermocosmetic research is one of the most promising fields of 31
plasma medicine [3]. The encouraging results obtained in wound disinfection and healing 32
and the easy accessibility of this external organ, make the skin a privileged target for plasma 33
treatments [4]. In dermatology, CAPs have been already employed in clinical trials to treat 34
mainly infected wounds. Their use for cosmetic purposes is much more recent and still at the 35
research level. For this type of application, the safety of treatment conditions is primordial 36
and requires various in vitro studies before passing to in vivo treatments. Several models 37
have been proposed to mimic and study the skin properties in vitro [5]. Among these, gelatin 38
and agarose are the most used for plasma treatments [6, 7]. The biological effect of CAPs 39
reside mostly in RONS production. Quantification and distribution of these species inside the 40
target is crucial to plan the convenient plasma treatment. RONS detection in liquids is 41
commonly performed in liquids thanks to the plethora of commercially available probes. 42
Conversely, direct RONS quantification inside semi-solid targets like gelatin or agarose is 43
more complex. Kawasaki and collaborators employed the iodine test (KI-starch) to visualize 44
RONS generation in agarose upon CAP treatment [8]. Dobrynin and colleagues, used 45
agarose gel to visualize the penetration depth of plasma-generated hydrogen peroxide and, 46
in the same work, they used fluorescein added to agarose gel to demonstrate the plasma-47
induce pH decrease inside the target [6]. CAP-induced acidification in media is a known 48
effect, the pH drop is being mainly due to the generation of acid species like nitrous and nitric 49
acid [9, 10]. The acidification degree depends on CAP parameters (frequency, gas flow rate 50
and exposure time) and on the buffer capacity of the medium. CAP treatment has been 51
shown to significantly increase acidification of skin [11]. Today, to measure skin pH, pH-52
meters with flat electrodes are conveniently used [12]. Although these instruments give 53
precise measurements of pH, the recorded value is the average of the hydrogen ion 54
concentration on the whole surface underneath the electrode, i.e. at least one centimeter 55
square. When a tissue is treated with a plasma-jet, the CAP impacted zone is exposed to 56
the highest concentration of chemical species. In such “focalized” treatments, the pH on the 57
exposed area can dramatically decrease generating chemical burns and permanent 58
damages. Understanding how CAP generated species are delivered in an organ or in intact 59
skin is of a crucial importance in order to propose a safe treatment. In this work we used 60
agarose gels as models to mimic human tissues. Two models with different pH were used: 61
one having a pH around 7.4 to mimic most of human tissues and the other having a pH 62
around 5.5 to simulate the outer layers of the skin. In order to visualize and quantify the local 63
acidification induced by CAP in these models, we pre-mixed fluorescein to the agarose gels. 64
We took advantage of the fluorophore fluorescein for its well-known pH-dependent 65
fluorescence [13-15]. In fact, fluorescein coupled to gelatin was previously used to measure 66
localized acidification induced by cancer cells in Matrigel® [16]. Thanks to its very low 67
toxicity, fluorescein can also be used as an internal tracer in human body and has been 68
proposed for the non-invasive measurement of retinal pH [17]. Concerning plasma, an 69
attempt to qualitatively demonstrate the pH drop induced by CAP in fluorescein-containing 70
agarose was formerly done [6] but the precise extend of pH decrease and the impacted area 71
remain to be studied. 72
In this work, we used sodium fluorescein imbedded in a 2% agarose gel to mimic human 73
tissues. Agarose was dissolved either on a physiologic saline solution (NaCl 150mM) or in a 74
slightly buffered saline solution (NaCl 150 mM, HEPES 5.5 mM). The buffered or non-75
3 buffered solutions were adjusted to different pH. Six solutions with pH ranging from 7.4 to 2.5 76
were used for establishment of the calibration curve. After adding agarose (2%) and 77
fluorescein (50µM) to each solution, the resulting mixtures were gently heated in a 78
microwave and poured in 6-well plates. The volume was calculated in order to get a 2 mm 79
thick gels in each well. The fluorescent gel at pH around 7.4 was used as a model for generic 80
organ while the gel pH 5.5 was used as a skin model [18]. Plasma treatment was carried out 81
using the previously described helium Plasma Gun device [19, 20] already assessed for in 82
vivo experiments [21].
83
To study the impact of the jet on the plasma exposed target, two different glass capillaries 84
were used: a straight capillary with an internal diameter of 4 mm and a capillary having a 85
tapered extremity with an inner diameter of 1.5 mm. The tip of the capillary was set at 10 mm 86
above the gel surface. Each treatment was performed for 120s or 300s, at a frequency of 1 87
kHz and a helium gas flow rate set at 0.5 L/min. For each experiment, three fluorescence 88
intensity images of the agarose-containing wells were acquired: before the treatment, 89
immediately after plasma exposure and 10 min after plasma exposure, using the Typhoon™ 90
FLA 9500 biomolecular imager (GE Healthcare Life Science) equipped with a 473 nm (blue 91
LD laser) and a Y520 emission filter (wavelength range ≥ 520 nm). High quality pictures 92
were acquired with a pixel size of 100 µm. Images were exported and processed in ImageJ. 93
Real dimension of the 8-Bit grey scale images were assigned in mm units using the set scale 94
function. The background variations and the drift of fluorescence that can occur during the 95
three consecutive scans were measured and corrected. For a qualitative and visual analysis 96
of the acidification induced by plasma, images were converted in pseudocolors using the 97
ICA3 option in Lookup Tables. The fluorescence intensity of the 6 wells was quantified and 98
the measured integrated density values were assigned to the known pH values. A calibration 99
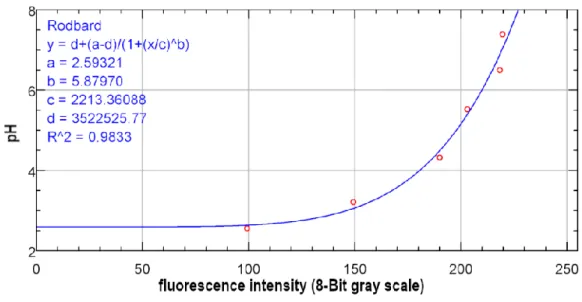
curve of the gray scale values vs pH was obtained using the roadboard function (Figure 1). 100
To measure pH evolution before and after the treatment in our models, a straight line 101
selection of 18-22 mm, passing through the center of the treated area, was manually traced. 102
A plot profile of fluorescence intensity showing pH variations along the traced line was 103
obtained. Data from each plot profile can be exported in excel or other spreadsheet software 104
for further analysis. In this paper we used the software GraphPad Prism version 6 and GIMP 105
for chart and figure design respectively. 106
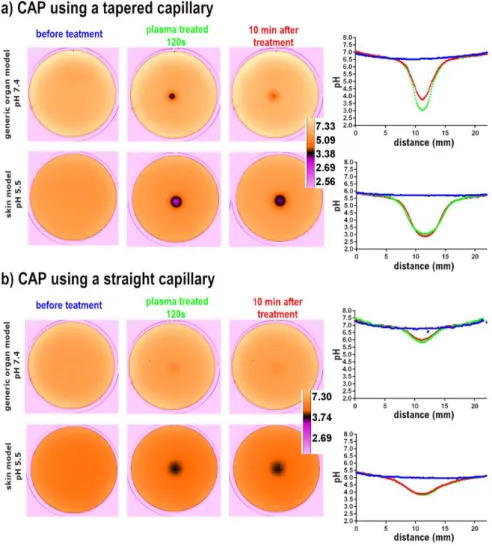
The effect of CAP treatment on pH modulation was first studied in agarose gel without buffer 107
capacity. Non-buffered agar models mimicking generic organs (pH 7.4) or skin (pH 5.5) were 108
treated for 120s with plasma-gun using either a straight or a tapered capillary (Figure 2). 109
When a tapered capillary was used, the thin plasma jet (diameter ˂ 1mm) induces a focalized 110
pH drop (Figure 2a) either in the generic organ (4 pH units) or in the skin model (3 pH units). 111
Interestingly, the pH dropped to a value around 3 either in the neutral or in the already acidic 112
model. It is known that during plasma treatment one of the acidic species produced is nitrous 113
acid. This weak acid has a pKa 3.16 [22]. We can speculate that the nitrous acid locally 114
produced creates a buffer at pH 3 keeping the pH more stable around this value when a 115
short treatment is administered. A similar pH drop, in a non-buffered saline, was already 116
showed by Hänsch et al; at this pH values, plasma treated solution has been shown to exert 117
a potent bactericidal effect [23]. When the straight capillary was used (Figure 2b), the larger 118
plasma jet led to a minor and uniform acidification in the generic organ and the skin model (1 119
pH units in both cases). In all the treatments, very slight pH variations were registered 10 min 120
4 after plasma exposure. We measured the diameter of the acidified surface generated with 121
the two capillaries. The skin model, exposed to the jet generated by the tapered capillary, 122
shows an acidified surface with a diameter 1.5 times larger than the one measured on the 123
generic organ model (12 mm vs 8 mm) and 2 times larger (12 mm vs 6 mm) when the 124
straight capillary is used. It appears that the acidic species spreads better in the already 125
acidic model. 126
The observed acidification could overestimate the real acidifying effect induced by CAP on 127
human tissues. In fact, human organs possess buffer systems that offset pH variations to 128
maintain physiological values [24]. The skin, in its outer layers possesses its own buffer 129
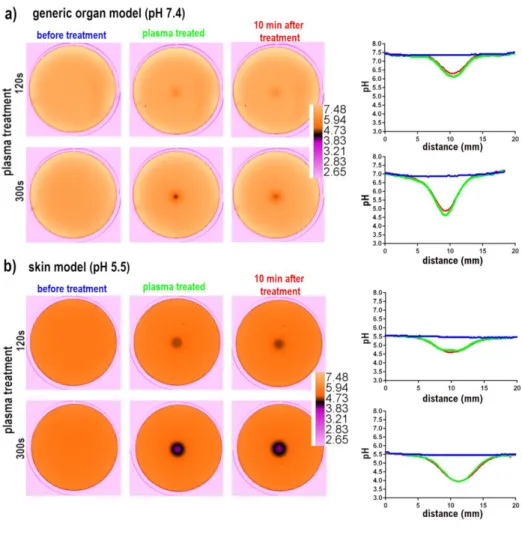
system [25]. In order to improve our models, we prepared fluorescein-containing gels with a 130
HEPES-based buffer system. In figure 3, buffered-fluorescent agarose models were 131
exposed to CAP using the tapered capillary. When the buffered gel was exposed for 120s to 132
plasma treatment, we measured a minor pH decrease respect the one measured previously 133
in the non-buffered agarose. The generic organ model (figure 3a) shows a drop of just 1.5 pH 134
units while the skin model decreases its pH of 1 pH units (fig. 3b) . A longer treatment of 135
300s results in a higher pH decrease in the generic organ model (2.5 pH units) and a weaker 136
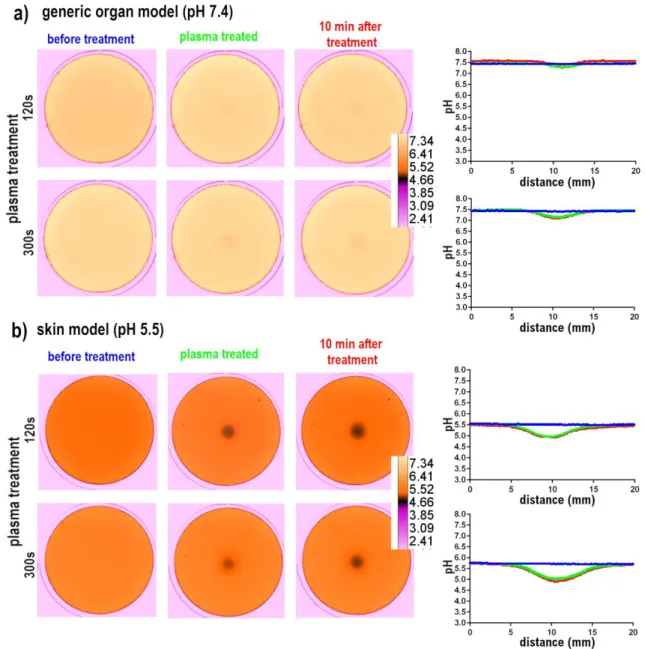
decrease in the skin model (1.5 pH units). In figure 4, we exposed agarose models to 137
plasma, using a straight capillary. When the buffered-generic organ model was exposed to 138
the jet generated with this capillary, we observed almost no pH variation for the short 139
treatment of 120s and a very little pH drop, less than 0.5 pH units, for the longer treatment of 140
300s (Figure 4a). The treatment of the skin model using the straight capillary (Figure 4b) 141
results in a pH drop, around 0.5 and 1 pH units for short and long CAP treatment 142
respectively, the measured acidification appearing weaker compared to the one observed 143
using the tapered capillary. As observed in the non-buffered system, the treatment of the skin 144
model results in a wider acidified surface, on average 1.4 times larger (9.7 mm vs 6.7 mm). 145
In conclusion, the presented method permits not only to visualize in situ acidification but also 146
to quantify the pH changes, in the range of 2.5 to 7.4 pH units. Although the described 147
method can have some limitations and weakness, it offers the advantage of measuring the 148
pH on a very small spot. To date the precise measurement of these limited surfaces using 149
flat pH-meters is not possible. These pH-meters, whose smaller probe surface is around 1 150
cm2, can only give a pH mean value of the whole covered surface. We demonstrated here
151
that this novel technique can help understanding the impact of a plasma treatment on a 152
biological tissue to better plan in vivo plasma therapy. In fact, these results show how 153
different parameters such as the capillary shape, the treatment time, the initial pH and the 154
buffer capacity of the tissue model can influence the plasma-induced acidification in a treated 155
tissue. Particularly, the diameter of the plasma jet was shown to induce an impact on the 156
acidic species distribution on the treated surface, suggesting that large jet can be used to 157
have a diffuse and uniform treatment while thin jets can be useful to focalize the treatment 158
without disturbing the surrounding tissue pH. 159
160
Aknowledgments 161
This work was supported by Cosmetosciences, a global training and research program 162
dedicated to the cosmetic industry, located in the heart of the Cosmetic Valley, this program 163
led by University of Orléans is funded by the Région Centre-Val de Loire, France. Giovanni 164
5 Busco, Azadeh Valinataj Omran and Loïck Ridou are supported by 165
Cosmetosciences (PLASMACOSM Project, Grant 2015-00103497). This work was 166
performed in the frame of the French CNRS networks, GDR2025 HAPPYBIO and GDR3711 167
Cosmactifs. The authors thank Dr Endré Szili, University of South Australia, for stimulating 168
discussions during the Expert Days funded by Le Studium 169
170 171 172
1. Laroussi, M. and X. Lu, Room-temperature atmospheric pressure plasma plume for 173
biomedical applications. Applied Physics Letters, 2005. 87(11): p. 113902.
174
2. Kong, M.G., et al., Plasma medicine: an introductory review. New Journal of Physics, 175
2009. 11(11): p. 115012. 176
3. Heinlin, J., et al., Plasma applications in medicine with a special focus on 177
dermatology. J Eur Acad Dermatol Venereol, 2011. 25(1): p. 1-11.
178
4. Haertel, B., et al., Non-thermal atmospheric-pressure plasma possible application in 179
wound healing. Biomol Ther (Seoul), 2014. 22(6): p. 477-90.
180
5. Dąbrowska, A.K., et al., Materials used to simulate physical properties of human skin. 181
Skin Research and Technology, 2016. 22(1): p. 3-14. 182
6. Dobrynin, D., et al., Deep Penetration into Tissues of Reactive Oxygen Species 183
Generated in Floating-Electrode Dielectric Barrier Discharge (FE-DBD): An <i>In
184
Vitro</i> Agarose Gel Model Mimicking an Open Wound. 2012. 2(1-3): p. 71-83.
185
7. Szili, E.J., et al., Tracking the Penetration of Plasma Reactive Species in Tissue 186
Models. Trends in Biotechnology, 2018. 36(6): p. 594-602.
187
8. Kawasaki, T., et al., Visualization of the Distribution of Oxidizing Substances in an 188
Atmospheric Pressure Plasma Jet. IEEE Transactions on Plasma Science, 2014.
189
42(10): p. 2482-2483. 190
9. Chen, C.-W., H.-M. Lee, and M.-B. Chang, Influence of pH on inactivation of aquatic 191
microorganism with a gas–liquid pulsed electrical discharge. Journal of Electrostatics,
192
2009. 67(4): p. 703-708. 193
10. Oehmigen, K., et al., The Role of Acidification for Antimicrobial Activity of 194
Atmospheric Pressure Plasma in Liquids. Plasma Processes and Polymers, 2010.
195
7(3‐4): p. 250-257. 196
11. Heuer, K., et al., The topical use of non-thermal dielectric barrier discharge (DBD): 197
nitric oxide related effects on human skin. Nitric Oxide, 2015. 44: p. 52-60.
198
12. du Plessis, J.L., A.B. Stefaniak, and K.P. Wilhelm, Measurement of Skin Surface pH. 199
Curr Probl Dermatol, 2018. 54((pH of the Skin: Issues and Challenges)): p. 19-25. 200
13. Emmart, E.W., Observations on the absorption spectra of fluorescein, fluorescein 201
derivatives and conjugates. Archives of Biochemistry and Biophysics, 1958. 73(1): p.
202
1-8. 203
14. Leonhardt, H., L. Gordon, and R. Livingston, Acid-base equilibriums of fluorescein 204
and 2',7'-dichlorofluorescein in their ground and fluorescent states. The Journal of
205
Physical Chemistry, 1971. 75(2): p. 245-249. 206
15. Martin, M.M. and L. Lindqvist, The pH dependence of fluorescein fluorescence. 207
Journal of Luminescence, 1975. 10(6): p. 381-390. 208
16. Busco, G., et al., NHE1 promotes invadopodial ECM proteolysis through acidification 209
of the peri-invadopodial space. FASEB J, 2010. 24(10): p. 3903-15.
210
17. Martin, H., et al., Sodium fluorescein as a retinal pH indicator? Physiological 211
Measurement, 2005. 26(4): p. N9. 212
18. Mauro, T., et al., Barrier recovery is impeded at neutral pH, independent of ionic 213
effects: implications for extracellular lipid processing. Archives of Dermatological
214
Research, 1998. 290(4): p. 215-222. 215
19. Robert, E., et al., Characterization of pulsed atmospheric-pressure plasma streams 216
(PAPS) generated by a plasma gun. Plasma Sources Science and Technology, 2012.
217
21(3): p. 034017. 218
6 20. Busco, G., et al., Changes in Oxygen Level Upon Cold Plasma Treatments:
219
Consequences for RONS Production IEEE Trans Radiat Plasma Med Sci., 2018.
220
2(2): p. 147-152. 221
21. Collet, G., et al., Plasma jet-induced tissue oxygenation: potentialities for new 222
therapeutic strategies. Plasma Sources Science and Technology, 2014. 23(1): p.
223
012005. 224
225
22. da Silva, G., E.M. Kennedy, and B.Z. Dlugogorski, Ab Initio Procedure for Aqueous-226
Phase pKa Calculation: The Acidity of Nitrous Acid. The Journal of Physical
227
Chemistry A, 2006. 110(39): p. 11371-11376. 228
23. Hänsch, M.A.C., et al., Analysis of antibacterial efficacy of plasma-treated sodium 229
chloride solutions. Journal of Physics D: Applied Physics, 2015. 48(45): p. 454001
230
24. Hamm, L.L., N. Nakhoul, and K.S. Hering-Smith, Acid-Base Homeostasis. Clinical 231
journal of the American Society of Nephrology : CJASN, 2015. 10(12): p. 2232-2242. 232
25. Zhai, H., et al., Measuring human skin buffering capacity: an in vitro model. Skin 233
Research and Technology, 2009. 15(4): p. 470-475. 234 235 236 FIGURES 237 238 239 240 241
Figure 1. A typical roadboard calibration curve of fluorescein fluorescence intensity
242vs pH obtained in ImageJ.
243 244 245 2467 247 248 249 250 251
Figure 2. Non-buffered fluorescent agarose gels, with initial physiological around 7.4 or 5.5, treated 252
with CAP using a tapered (a) or a straight capillary (b) to generate the plasma-jet. The fluorescence 253
emission of the agarose gel was acquired as 8-Bit gray scale images and converted in ICA3 254
pseudocolor to better visualize the acidified area, the pH pseudocolor calibration bar is shown on the 255
right of the images. On the right part of the figure the pH plots graphs measured before (blue trace), 256
immediately after plasma treatment (green trace) and 10 min after plasma treatment (red trace) 257
258 259
8 260
261
Figure 3. Buffered fluorescent agarose gels mimicking a generic organ pH (a) or skin (b) treated with 262
CAP for 120s or 300s using a tapered capillary to generate the plasma-jet. The fluorescence emission 263
of the agarose gel was acquired as 8-Bit gray scale images and converted in ICA3 pseudocolor to 264
better visualize the acidified area, the pH pseudocolor calibration bar is shown on the right of the 265
images. On the right part of the figure the pH plots graphs measured before (blue trace), 266
immediately after (green trace) and 10 min after plasma treatment (red trace) 267
268 269
9 270
Figure 4. Buffered fluorescent agarose gels mimicking a generic organ pH (a) or skin (b) treated with 271
CAP for 120s or 300s using a straight capillary to generate the plasma-jet. The fluorescence emission 272
of the agarose gel was acquired as 8-Bit gray scale images and converted in ICA3 pseudocolor to 273
better visualize the acidified area, the pH pseudocolor calibration bar is shown on the right of the 274
images On the right part of the figure the pH plots graphs measured before (blue trace), immediately 275
after (green trace) and 10 min after plasma treatment (red trace) 276
277 278 279 280
10 281