HAL Id: inserm-00923318
https://www.hal.inserm.fr/inserm-00923318
Submitted on 2 Jan 2014
HAL is a multi-disciplinary open access
archive for the deposit and dissemination of
sci-entific research documents, whether they are
pub-lished or not. The documents may come from
teaching and research institutions in France or
abroad, or from public or private research centers.
L’archive ouverte pluridisciplinaire HAL, est
destinée au dépôt et à la diffusion de documents
scientifiques de niveau recherche, publiés ou non,
émanant des établissements d’enseignement et de
recherche français ou étrangers, des laboratoires
publics ou privés.
Matthias Zingg, Christoph Rüst, Thomas Rosemann, Romuald Lepers, Beat
Knechtle
To cite this version:
Matthias Zingg, Christoph Rüst, Thomas Rosemann, Romuald Lepers, Beat Knechtle. Analysis of
swimming performance in FINA World Cup long-distance open water races.. Extreme Physiology &
Medicine, 2014, 3 (1), pp.2. �10.1186/2046-7648-3-2�. �inserm-00923318�
R E S E A R C H
Open Access
Analysis of swimming performance in FINA World
Cup long-distance open water races
Matthias Alexander Zingg
1, Christoph Alexander Rüst
1, Thomas Rosemann
1, Romuald Lepers
2and Beat Knechtle
3*Abstract
Background: Age and peak performance in ultra-endurance athletes have been mainly investigated in long-distance runners and triathletes, but not for long-distance swimmers. The present study investigated the age and swimming performance of elite ultra-distance swimmers competing in the 5-, 10- and 25-km Fédération Internationale de Natation (FINA) World Cup swimming events.
Methods: The associations of age and swimming speed in elite male and female swimmers competing in World Cup events of 5-, 10- and 25-km events from 2000 to 2012 were analysed using single and multi-level regression analyses. Results: During the studied period, the swimming speed of the annual top ten women decreased significantly from 4.94 ± 0.20 to 4.77 ± 0.09 km/h in 5 km and from 4.60 ± 0.04 to 4.44 ± 0.08 km/h in 25 km, while it significantly
increased from 4.57 ± 0.01 to 5.75 ± 0.01 km/h in 10 km. For the annual top ten men, peak swimming speed decreased significantly from 5.42 ± 0.04 to 5.39 ± 0.02 km/h in 5 km, while it remained unchanged at 5.03 ± 0.32 km/h in 10 km and at 4.94 ± 0.35 km/h in 25 km. The age of peak swimming speed for the annual top ten women remained stable at 22.5 ± 1.2 years in 5 km, at 23.4 ± 0.9 years in 10 km and at 23.8 ± 0.9 years in 25 km. For the annual top ten men, the age of peak swimming speed increased from 23.7 ± 2.8 to 28.0 ± 5.1 years in 10 km but remained stable at 24.8 ± 1.0 years in 5 km and at 27.2 ± 1.1 years in 25 km.
Conclusion: Female long-distance swimmers competing in FINA World Cup races between 2000 and 2012 improved in 10 km but impaired in 5 and 25 km, whereas men only impaired in 5 km. The age of peak performance was younger in women (approximately 23 years) compared to men (about 25–27 years).
Keywords: Swim, Peak performance, Speed, Age of peak performance Background
The popularity of professional sports is mainly based on the need of stars or super-humans the average person can admire. In individual sports, record marks as finishing times are of main interest. In swimming, several new world records were set in recent years. Open water long-distance swimming is a rather young sports discipline since the first World Championship over 10 km was held in 1991. Since 1986, a World Cup is held annually in several different countries. The Fédération Internationale de Natation (FINA) [1] does not hold official world records for open water long-distance swimming since weather [2] and water conditions [3] can considerably affect race time in open water long-distance swimming. Open water long-distance
swimming can be held with or without wetsuits [4] depend-ing on the length, the water temperature and the individual event. The first long-distance open water swimming event to be introduced in the Olympic Games was the 10 km in Beijing 2008 [5]. However, since water temperatures and weather cannot be influenced in long-distance open water swimming, even finisher times in Olympic Games can hardly be compared.
The age in life when peak performance in sport is accomplished was an often-discussed topic [6-10] as it may predict the point in life when athletic performance starts to decline. In swimming, the age of peak performance has been investigated for freestyle pool swimmers across distances from 50 to 1,500 m [6-10] and for long-distance swims of 26.4 km [11] and 34 km [12] held in open water. In these studies, different findings have been reported for the different distances. Berthelot et al. [6] reported the age * Correspondence:beat.knechtle@hispeed.ch
3Facharzt FMH für Allgemeinmedizin, Gesundheitszentrum St. Gallen, Vadianstrasse 26, St. Gallen, 9001 Switzerland
Full list of author information is available at the end of the article
© Zingg et al.; licensee BioMed Central Ltd. This is an Open Access article distributed under the terms of the Creative Commons Attribution License (http://creativecommons.org/licenses/by/2.0), which permits unrestricted use, distribution, and reproduction in any medium, provided the original work is properly cited. The Creative Commons Public Domain Dedication waiver (http://creativecommons.org/publicdomain/zero/1.0/) applies to the data made available in this article, unless otherwise stated.
5 km Year Number of Finishes 0 225 200 175 150 125 100 75 80 70 60 50 40 30 20 10 0 50 25 0 25 50 75 100 125 150 Women Men Total 2000 2001 2002 2003 2004 2005 2006 2007 2008 2009 2010 2011 2012 2000 2001 2002 2003 2004 2005 2006 2007 2008 2009 2010 2011 2012 2000 2001 2002 2003 2004 2005 2006 2007 2008 2009 2010 2011 2012
A
B
C
10 km Year Number of Finishes 25 km Year Number of Finishesof peak swimming performance at approximately 21 years for freestyle swimmers. However, there seemed to be differences in the age of peak swimming speed regarding the length of a swimming performance [9] and the performance level of the athletes [11-13]. Schulz and Curnow [9] reported for professional swimmers that the fastest times in 1,500-m freestyle were achieved at a younger age of about 18 years compared to 50-m freestyle at about 23 years of Berthelot et al. [6] who also investi-gated professionals in Olympic sport events. Fairbrother [8] investigated US master swimmers and reported that the age of peak swimming speed in 50-m freestyle was in the late 20s and early 30s for men, and at a considerably higher age than reported by Berthelot et al. [6].
The age of peak swimming performance seemed to be dependent upon the race distance. The age of peak swimming speed seemed to decrease with increasing race distance from 50 to 1,500 m and to increase thereafter for longer events and/or distances such as 26.4 km, 12 h
and 35 km [10-13]. Recent studies of Eichenberger et al. [11-13] showed that the age of peak performance for long-distance swimmers competing from 26.4 to 35 km was at approximately 30–39 years for both sexes. However, all investigated events were of non-professional nature, where recreational athletes were competing. This raises the question whether the reported increase of the age of peak swimming speed could be due a selection bias of non-professionalism of athletes in these events since studies investigating pool swimmers mainly used elite athletes. Furthermore, ‘The English Channel Swim’ [12] is even not a race as swimmers have to cross the English Channel solo with the help of a personal support crew.
Recent findings suggested that the age of peak swimming speed in elite freestyle swimmers seemed to increase with increasing race distance of more than 1,500-m length [6,9]. Furthermore, the age of the fastest swimmers seemed to increase across years and with increasing length of the race [6,9]. Most authors [6-10] investigated professional athletes
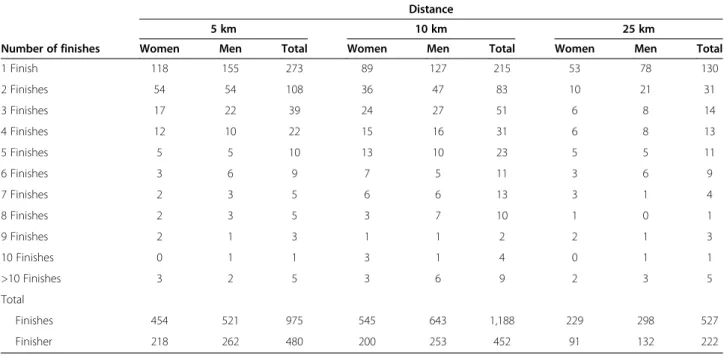
Table 1 Number of finishes and multiple finishes for long-distance swimmers in 5, 10 and 25 km
Distance
5 km 10 km 25 km
Number of finishes Women Men Total Women Men Total Women Men Total
1 Finish 118 155 273 89 127 215 53 78 130 2 Finishes 54 54 108 36 47 83 10 21 31 3 Finishes 17 22 39 24 27 51 6 8 14 4 Finishes 12 10 22 15 16 31 6 8 13 5 Finishes 5 5 10 13 10 23 5 5 11 6 Finishes 3 6 9 7 5 11 3 6 9 7 Finishes 2 3 5 6 6 13 3 1 4 8 Finishes 2 3 5 3 7 10 1 0 1 9 Finishes 2 1 3 1 1 2 2 1 3 10 Finishes 0 1 1 3 1 4 0 1 1 >10 Finishes 3 2 5 3 6 9 2 3 5 Total Finishes 454 521 975 545 643 1,188 229 298 527 Finisher 218 262 480 200 253 452 91 132 222
Table 2 Swimming speed and age of the fastest swimmers
Distance (km) Annual fastest Annual ten fastest
Women Men Women Men
Peak swimming speed (m/s) 5 5.1 ± 0.2 5.5 ± 0.2 5.0 ± 0.2 5.4 ± 0.2
10 5.1 ± 0.3 5.4 ± 0.2 5.0 ± 0.3 5.4 ± 0.2
25 4.6 ± 0.3 5.0 ± 0.3 4.5 ± 0.3 4.9 ± 0.3
Age of peak swimming speed (years) 5 22.4 ± 4.6 26.7 ± 3.7 22.5 ± 1.2 24.8 ± 1.0
10 24.1 ± 4.6 25.6 ± 4.7 23.4 ± 0.9 25.6 ± 1.6
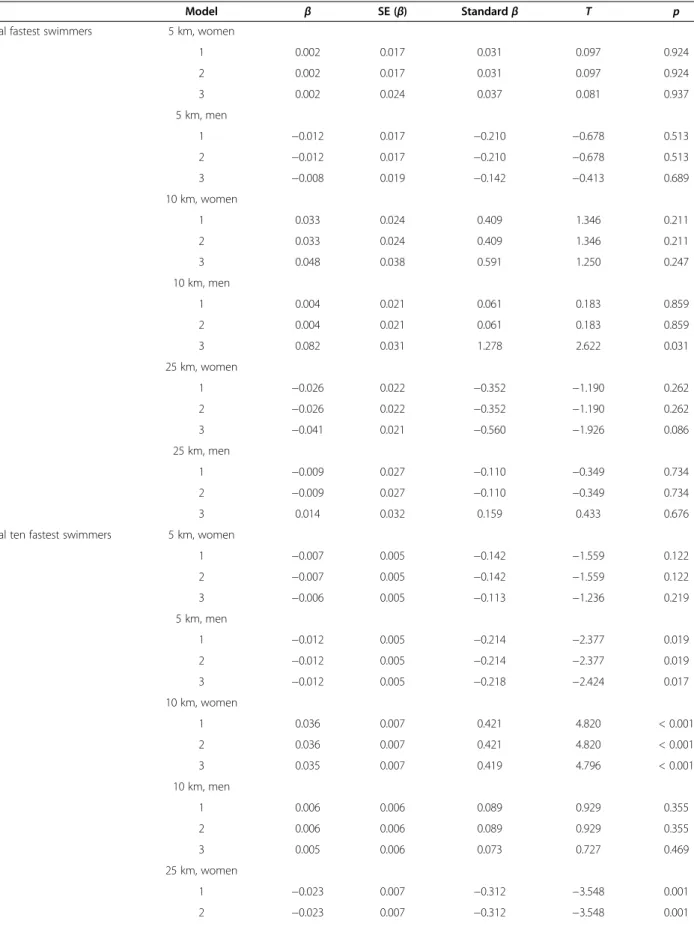
Table 3 Multi-level regression analyses for swimming speed of the annual fastest swimmers and the annual ten fastest swimmers
Model β SE (β) Standard β T p
Annual fastest swimmers 5 km, women
1 0.002 0.017 0.031 0.097 0.924 2 0.002 0.017 0.031 0.097 0.924 3 0.002 0.024 0.037 0.081 0.937 5 km, men 1 −0.012 0.017 −0.210 −0.678 0.513 2 −0.012 0.017 −0.210 −0.678 0.513 3 −0.008 0.019 −0.142 −0.413 0.689 10 km, women 1 0.033 0.024 0.409 1.346 0.211 2 0.033 0.024 0.409 1.346 0.211 3 0.048 0.038 0.591 1.250 0.247 10 km, men 1 0.004 0.021 0.061 0.183 0.859 2 0.004 0.021 0.061 0.183 0.859 3 0.082 0.031 1.278 2.622 0.031 25 km, women 1 −0.026 0.022 −0.352 −1.190 0.262 2 −0.026 0.022 −0.352 −1.190 0.262 3 −0.041 0.021 −0.560 −1.926 0.086 25 km, men 1 −0.009 0.027 −0.110 −0.349 0.734 2 −0.009 0.027 −0.110 −0.349 0.734 3 0.014 0.032 0.159 0.433 0.676
Annual ten fastest swimmers 5 km, women
1 −0.007 0.005 −0.142 −1.559 0.122 2 −0.007 0.005 −0.142 −1.559 0.122 3 −0.006 0.005 −0.113 −1.236 0.219 5 km, men 1 −0.012 0.005 −0.214 −2.377 0.019 2 −0.012 0.005 −0.214 −2.377 0.019 3 −0.012 0.005 −0.218 −2.424 0.017 10 km, women 1 0.036 0.007 0.421 4.820 < 0.001 2 0.036 0.007 0.421 4.820 < 0.001 3 0.035 0.007 0.419 4.796 < 0.001 10 km, men 1 0.006 0.006 0.089 0.929 0.355 2 0.006 0.006 0.089 0.929 0.355 3 0.005 0.006 0.073 0.727 0.469 25 km, women 1 −0.023 0.007 −0.312 −3.548 0.001 2 −0.023 0.007 −0.312 −3.548 0.001
in distances up to 1,500 m, but Eichenberger et al. [11-13] investigated elite recreational athletes competing in open water ultra-distance events. In this context, the aim of the present study was to investigate (1) the changes in swimming speed across years in 5-, 10- and 25-km open water events and (2) the change in the age of peak swimming speed of elite long-distance swimmers com-peting in these events between 2000 and 2012. Based upon existing findings for recreational swimmers, we hypothesized for elite swimmers, firstly, that swimming speed would increase during the studied period and, secondly, that the age of peak swimming speed would be older than that in shorter distances. The knowledge of the age of peak performance in ultra-distance swimming would help coaches and athletes plan an international swimming career of an athlete.
Methods
All procedures used in the study met the ethical standards of the Swiss Academy of Medical Sciences [14] and were approved by the Institutional Review Board of Kanton St. Gallen, Switzerland with a waiver of the requirement for informed consent of the participants given the fact that the study involved the analysis of publicly available data.
Data sampling and data analysis
All athletes who ever finished a 5-, 10- and 25-km FINA [1] World Cup open water swimming race between 2000 and 2012 were analysed regarding the association between age and race performance. The data set for this study was obtained from the website of the FINA [1]. To determine the changes in peak swimming speed and in the age of peak swimming speed over time, race times of the annual top and the annual top ten men and women were analysed. To increase the comparability between different distances, all race times were converted to swimming speed in meters per second (m/s) using the equation, swimming speed = race distance / race time. When less than the needed amount of athletes was available in a certain year for a certain distance, that year was excluded from the analysis.
Statistical analysis
In order to increase the reliability of the data analyses, each set of data was tested for normal distribution and for homogeneity of variances prior to statistical analyses. Normal distribution was tested using a D'Agostino and Pearson omnibus normality test, and homogeneity of vari-ances was tested using a Levene's test. Trends in participa-tion were analysed using regression analysis with ‘straight line’ and ‘exponential growth equation’ models, whereas for each set of data (e.g. each sex), both models where compared using Akaike's Information Criteria (AIC) to decide which model showed the highest probability of correctness. Single and multi-level regression analyses were used to investigate the changes across years in swimming speed and age of the athletes. A hierarchical regression model was used to avoid the impact of a cluster effect on results in case one athlete finished more than once in the annual top or the annual top ten for the analysis of the annual top and the annual top ten finishers regarding the analysis of overall performance and age of peak perform-ance. Furthermore, regression analyses of swimming speed were corrected for age of athletes to prevent misinterpret-ation of ‘age effect’ as ‘time effect’. Statistical analyses were performed using IBM SPSS Statistics (version 21, IBM SPSS, Chicago, IL, USA) and GraphPad Prism (version 6.01, GraphPad Software, La Jolla, CA, USA). Significance was accepted at P < 0.05 (two-sided for t tests). Data in the text are given as mean ± standard deviation (SD).
Results
Participation trends and multiple finishes
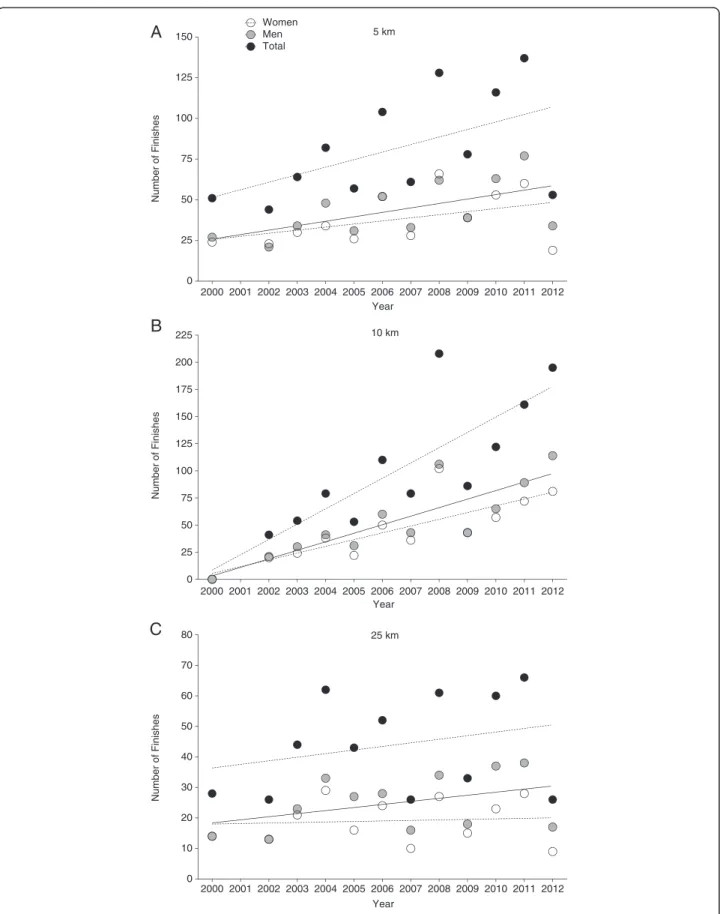
Between 2000 and 2012, the number of finishers in 5 km increased for men (P < 0.05), but not for women and overall finishers (P > 0.05). In 10 km, the number of fin-ishers increased for both sexes and for overall finfin-ishers (P < 0.05). In 25 km, the overall number of finishers was constant (P > 0.05) (Figure 1). In 5 km, every swimmer finished on average twice, in 10 km approximately 2.6 times, and in 25 km about 2.4 times, respectively (Table 1).
Swimming speed and change in swimming speed
The annual fastest men in 10 km increased swim-ming speed when corrected for multiple finishes
Table 3 Multi-level regression analyses for swimming speed of the annual fastest swimmers and the annual ten fastest swimmers (Continued) 3 −0.023 0.007 −0.310 −3.498 0.001 25 km, men 1 −0.011 0.009 −0.114 −1.250 0.214 2 −0.011 0.009 −0.114 −1.250 0.214 3 −0.011 0.009 −0.120 −1.300 0.196
and age of athletes with multiple finishes in contrast to women, in whom no changes occurred (Tables 2 and 3, Figure 2). In 5 and 25 km, the an-nual fastest athletes of both sexes did not improve
swimming speed (Tables 2 and 3, Figure 2). For the
annual ten fastest swimmers, women increased
swimming speed in 10 km and decreased in 25 km, also when corrected for multiple finishes and age of
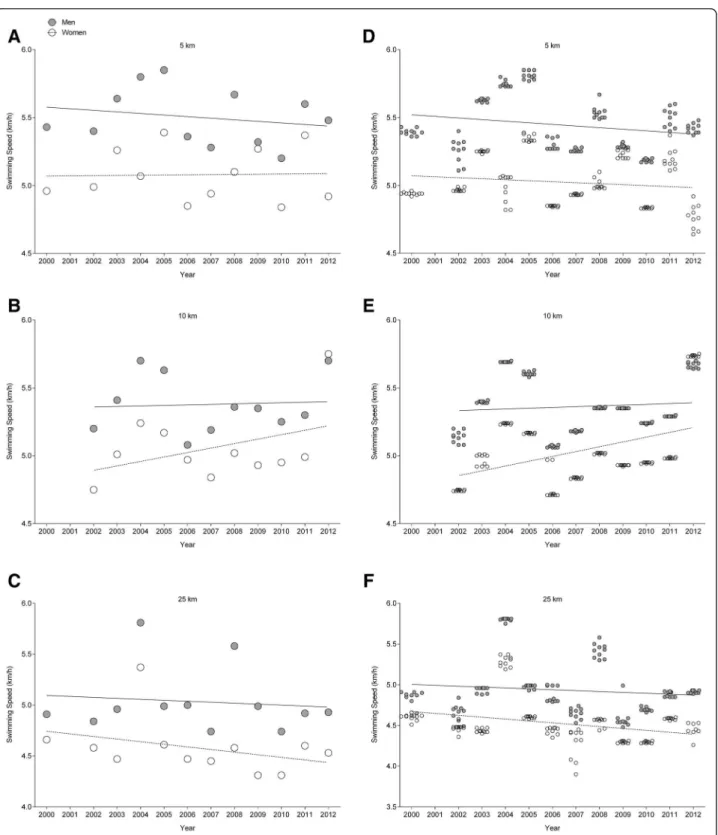
Figure 2 Average swimming speed. Average swimming speed of the annual fastest (A, B, C) and the annual ten fastest finishers (D, E, F) for both sexes in 5-, 10- and 25-km swimming events.
athletes with multiple finishes (Tables 2 and 3, Figure 2). In the annual top ten men, swimming speed decreased in 5 km, also when corrected for multiple finishes and age of athletes with multiple finishes (Tables 2 and 3, Figure 2). In all other events, neither women nor men were able to im-prove swimming speed.
Change in the age of peak swimming speed
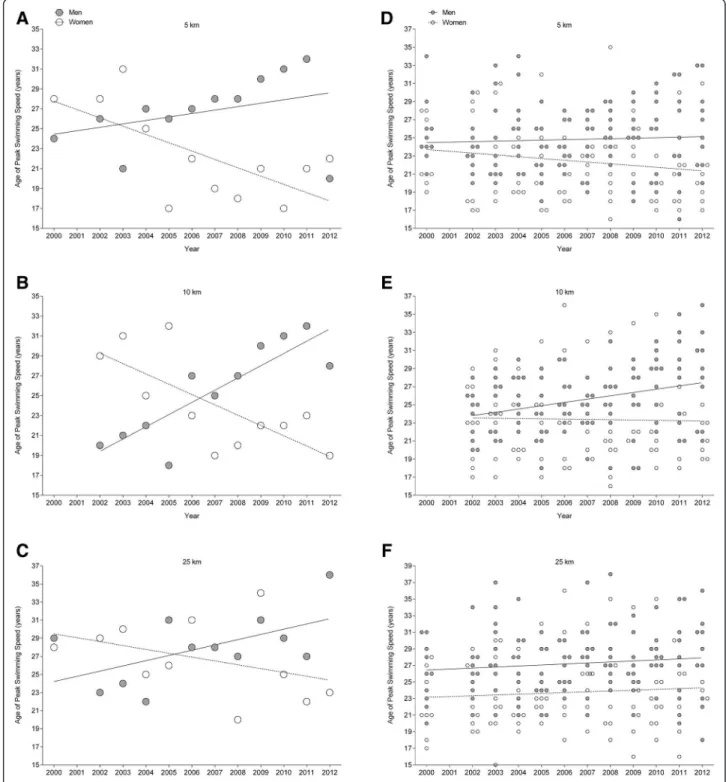
For the annual fastest swimmers, the age of peak swimming speed decreased for women in 5 km from 28 years to 22 years and in 10 km from 29 years to 19 years, while the age of peak swimming speed was unchanged at 27.0 ± 4.0 years in 25 km, also when corrected for multiple finishes of the athletes (Tables 2 and 4, Figure 3). For men, the age
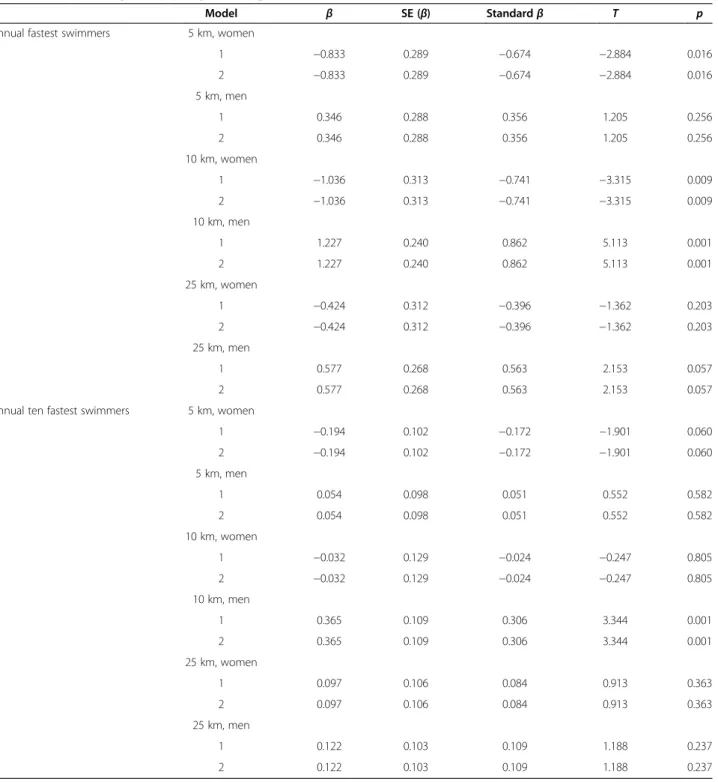
Table 4 Multi-level regression analyses for age of the annual fastest and the annual ten fastest swimmers
Model β SE (β) Standard β T p
Annual fastest swimmers 5 km, women
1 −0.833 0.289 −0.674 −2.884 0.016 2 −0.833 0.289 −0.674 −2.884 0.016 5 km, men 1 0.346 0.288 0.356 1.205 0.256 2 0.346 0.288 0.356 1.205 0.256 10 km, women 1 −1.036 0.313 −0.741 −3.315 0.009 2 −1.036 0.313 −0.741 −3.315 0.009 10 km, men 1 1.227 0.240 0.862 5.113 0.001 2 1.227 0.240 0.862 5.113 0.001 25 km, women 1 −0.424 0.312 −0.396 −1.362 0.203 2 −0.424 0.312 −0.396 −1.362 0.203 25 km, men 1 0.577 0.268 0.563 2.153 0.057 2 0.577 0.268 0.563 2.153 0.057
Annual ten fastest swimmers 5 km, women
1 −0.194 0.102 −0.172 −1.901 0.060 2 −0.194 0.102 −0.172 −1.901 0.060 5 km, men 1 0.054 0.098 0.051 0.552 0.582 2 0.054 0.098 0.051 0.552 0.582 10 km, women 1 −0.032 0.129 −0.024 −0.247 0.805 2 −0.032 0.129 −0.024 −0.247 0.805 10 km, men 1 0.365 0.109 0.306 3.344 0.001 2 0.365 0.109 0.306 3.344 0.001 25 km, women 1 0.097 0.106 0.084 0.913 0.363 2 0.097 0.106 0.084 0.913 0.363 25 km, men 1 0.122 0.103 0.109 1.188 0.237 2 0.122 0.103 0.109 1.188 0.237
of peak swimming speed was stable in 5 km at 27.0 ± 3.7 years and in 25 km at 28.0 ± 3.8 years, while the age of peak swimming speed increased in 10 km from 20 to 28 years, also when corrected for multiple finishes of the athletes (Tables 2 and 4, Figure 3).
For the annual ten fastest swimmers in 10 km, the age of peak swimming speed increased in men from 23.7 ± 2.8 to 28 ± 5.1 years, also when corrected for multiple finishes of one athlete, but was stable in 5 km at 24.8 ± 1.0 years and in 25 km at 27.2 ± 1.1 years. In women, the age of
Figure 3 Age of peak swimming speed. Age of peak swimming speed of the annual fastest (A, B, C) and the annual ten fastest finishers (D, E, F) for both women and men in 5, 10 and 25 km.
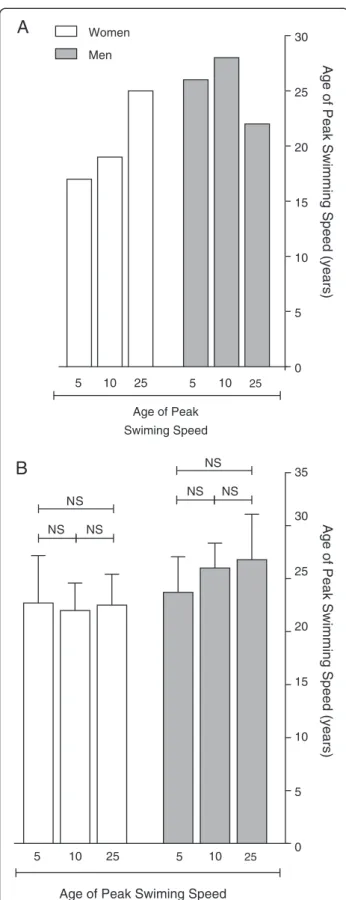
peak swimming speed was stable at 22.4 ± 1.2 years in 5 km, at 23.4 ± 0.9 years in 10 km and at 23.8 ± 0.9 years in 25 km (Tables 2 and 4, Figure 3). However, the age of peak swimming speed of the ten fastest swimmers ever was similar between 5, 10 and 25 km at approxi-mately 22 years in women and at about 25 years in men (Figure 4).
Countries and nationalities
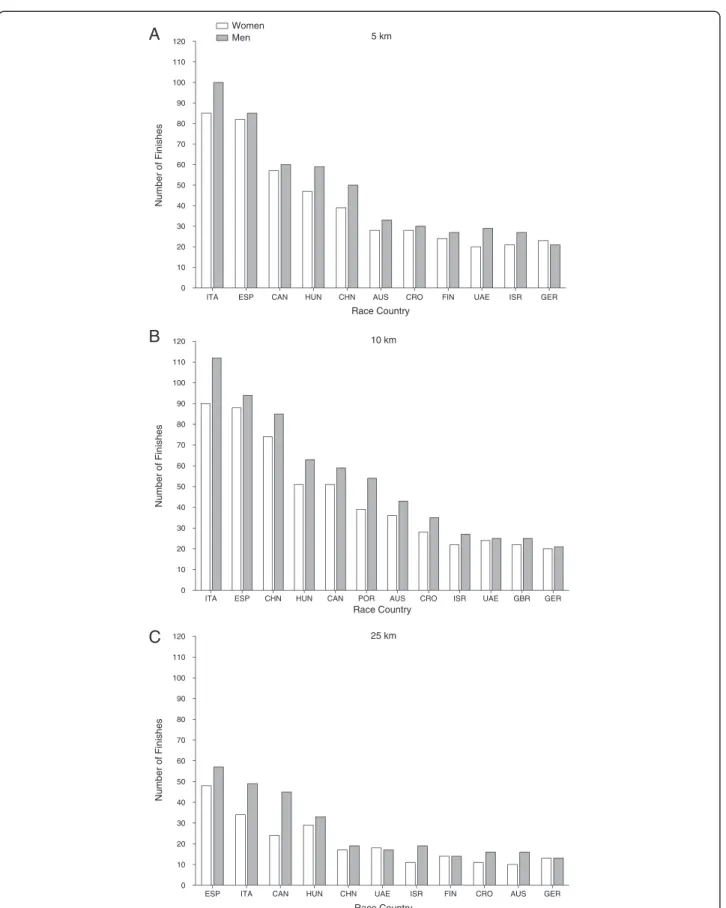
In 5 and 10 km, most of the finishes were achieved for both women and men in races held in Italy ahead of races held in Spain (Figure 5). In 25 km, however, more finishes were achieved in races held in Spain ahead of races in Italy. In 5 and 10 km, most of the successful finishes were achieved by athletes originating from Italy, Russia and Germany (Figure 6). In 25 km, however, most finishes were achieved by swimmers from Russia, Italy and France. Discussion
The main findings were, firstly, that swimming speed plateaued for the annual fastest swimmers in 5, 10 and 25 km for both sexes, except for men in 10 km where it increased. For the top ten swimmers, only women improved swimming speed in 10 km. Secondly, the age of peak swimming speed was approximately 22–28 years over all distances for both the annual fastest swimmer and the annual ten fastest swimmers, and therefore appeared older than those reported for elite freestyle pool swimmers from 50 to 1,500 m [6-10,15].
Change in swimming speed over the years
Between 2000 and 2012, swimming speed of the annual fastest finishers was unchanged for both sexes over 5, 10 and 25 km, with the exception for men in 10 km where it increased. Therefore, the swimming speed seemed to plateau in 5 and 25 km. The exploration of the limit of human performance has been going on for ages [16-18]. Whipp and Ward [17] suggested that human performance should be unlimited based on linear extrapolations. Other authors reported a plateau effect [18]. In swimming, Nevill et al. [16] analysed the development of swimming world records for men and women over 100-, 200- and 400-m freestyle from 1957–2006. An increase for swimming speeds across all distances was reported during the 1960s and 1970s, while swimming speeds seemed to plateau in the last three decades [16]. The present findings support these results since only men could improve swimming speed in 10 km. However, the present study analysed only 13 years of duration, while other studies analysed longer intervals [9,16]. Therefore, a possible alteration could have been too slight to be detected.
In the ten fastest annual swimmers, only women in 10 km improved swimming speed. Over all other distances, both men and women either decreased or plateaued in
Age of Peak Swiming Speed 0 5 10 15 20 25 30 Women Men 5 10 25 5 10 25 5 10 25 5 10 25
Age of Peak Swimming Speed (years)
0 5 10 15 20 25 30 35
Age of Peak Swimming Speed (years)
A
Age of Peak Swiming Speed
B
NS
NS NS
NS
NS NS
Figure 4 Age of peak swimming speed. Fastest swimmer ever (A) and of the ten fastest swimmers ever (B).
5 km
Race Country
Number of Finishes
ITA ESP CAN HUN CHN AUS CRO FIN UAE ISR GER 0 120 110 100 90 80 70 60 50 40 30 20 10 Number of Finishes 0 120 110 100 90 80 70 60 50 40 30 20 10 Number of Finishes 0 120 110 100 90 80 70 60 50 40 30 20 10 Women Men
A
B
C
10 km Race CountryITA ESP CHN HUN CAN POR AUS CRO ISR UAE GBR GER
25 km
Race Country
ESP ITA CAN HUN CHN UAE ISR FIN CRO AUS GER
Figure 5 Number of finishes sorted by the country where the races were held. ITA = Italy, ESP = Spain, CAN = Canada, HUN = Hungary, CHN = China, AUS = Australia, CRO = Croatia, FIN = Finland, UAE = United Arab Emirates, ISR = Israel, GER = Germany, POR = Portugal, GBR = Great Britain. (A) 5 km, (B) 10 km and (C) 25 km.
5 km
Nationality
Number of Finishes
ITA RUS GER ESP FRA CZE GBR HUN USA AUS BRA UKR CAN ECU SUI VEN SLO GRE NED RSA 0 5 10 15 20 25 30 35 40 45 Number of Finishes 0 5 10 15 20 25 30 35 40 45 Number of Finishes 0 5 10 15 20 25 30 35 40 45 Women Men
A
B
C
10 km NationalityITA RUS GER FRA ESP CZE GBR UKR HUN USA AUS BRA NED CAN MEX ECU GRE BUL CRO VEN
25 km
Nationality
RUS ITA FRA GER CZE ESP AUS USA NED BUL CAN ARG SLO HUN MKD UKR BEL CRO EGY POR
their swimming speed. A possible reason for these findings could be the fact that in ultra-distance swimming, the elite was very close together. For example, in the Summer Olympics 2012, Mellouli Oussama from Tunisia won the 10 km in 1 h 49 min 55 s, less than 1 min in front of the next 12 athletes with <1 % time difference. Therefore, solo swims and wins over the whole distance of 5, 10 or 25 km are unheard of, and the main objective in a race may be controlling opponents instead of swimming world records.
A main reason for close results is the fact that open water swimmers are allowed to draft in contrast to pool swimmers [4]. As in cycling, breakaway tries of a single athlete are almost impossible over a larger distance. Influences on swimming speed of water resistance [18,19] in swimming and air resistance in cycling [20,21], and the combination in triathlon [22] have been investigated. Hausswirth et al. [21] reported that continu-ously drafting behind a leading cyclist allows triathletes to save a significant amount of energy during the bike leg of a sprint triathlon (i.e. 0.7km swim, 20-km bike, 5-km run). The optimal distance for drafting in swimming was between 0 and 50 cm back from the toes of the lead swimmer, whereas in lateral drafting, the optimal dis-tance was 50–100 cm back from the hands of the leading swimmer [23,24]. The resistance in a medium increases in a quadratic manner when the moving speed doubles [25]. Since the density of water is far above the density of air, drafting plays an important role even at slower swimming speeds. Therefore, drafting [26] may be the main differ-ence of long- to short- and middle-distance swimming.
The age of peak swimming speed in long-distance swimmers
The age of peak swimming speed increased with increasing race distance from 5 to 25 km in both sexes. However, the age of peak swimming speed did not differ significantly among 5, 10 and 25 km. The fastest women were ap-proximately 24 years old, and the fastest men were about 26 years. While the age of peak swimming speed decreased from 50 to 1,500 m freestyle in pool swimmers [6,9], it increased in longer race distances such as 26.4 km [11]. These results were in line with previous findings of Eichenberger et al. [11-13], where the age of peak swimming speed was 30–39 years for 26.4 km, 12 h and 35 km compared to approximately 21 years described by Berthelot et al. [6] in 50 to 1,500 m freestyle swimming. However, Berthelot et al. [6] reported differences in the
age of peak swimming speed for swimmers regarding the length of a swimming performance. The 1,500-m freestyle was achieved at a younger age of about 18 years compared to the 50-m freestyle at approximately 23 years.
Combined with the results of the present study, it seems likely that the age of peak swimming speed decreased from about 23 years in short-distance sprint swimming of 50 m to approximately 18 years in 1,500-m long-distance swimming to increase again from to about 27 years in 25 km. Recent investigations [27,28] addressed the possible association of the age of peak performance and the length of a race, i.e. the distance of an event. In running, for example, Rüst et al. [28] mentioned the possibility that older runners rather compete in ultra-marathons because of a deficit in physiological factors as maximal oxygen uptake (VO2max) [29] compared to
young athletes in their ‘prime age’. It could be argued that the world's elite swimmers rather compete in the more lucrative short- and middle-distance than in long-distance events.
Physiological and anthropometric differences might explain the differences in the age of peak swimming speed for short, middle and long distances. Peak swimming speed in sprint swimming was highly associated with strength, power [30] and anaerobic capacity [31]. In longer race distances such as 1,500-m freestyle swimming, peak swimming speed was rather associated with maximal oxygen consumption [31], anaerobic threshold [32] and anthropometric characteristics such as body fat [33-35]. In contrast to other sports disciplines such as running [9] or triathlon [27], the age of peak performance seemed to decrease in swimming [9]. The finding that the age of peak swimming speed increased again from 5 to 25 km therefore is a new finding. This finding could have an impact on aging athletes as they could focus on longer swimming distances in the future as elite athletes do in other sports such as running [28].
Another important aspect is motivation to compete in different swimming events. While short- (50 m) to middle-distance (1,500 m) swimming stars such as Michael Phelps or Ryan Lochte earned hundreds of thousands to millions of dollars [36], the average elite swimmer lived on much less. Indoor Olympics swimming disciplines attract huge publicity as even TV transmission times were ad-justed to the main marketing markets in the 2012 Olympic Games in London. In contrast, long-distance swimming such as 5, 10 and 25 km is little known to the public, and
(See figure on previous page.)
Figure 6 Number of finishes sorted by the nationality of the swimmers. Limited to the 20 countries with the highest number of finishes. ITA = Italy, RUS = Russia, ESP = Spain, CAN = Canada, HUN = Hungary, CHN = China, AUS = Australia, CRO = Croatia, FIN = Finland, UAE = United Arab Emirates, ISR = Israel, GER = Germany, POR = Portugal, GBR = Great Britain, BRA = Brazil, UKR = Ukraine, ECU = Ecuador, SUI = Switzerland, VEN = Venezuela, SLO = Slovenia, GRE = Greece, NED = Netherlands, RSA = Republic of South Africa, CZE = Czech Republic, MEX = Mexico, BUL = Bulgaria, ARG = Argentina, MKD = Macedonia, EGY = Egypt. (A) 5 km, (B) 10 km and (C) 25 km.
5- and 25-km events are not held at the Olympic Games [5]. Short- and middle-distance swimming were two of the major attractions in the last Olympic Games in Athens (2004), Beijing (2008) and London (2012). Swimming was represented in 34 different competitions (i.e. each sex 17) providing for 102 medals of a total of 992 Olympic medals 2012 [5], only the two 10-km marathon swims were longer than the 1,500-m indoor freestyle. Therefore, it could be argued that long-distance swimming was less attractive to the world's elite swimming athletes. Furthermore, less publicity might have an influence on professionalism of training in young swimmers, which could have an import-ant influence in the age of peak swimming speed.
Most of the races were held in European countries, and mainly European swimmers were competing in these races. Although American and Australian athletes dominate pool swimming [37,38], European athletes seemed to dominate in ultra-distance races such as swimming [11,39], cycling [40], running [41-44] and triathlon [45-48].
Limitations and implications for future research
The strength of the study is that the statistical analysis excluded the influence of athletes who competed more than once and could have biased the results. Furthermore, this study is the first to investigate the association of age and peak swimming performance in long-distance open water swimming so far about professional swimmers competing in FINA races. The study is limited since vari-ables such as physiological parameters [23], anthropometric characteristics [35], training data [49], previous experience [50], nutrition [51,52] and motivational [53] factors were not considered. These variables may have had an influence on race outcome. We used a linear regression analysis; however, the sex difference is considered to follow a non-linear change [54]. Further studies need to investigate why the upper limit of swimming speed but not the increase of density is reached in long-distance open water swimming. Moreover, a systemic analysis of age of peak swimming speed across distances from 50 to 25 km and more would be useful. Future studies need also to investigate why European athletes preferably compete in ultra-distance swimming races.
Conclusion
The upper limit of peak swimming speed of the fastest annual swimmers plateaued in long-distance open water swimming up to 25 km as only women in 10 km increased swimming speed. The main focus of elite long-distance swimmers seemed to lie more in controlling opponents than accomplishing new records. The age of peak swim-ming speed seemed older (approximately 25 years) for long-distance swimmers compared to the age of freestyle swimmers in 50- to 1,500-m races (about 20–23 years).
Future studies need to investigate why short- and middle-distance swimming regularly produced world best times, while long-distance swimming speed seemed to plateau. Furthermore, the differences in physiology and anthropom-etry such as body fat for short-, middle-, and long-distance swimmers need more investigation.
Abbreviations
ARG:Argentina; AUS: Australia; BRA: Brazil; BUL: Bulgaria; CAN: Canada; CHN: China; CRO: Croatia; CZE: Czech Republic; ECU: Ecuador; EGY: Egypt; ESP: Spain; FINA: Fédération Internationale de Natation; FIN: Finland; GBR: Great Britain; GER: Germany; GRE: Greece; HUN: Hungary; ITA: Italy; ISR: Israel; MEX: Mexico; MKD: Macedonia; NED: Netherlands; POR: Portugal; RSA: Republic of South Africa; RUS: Russia; SLO: Slovenia; SUI: Switzerland; UAE: United Arab Emirates; UKR: Ukraine; VEN: Venezuela.
Competing interests
The authors declare that they have no competing interests. Authors' contributions
MAZ drafted the manuscript. BK collected the data and helped draft the manuscript. CAR added statistical analyses and helped draft the manuscript. TR participated in the study design and helped draft the manuscript. RL helped draft the manuscript. All authors read and approved the final manuscript.
Acknowledgements
We thank Matthias Knechtle for his help in translation. The authors received no funding.
Author details
1Institute of General Practice and for Health Services Research, University of Zurich, Rämistrasse 71, Zurich, 8006 Switzerland.2INSERM U1093, Faculty of Sport Sciences, University of Burgundy, Esplanade Erasme, Dijon, 21078 France.3Facharzt FMH für Allgemeinmedizin, Gesundheitszentrum St. Gallen, Vadianstrasse 26, St. Gallen, 9001 Switzerland.
Received: 14 September 2013 Accepted: 11 November 2013 Published:
References
1. Fédération Internationale de Natation. [http://www.fina.org/].
2. Kerr CG, Trappe TA, Starling RD, Trappe SW: Hyperthermia during Olympic triathlon: influence of body heat storage during the swimming stage. Med Sci Sports Exerc1998, 30:99–104.
3. Mougios V, Deligiannis A: Effect of water temperature on performance, lactate production and heart rate at swimming of maximal and submaximal intensity. J Sports Med Phys Fitness 1993, 33:27–33. 4. Open water swimming. [http://www.openwaterswimming.com/]. 5. Olympic Games. [http://www.olympic.org/].
6. Berthelot G, Len S, Hellard P, Tafflet M, Guillaume M, Vollmer JC, Gager B, Quinquis L, Marc A, Toussaint JF: Exponential growth combined with exponential decline explains lifetime performance evolution in individual and human species. Age (Dordr) 2012, 34:1001–1009. 7. Donato AJ, Tench K, Glueck DH, Seals DR, Eskurza I, Tanaka H: Declines in
physiological functional capacity with age: a longitudinal study in peak swimming performance. J Appl Physiol 2003, 94:764–769.
8. Fairbrother JT: Age-related changes in top-ten men’s US. Masters 50-m freestyle swim times as a function of finishing place. Percept Mot Skills 2007, 105:1289–1293.
9. Schulz R, Curnow C: Peak performance and age among superathletes: track and field, swimming, baseball, tennis, and golf. J Gerontol 1988, 43:113–120. 10. Tanaka H, Seals DR: Age and gender interactions in physiological
functional capacity: insight from swimming performance. J Appl Physiol 1997, 82:846–851.
11. Eichenberger E, Knechtle B, Knechtle P, Rüst CA, Rosemann T, Lepers R: Best performances by men and women open-water swimmers during the 'English Channel Swim' from 1900 to 2010. J Sports Sci 2012, 30:1295–1301.
12. Eichenberger E, Knechtle B, Knechtle P, Rüst CA, Rosemann T, Lepers R, Senn O: Sex difference in open-water ultra-swim performance in the longest freshwater lake swim in Europe. J Strength Cond Res 2013, 27:1362–1369.
13. Eichenberger E, Knechtle B, Knechtle P, Rüst CA, Rosemann T, Lepers R: No gender difference in peak performance in ultra-endurance swimming performance—analysis of the ‘Zurich 12-h Swim’ from 1996 to 2010. Chin J Physiol2012, 55:346–351.
14. Ethical standards of the Swiss Academy of Medical Sciences. [www.samw.ch/en/Ethics/Guidelines/Currently-valid-guidelines.html/]. 15. Rüst CA, Knechtle B, Rosemann T, Lepers R: The changes in age of peak
swim speed for elite male and female Swiss freestyle swimmers between 1994 and 2012. J Sports Sci 2013. doi:10.1080/02640414.2013.823221. 16. Nevill AM, Whyte GP, Holder RL, Peyrebrune M: Are there limits to
swimming world records? Int J Sports Med 2007, 28:1012–1017. 17. Whipp BJ, Ward SA: Will women soon outrun men? Nature 2012, 355:25. 18. Cheuvront SN, Carter R, Deruisseau KC, Moffatt RJ: Running performance
differences between men and women: an update. Sports Med 2005, 35:1017–1024.
19. Naemi R, Easson WJ, Sanders RH: Hydrodynamic glide efficiency in swimming. J Sci Med Sport 2010, 13:444–451.
20. De Groot G, Sargeant A, Geysel J: Air friction and rolling resistance during cycling. Med Sci Sports Exerc 1995, 27:1090–1095.
21. Hausswirth C, Vallier JM, Lehenaff D, Brisswalter J, Smith D, Millet G, Dreano P: Effect of two drafting modalities in cycling on running performance. Med Sci Sports Exerc2001, 33:485–492.
22. Peeling P, Landers G: Swimming intensity during triathlon: a review of current research and strategies to enhance race performance. J Sports Sci 2009, 27:1079–1085.
23. Chatard JC, Wilson B: Drafting distance in swimming. Med Sci Sports Exerc 2003, 35:1176–1181.
24. Janssen M, Wilson BD, Toussaint HM: Effects of drafting on hydrodynamic and metabolic responses in front crawl swimming. Med Sci Sports Exerc 2009, 41:837–843.
25. Russell B, Whitehead AN: Principia Mathematica. Cambridge, UK: University Press, Cambridge ISBN 3-518-28193-3.
26. Vleck VE, Bürgi A, Bentley DJ: The consequences of swim, cycle, and run performance on overall result in elite Olympic distance triathlon. Int J Sports Med2006, 27:43–48.
27. Gallmann D, Knechtle B, Rüst CA, Rosemann T, Lepers R: Elite triathletes in 'Ironman Hawaii' get older but faster. Age (Dordr) 2013.
doi:10.1007/s11357-013-9534-y.
28. Rüst CA, Knechtle B, Rosemann T, Lepers R: Analysis of performance and age of the fastest 100-miles ultra-marathoners worldwide. Clinics 2013, 68:605–611.
29. Carlsson M, Andersson R, Bloch KM, Steding-Ehrenborg K, Mosén H, Stahlberg F, Ekmehag B, Arheden H: Cardiac output and cardiac index measured with cardiovascular magnetic resonance in healthy subjects, elite athletes and patients with congestive heart failure. J Cardiovasc Magn Reson 2012, 28:14–51.
30. West DJ, Owen NJ, Cunningham DJ, Cook CJ, Kilduff LP: Strength and power predictors of swimming starts in international sprint swimmers. J Strength Cond Res2011, 25:950–955.
31. Unnithan V, Holohan J, Fernhall B, Wylegala J, Rowland T, Pendergast DR: Aerobic cost in elite female adolescent swimmers. Int J Sports Med 2009, 30:194–199.
32. VanHeest JL, Mahoney CE, Herr L: Characteristics of elite open-water swimmers. J Strength Cond Res 2004, 18:302–305.
33. Siders WA, Lukaski HC, Bolonchuk WW: Relationships among swimming performance, body composition and somatotype in competitive collegiate swimmers. J Sports Med Phys Fitness 1993, 33:166–171. 34. Tuuri G, Loftin M, Oescher J: Association of swim distance and age with
body composition in adult female swimmers. Med Sci Sports Exerc 2002, 34:2110–2114.
35. Zuniga JM, Berg K, Noble J, Harder J, Chaffin ME, Hanumanthu VS: Physiological responses during interval training with different intensities and duration of exercise. J Strength Cond Res 2011, 25:1279–1284. 36. Forbes. [http://www.forbes.com/].
37. Pyne D, Trewin C, Hopkins W: Progression and variability of competitive performance of Olympic swimmers. J Sports Sci 2004, 22:613–620.
38. Trewin CB, Hopkins WG, Pyne DB: Relationship between world-ranking and Olympic performance of swimmers. J Sports Sci 2004, 22:339–345. 39. Rüst CA, Knechtle B, Rosemann T: The relationship between nationality and performance in successful attempts to swim across the ‘English Channel’—a retrospective data analysis from 1875 to 2012. Medicina Sportiva2013, 17:113–121.
40. Abou Shoak M, Knechtle B, Knechtle P, Rüst CA, Rosemann T, Lepers R: Participation and performance trends in ultra-cycling. Open Access J Sports Med2013, 4:41–51.
41. Cejka N, Rüst CA, Lepers R, Onywera V, Rosemann T, Knechtle B: Participation and performance trends in 100-km ultra-marathons worldwide. J Sports Sci 2013. doi:10.1080/02640414.2013.825729. 42. Knoth C, Knechtle B, Rüst CA, Rosemann T, Lepers R: Participation and
performance trends in multistage ultramarathons—the 'Marathon des Sables' 2003–2012. Extrem Physiol Med 2012, 1(1):13.
43. Eichenberger E, Knechtle B, Rüst CA, Lepers R, Rosemann T, Onywera VO: The aspect of nationality and performance in a mountain ultra-marathon—the ‘Swiss Alpine Marathon’. J Hum Sport Exerc 2013, 7:748–762.
44. Knechtle B, Rüst CA, Rosemann T: The aspect of nationality in
participation and performance in ultra-marathon running—a comparison between ‘Badwater’ and ‘Spartathlon’. OA Sports Med 2013, 1:1. 45. Rüst CA, Knechtle B, Knechtle P, Lepers R, Rosemann T, Onywera V:
European athletes dominate performances in Double Iron ultra-triathlons—a retrospective data analysis from 1985 to 2010. Eur J Sport Sci2012. doi:10.1080/17461391.2011.641033.
46. Abou Shoak M, Knechtle B, Rüst CA, Lepers R, Rosemann T: European dominance in multi-stage ultra-marathons—an analysis of finisher rate and performance trends from 1992 to 2010. Open Access J Sports Med 2013, 4:9–18.
47. Sigg K, Knechtle B, Rüst CA, Knechtle P, Rosemann T, Lepers R: Central European athletes dominate Double Iron ultra-triathlon—analysis of participation and performance from 1985 to 2011. Open Access J Sports Med2012, 3:159–168.
48. Jeffery S, Knechtle B, Rüst CA, Knechtle P, Lepers R, Rosemann T: European dominance in Triple Iron ultra-triathlons from 1988 to 2011. J Sci Cycling 2012, 1:30–38.
49. Strzała M, Krężałek P, Kaca M, Głąb G, Ostrowski A, Stanula A, Tyka A: Swimming speed of the breaststroke kick. J Hum Kinet 2012, 35:133–139. 50. Simões P, Vasconcelos-Raposo J, Silva A, Fernandes HM: Effects of a
process-oriented goal setting model on swimmer's performance. J Hum Kinet2012, 32:65–76.
51. Maughan RJ, Shirreffs SM: Nutrition for sports performance: issues and opportunities. Proc Nutr Soc 2011, 17:1–8.
52. Rodriguez NR, Di Marco NM, Langley S: American College of Sports Medicine position stand. Nutrition and athletic performance. Med Sci Sports Exerc2009, 41:709–731.
53. Miller JW: Injuries and considerations in masters aquatics sports. Clin Sports Med1999, 18:413–426.
54. Reinboud W: Linear models can't keep up with sport gender gap. Nature 2004, 432:14.
Cite this article as: Zingg et al.: Analysis of swimming performance in FINA World Cup long-distance open water races. Extreme Physiology & Medicine
Submit your next manuscript to BioMed Central and take full advantage of:
• Convenient online submission • Thorough peer review
• No space constraints or color figure charges • Immediate publication on acceptance
• Inclusion in PubMed, CAS, Scopus and Google Scholar • Research which is freely available for redistribution
Submit your manuscript at www.biomedcentral.com/submit 10.1186/2046-7648-3-2