HAL Id: hal-01111024
https://hal.archives-ouvertes.fr/hal-01111024
Submitted on 4 Dec 2019
HAL is a multi-disciplinary open access
archive for the deposit and dissemination of
sci-entific research documents, whether they are
pub-lished or not. The documents may come from
teaching and research institutions in France or
abroad, or from public or private research centers.
L’archive ouverte pluridisciplinaire HAL, est
destinée au dépôt et à la diffusion de documents
scientifiques de niveau recherche, publiés ou non,
émanant des établissements d’enseignement et de
recherche français ou étrangers, des laboratoires
publics ou privés.
Distributed under a Creative Commons Attribution - NonCommercial - ShareAlike| 4.0
TRP channel–associated factors are a novel protein
family that regulates TRPM8 trafficking and activity
Dimitra Gkika, Loic Lemonnier, George Shapovalov, Dmitri Gordienko, Céline
Poux, Michela Bernardini, Alexandre Bokhobza, Gabriel Bidaux, Cindy
Degerny, Kathye Verreman, et al.
To cite this version:
Dimitra Gkika, Loic Lemonnier, George Shapovalov, Dmitri Gordienko, Céline Poux, et al..
TRP channel–associated factors are a novel protein family that regulates TRPM8 trafficking
and activity.
Journal of Cell Biology, Rockefeller University Press, 2015, 208 (1), pp.89-107.
�10.1083/jcb.201402076�. �hal-01111024�
JCB:
Article
The Rockefeller University Press $30.00 J. Cell Biol. Vol. 208 No. 1 89–107
D. Gkika, L. Lemonnier, and G. Shapovalov contributed equally to this paper. Correspondence to Dimitra Gkika: dimitra.gkika@univ-lille1.fr
D. Gordienko’s present address is Laboratory of Molecular Pharmacology and Biophysics of Cell Signalling, Bogomoletz Institute of Physiology, State Key Laboratory of Molecular and Cell Biology, 01024 Kiev, Ukraine.
Abbreviations used in this paper: EAPA2, Experimental Autoimmune Prostatitis Antigen 2; FRET, Förster resonance energy transfer; HEK, human embryonic kidney; LNCaP, lymph node carcinoma of prostate; ML, maximum likelihood method; qPCR, quantitative real-time PCR; TCAF, TRP channel–associated factor; TCSPC, time-correlated single photon counting; TD FLIM, time-domain fluorescence lifetime imaging microscopy; TRP, transient receptor potential.
Introduction
Transient receptor potential (TRP) channels form a large family
of cation channels involved in a diverse range of physiological
functions, and are expressed in almost all cell types (Clapham,
2003). They play important roles ranging from Ca
2+absorption,
vasorelaxation, cell death, mechanotransduction, and hearing,
to the mediation of pH, heat, taste, osmolarity, and pain
sensa-tions. Dysfunctions of TRP channels have been linked to
sev-eral diseases (Nilius et al., 2007). Among members of the TRP
channel family, the function of TRPM8 could be considered one
of the most intriguing. Although it was initially cloned from
the prostate (Tsavaler et al., 2001; Stein et al., 2004) and is
ex-pressed in tissues not affected by ambient temperature
fluctua-tions such as the prostate, testis, and bladder (Tsavaler et al.,
2001; Stein et al., 2004), this channel is mainly known as the
principal detector of environmental cold (Bautista et al., 2007;
Colburn et al., 2007; Dhaka et al., 2007).
TRPM8 expression is strongly up-regulated in numerous
cancers such as that of the prostate, but is dramatically reduced
during metastasis in androgen-independent prostate cancers
(Tsavaler et al., 2001; Henshall et al., 2003; Yee et al., 2010).
This pattern of variation of TRPM8 expression makes it an
in-teresting candidate both as a diagnostic marker for the detection
of certain cancers and as a prognostic marker in evaluating the
T
RPM8 is a cold sensor that is highly expressed in
the prostate as well as in other
non-temperature-sensing organs, and is regulated by downstream
receptor–activated signaling pathways. However, little is
known about the intracellular proteins necessary for
chan-nel function. Here, we identify two previously unknown
proteins, which we have named “TRP channel–associated
factors” (TCAFs), as new TRPM8 partner proteins, and we
demonstrate that they are necessary for channel function.
TCAF1 and TCAF2 both bind to the TRPM8 channel and
promote its trafficking to the cell surface. However, they
exert opposing effects on TRPM8 gating properties.
Func-tional interaction of TCAF1/TRPM8 also leads to a
reduc-tion in both the speed and direcreduc-tionality of migrareduc-tion of
prostate cancer cells, which is consistent with an observed
loss of expression of TCAF1 in metastatic human
speci-mens, whereas TCAF2 promotes migration. The
identifica-tion of TCAFs introduces a novel mechanism for modulaidentifica-tion
of TRPM8 channel activity.
TRP channel–associated factors are a novel protein
family that regulates TRPM8 trafficking and activity
Dimitra Gkika,
1Loic Lemonnier,
1George Shapovalov,
1Dmitri Gordienko,
1Céline Poux,
2Michela Bernardini,
1,6Alexandre Bokhobza,
1Gabriel Bidaux,
3Cindy Degerny,
4Kathye Verreman,
4Basma Guarmit,
5Mohamed Benahmed,
5Yvan de Launoit,
4Rene J.M. Bindels,
7Alessandra Fiorio Pla,
1,6and Natalia Prevarskaya
11Inserm U1003, Equipe labellisée par la Ligue Nationale Contre le Cancer, Université des Sciences et Technologies de Lille (USTL), 59655 Villeneuve d’Ascq Cedex, France 2Centre national de la Recherche Scientifique (CNRS) UMR 8198 and Laboratoire de Génétique & Evolution des Populations Végétales (GEPV), Université des Sciences et
Technologies de Lille (USTL), 59655 Villeneuve d’Ascq Cedex, France
3Laboratoire Biophotonique Cellulaire Fonctionnelle, Institut de Recherche Interdisciplinaire, USR3078 Centre National de la Recherche Scientifique, Parc scientifique de la
Haute Borne, Villeneuve d’Ascq, F-59655 France
4CNRS UMR 8161, Institut de Biologie de Lille, Université de Lille—Nord de France, Institut Pasteur de Lille, 59019 Lille Cedex, France
5Inserm, Institut National de la Santé et de la Recherche Médicale U895, Centre Méditerranéen de Médecine Moléculaire, Hôpitall’Archet, 06204 Nice, France 6Department of Life Science and Systems Biology, University of Torino, 10123 Torino, Italy
7Department of Physiology, Radboud University Nijmegen Medical Centre, 6500HB Nijmegen, Netherlands
© 2015 Gkika et al. This article is distributed under the terms of an Attribution–Noncommercial– Share Alike–No Mirror Sites license for the first six months after the publication date (see http://www.rupress.org/terms). After six months it is available under a Creative Commons License (Attribution–Noncommercial–Share Alike 3.0 Unported license, as described at http://creativecommons.org/licenses/by-nc-sa/3.0/).
THE
JOURNAL
OF
CELL
BIOLOGY
on December 4, 2019 jcb.rupress.org Downloaded from http://doi.org/10.1083/jcb.201402076 Published Online: 5 January, 2015 | Supp Info:Results
Identification of the TRP channel–associated factors (TCAFs): a family of TRPM8
partner proteins
To identify TRPM8 regulatory proteins, which have not been
identified until now, we performed a GST pull-down assay to
screen lysates of healthy mouse prostates, with the N-terminal
and C-terminal cytosolic tails of TRPM8 as bait. Fourier
trans-form ion cyclotron resonance mass spectrometry (FTMS)
re-vealed mouse Experimental Autoimmune Prostatitis Antigen 2
(EAPA2) as a protein interacting with TRPM8. The full list of
peptides interacting with TRPM8 cytosolic tails is presented in
Tables S1 and S2
. As EAPA2 is not known in humans, we
searched for highly homologous proteins using National Center
for Biotechnology Information (NCBI) Blast. Two proteins of
unknown function, FAM115A, consisting of 921 amino acids
(NP_055534), and FAM115C, consisting of 845 amino acids
(NP_001123497), were thus identified and named TCAF1 and
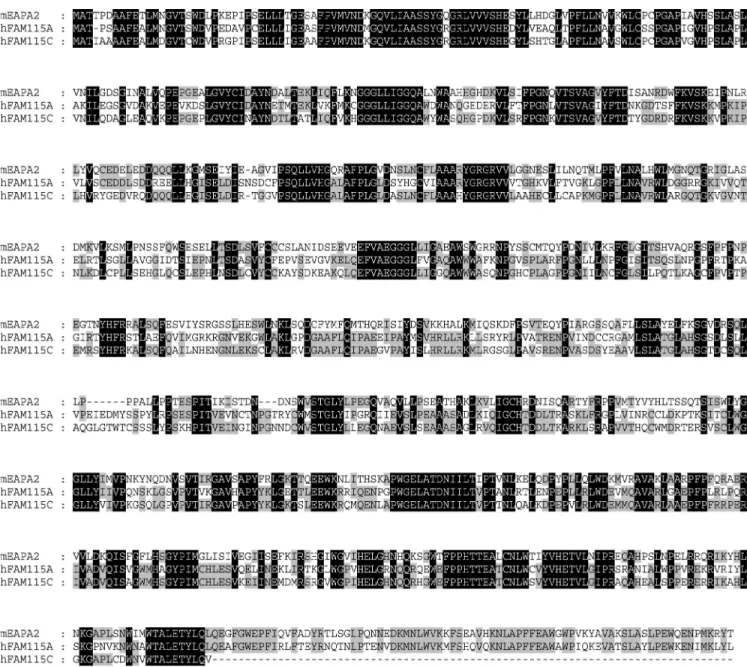
-2. The alignment of these two proteins with EAPA2 (hereafter
renamed TCAF3) revealed 51% and 57% of identity,
respec-tively. Once substitutions by similar residues were taken into
account, the similarity between TCAF3 and TCAF1 or TCAF2
reached 69% and 66%, respectively (see Fig. 2), which suggests
that they may have a common origin and belong to the same
group of genes.
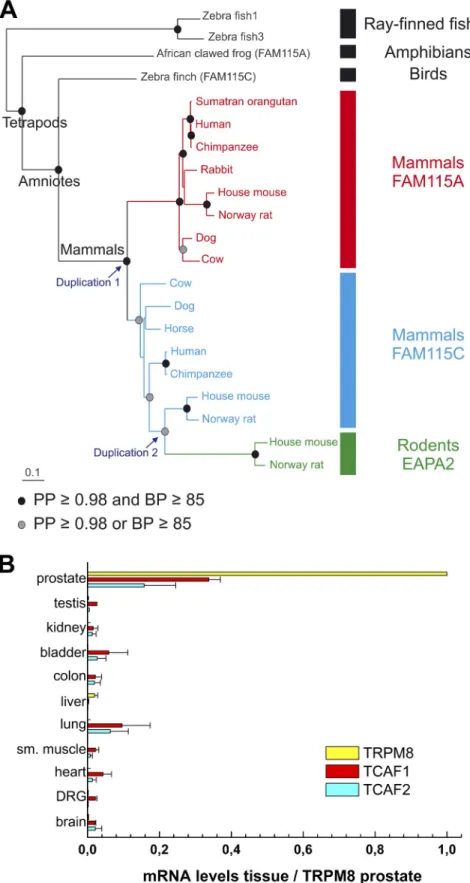
Indeed, a phylogenetic analysis of TCAF1, TCAF2, and
TCAF3 revealed the presence of a putative gene family. Given
the sequences available in GenBank, we determined two
du-plication events (Fig. 1 A), supported by both posterior
prob-abilities (PP; Bayesian method) and bootstrap supports (BP;
maximum likelihood method [ML]). In mammals, up to three
highly similar genes were found (TCAF1, TCAF2, and TCAF3),
whereas only one gene copy was seen in fish, amphibians, and
birds. The mammalian TCAF1 and TCAF2 sequences are
phy-logenetically closer to each other than to the other vertebrate
sequences. Therefore the first duplication event most likely
oc-curred during mammalian evolution. Given the poor taxon
sam-pling available in the database, it was not possible to precisely
determine the period of duplication. A second duplication event
appears to have taken place during rodent evolution to generate
the TCAF3 gene (Fig. 1 A).
Although mouse TCAF3 is mainly expressed in the
pros-tate, nothing is known about the tissue distribution of the newly
identified human homologues. We thus examined TCAF1 and
TCAF2 expression in several human tissue samples using
quan-titative real-time PCR (qPCR). Both transcripts were
predomi-nantly expressed in the prostate (Fig. 1 B), similar to TCAF3 in
rodents and TRPM8 in humans and rodents.
Both TCAF1 and TCAF2 interact directly with the TRPM8 channel
To verify the association of human TCAF1 and TCAF2 proteins
with TRPM8, we cloned TCAF1 and TCAF2 and studied their
interaction with TRPM8 by GST pull-down assays. In
vitro-translated [
35S]methionine-labeled TCAF1 and TCAF2 strongly
interacted with the TRPM8 N-terminal tail (GST-M8N) and to
outcome of these cancers (Zhang and Barritt, 2006). In
addi-tion, it could play a protective role in metastatic prostate cancer
(Gkika and Prevarskaya, 2011), as recent data show that it
blocks the migration of prostate cancer cells (Yang et al., 2009;
Gkika et al., 2010; Zhu et al., 2011). Thus, although TRPM8 is
considered to be a promising target for pharmaceutical,
immuno-logical, and genetic interventions for the treatment of prostate
cancer (Zhang and Barritt, 2006), it is first necessary to better
understand its biological function and the physiological
modu-lators in this organ.
Besides cool temperatures, TRPM8 is also activated by
several chemical compounds that elicit a sensation of cold,
of which the best known are menthol, eucalyptol, and the
su-percooling icilin (McKemy et al., 2002; Peier et al., 2002;
Behrendt et al., 2004; Chuang et al., 2004; Beck et al., 2007;
Bödding et al., 2007). Chemical agents generally serve as
positive allosteric modulators. More specifically, because the
activation of TRPM8 is also voltage dependent, these
ago-nists shift the activation threshold toward more negative
po-tentials, enabling the channel to open at higher than normal
temperatures, whereas antagonists exert their effect by
shift-ing the threshold of TRPM8 activation toward more positive
potentials (Brauchi et al., 2004; Voets et al., 2004; Mälkiä
et al., 2007).
In the absence of the aforementioned physical and
chemical stimuli, as could be the case in
non-temperature-sensing tissues, TRPM8 could be kept in readiness in a
dy-namic pool of vesicles under the cell surface, awaiting the
appropriate signal for plasma membrane insertion and
chan-nel activation (Veliz et al., 2010; Latorre et al., 2011). This
dynamic TRPM8 pool could be activated by intracellular
factors known to modulate TRPM8 activity, such as second
messengers generated during the activation of surface-receptor–
coupled signaling pathways (Bavencoffe et al., 2010, 2011;
Latorre et al., 2011; Yudin and Rohacs, 2012; Zhang et al., 2012;
Shapovalov et al., 2013a). However, the intracellular elements
involved in controlling the stabilization of the channel on the
cell surface and the subsequent amplification of its activity are
currently unknown.
Several studies show that TRP channels can be regulated
by partner proteins affecting their trafficking to the plasma
membrane (Vogel et al., 2007) and/or their channel activity
(van de Graaf et al., 2003, 2006; Gkika et al., 2004, 2006a,b;
Sinkins et al., 2004; Chang et al., 2005; Köttgen and Walz,
2005). Indeed, the regulated translocation of TRP channels
appears to be a key mechanism for the gating of
constitu-tively active subunits, as well as for enhancing the activity
of stimulus-gated channels (Shapovalov et al., 2013a). Thus,
the identification of the molecular components implicated in
this cellular process is of great importance in understanding
not only the regulatory mechanisms of TRP channels but also
their function.
To identify and characterize the molecular determinants
of TRPM8 regulation, we performed a screening for TRPM8
partner proteins in the prostate, where the channel is primarily
expressed. As a result, we have identified a previously
uncharac-terized protein family as a first example of TRPM8 regulators.
present on the beads and was detected in the precipitated
com-plex (IP) with TCAF1 and TCAF2. No band was detected in
precipitated complexes from cells that were not transfected with
TRPM8 or cells immunoblotted for another protein such as actin,
which indicates the specificity of the interaction (Fig. 3 B). TCAF
interactions with additional TRP channels were also analyzed
a lesser extent with the TRPM8 C-terminal tail (GST-M8C),
whereas no interaction was observed with GST alone (Fig. 3 A).
This interaction was further confirmed by immunoprecipitation
experiments in human embryonic kidney (HEK) 293 cells
trans-fected with either HA-tagged TCAF1 or myc-tagged TCAF2,
with or without his-tagged full-length TRPM8. TRPM8 was
Figure 1. Bayesian phylogenetic tree of the ver-tebrate TCAF1/TCAF2/TCAF3 genes and tissue expression pattern of the human homologues. (A) The maximum likelihood tree was similar but for one node: the cow and horse FAM115C se-quences were sister groups. The phylogenetic re-construction displays two duplication events, one during the early period of mammalian evolution and the other during rodent evolution. The scale bar represents the number of expected changes per site. (B) Analysis of TRPM8, TCAF1, and TCAF2 mRNA expression levels by qPCR in sev-eral human tissues. Values are expressed relative to 18S rRNA expression, and further normalized to TRPM8 levels in the prostate. Values are pre-sented as means of three experimental repeats ± SEM (error bars; n = 3 for a single experiment).
revealed significant FRET between TRPM8 and TCAF1 or
TCAF2 (Fig. 3 F). In control experiments on HEK cells
ex-pressing TRPM8-mTurquoise2 and free SYFP2, no significant
variation of mTurquoise2 lifetime was detected (Fig. 3 F), and
calculated E
FRETwas found to be below the confidence threshold
of 1%. These observations altogether with biochemical
analy-sis of interaction confirmed in living cells that TCAFs are
part-ners of the TRPM8 channels.
TCAFs exert opposing regulatory effects on TRPM8-mediated currents
To assess the functional effect of TCAF1–TCAF2 interactions
with the TRPM8 channel in human prostate cells, we performed
a series of patch-clamp experiments. The silencing of native
TCAFs by siRNAs to TCAF1 or -2 was monitored by RT-PCR
after 72 h, and specifically abolished TCAF1 or -2 expression
by coimmunoprecipitation to check whether TCAF is a
TRPM8-exclusive partner. Altogether, these results show that TCAFs
are potential partner proteins for other TRP channels, such as
TRPV6 and the short isoform of TRPM2 (
Fig. S1, A and B
).
Confocal imaging of the cells transfected with HA-tagged
TCAF1 or myc-tagged TCAF2 and labeled with TRPM8
anti-bodies confirmed that both TCAFs colocalize with TRPM8
(
Fig. S2, A and B
). Direct interaction between the two proteins
in living cells was confirmed by means of Förster resonance
en-ergy transfer (FRET) using the time-domain fluorescence lifetime
imaging microscopy (TD FLIM). After the 24-h transfection,
HEK cells expressing TRPM8-mTurquoise2 and TCAF-SYFP2
(Fig. 3 C) were analyzed using the time-correlated single
photon counting (TCSPC) of the donor fluorescence (Fig. 3,
D and E), and the lifetime of mTurquoise2 was computed on
a pixel-by-pixel basis (Fig. 3, D and E). Statistical analysis
Figure 2. Human homologues of TCAF3. Alignment of hFAM115A (TCAF1) and hFAM115C (TCAF2) with the murine EAPA2 (TCAF3) protein. Amino acid residues are highlighted in black when present in the three proteins and in gray when they are present in only two of them.
Figure 3. TCAF1 and TCAF2 interact and colocalize with TRPM8. (A) GST pull-down assay using [35S]methionine-labeled TCAF1 or TCAF2 protein and GST or GST fused to the TRPM8 N-terminal tail (GST-M8N) or C-terminal tail (GST-M8C). (B) Cells transfected with HA-tagged TCAF1 or myc-tagged TCAF2 with (HEK-M8) or without (HEK) his-tagged full-length TRPM8, and total lysates (TL) were used for immunoprecipitation and subsequent immunoblot analysis. Immunoprecipitation of the channel was confirmed by immunoblotting for TRPM8, and the coimmunoprecipitation of TCAF1 or TCAF2 proteins was detected using an anti-HA or anti-myc antibody, respectively, on the immunoprecipitated complex (IP). No coimmunoprecipitation was detected in control immunoblots for actin. The black lines on the HA-TCAF1 blots indicate the removal of intervening lanes for presentation purposes. (C–F) TCAF1/2-to-TRPM8 binding was assessed by measuring FRET with TM FLIM in HEK293 cells after a 24-h transfection. The TCSPC approach was chosen to achieve a good spatial resolution, which would allow discriminating TRPM8-ER localization. (C) An example of concomitant expression of TRPM8-mTurquoise2 (cyan) and TCAF1-SYFP2 (yellow). (D and E) Representative FRET-FLIM images for TRPM8-mTurquoise alone and for TRPM8-mTurquoise + TCAF1-SYFP2, respectively. Grayscale-coded fluorescence images of the donor of FRET (left images in D and E; fluorescence intensity [FI] is given in arbitrary units [a.u.]) were analyzed by the phasor plot method (Phasor) to compute FLIM images (mean) showing the mean lifetime (ns; right images of D and E). The outlines define the regions of interest for which mean lifetime of the donor of fluorescence was calculated. Bars, 10 µm. (F) Chart representing the mean lifetime of TRPM8-mTurquoise2 alone, coexpressed with the negative control SYFP2, or with TCAF1-SYFP2 or TCAF2-SYFP2. FRET efficiency (EFRET) is shown on the top of the chart. Values are presented as means ± SD (error bars). ***, P < 0.001.
using biotin labeling. Cell-surface biotinylation experiments
showed that both TCAFs enhanced channel expression in the
biotinylated fraction when compared with cotransfection with
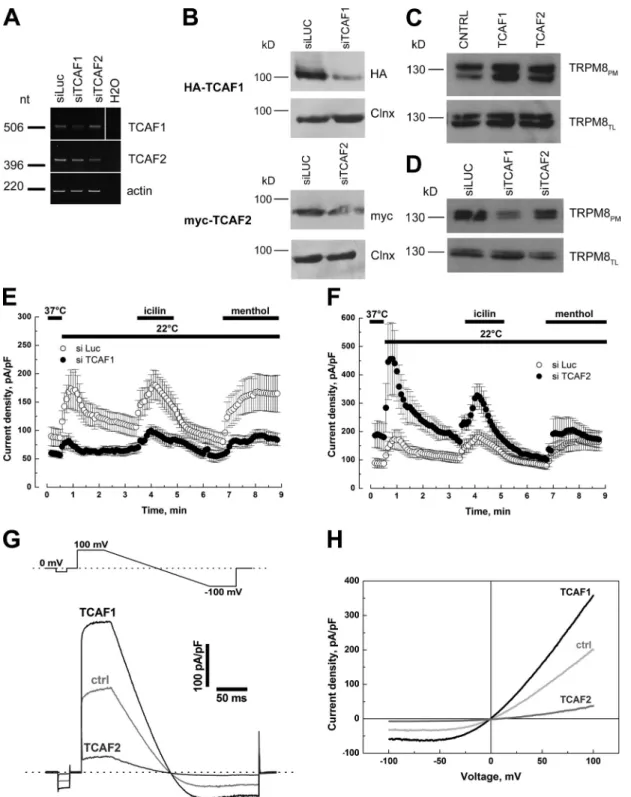
at both the mRNA (Fig. 4 A) and protein levels, as seen after
transfection with vectors expressing tagged proteins (Fig. 4 B).
We then examined the role of the TCAFs in TRPM8 trafficking
Figure 4. TCAF1 and TCAF2 proteins have opposing effects on TRPM8 activity. (A) Reverse-transcription PCR showing the specific decrease of TCAF1 (top) and TCAF2 (bottom) bands after cell transfection with 100 nM of the respective siRNAs. Actin was used to normalize relative expression, and siRNA to luciferase was used as a negative silencing control (siLuc). The white line on the TCAF1 gel indicates the removal of intervening lanes for presentation purposes. (B) Western blot analysis confirming the siRNA effect on HA-TCAF1– (top) and myc-TCAF2–transfected cells (bottom). Calnexin (Clnx) was used as a loading control. (C and D) Cell surface biotinylation analysis of TRPM8-transfected cells cotransfected with the empty vector (CTRL), TCAF1, or TCAF2 (C), or co-treated with siLuc, siTCAF1, or siTCAF2 (D). TRPM8 expression was analyzed by immunoblotting the plasma membrane fraction (TRPM8PM) or total cell lysates (TRPM8TL). Shown is the mean time course of cold- (22°C), icilin- (10 µM), and menthol-activated (500 µM) ITRPM8 in LNCaP cells transiently transfected with TRPM8 and treated with siLuc (open circles), siTCAF1 (E), or siTCAF2 (F; closed circles). Values are expressed as means ± SEM (error bars). (G) Single traces of menthol-evoked currents recorded in a representative LNCaP cell (out of five different cells per condition) transfected with TRPM8 and either an empty vector (ctrl), TCAF1, or TCAF2. Stimulation protocol is presented in the top panel. The corresponding IV relationships are presented in H.
icilin application was very different between control,
TCAF1-transfected, and TCAF1
PI3K-transfected cells: 270.2 ± 52.5 nM,
1,375.1 ± 174.3 nM, and 692.6 ± 178.3 nM (Fig. 5 C). These
results show a dramatic halving of TCAF1 function when its
PI3K homology domain is removed, proving the importance of
this domain in the mediation of TCAF1’s effect on TRPM8.
To assess the functional role of the TCAF1 PI3K domain on
TRPM8 activity, the effect of pretreatment with 1 µM
wortman-nin was tested on cells transfected with either wild-type TCAF1
or TCAF1
PI3K. While TCAF1-transfected cells revealed strong
sensitivity to wortmannin, the TRPM8-mediated current in
TCAF1
PI3K-transfected cells was wortmannin insensitive (Fig. 5,
D and E). Currents elicited by cold, icilin, and menthol were,
re-spectively, 435.2 ± 76.8, 254.7 ± 42.7, and 275.3 ± 52.2 pA/pF in
control (n = 4), and 78.5 ± 22.7, 76.9 ± 16.2, and 57.1 ± 11.8
pA/pF in wortmannin-treated TCAF1-transfected cells (n = 5);
and 142.7 ± 25.9, 172.7 ± 29.9, and 130 ± 23.4 pA/pF in control
(n = 4), and 188.7 ± 70.8, 191.6 ± 80.1, and 135.6 ± 34.5 pA/pF
in wortmannin-treated TCAF1
PI3K-transfected cells (n = 6).
We then examined the effect of this domain on TRPM8
trafficking to the plasma membrane. Cotransfection of TRPM8
with TCAF1 or TCAF1
PI3Kfollowed by cell-surface
biotinyl-ation showed that both TCAF1 and its truncated form enhanced
channel expression in the biotinylated fraction compared with
cotransfection with the empty vector (Fig. 5 F).
TCAF1 and TCAF2 exert opposing regulatory effects on endogenous TRPM8 activity
To analyze whether TCAF1 and TCAF2 are involved in the
regu-lation of native TRPM8, we examined how the level of TCAF1
or TCAF2 expression would affect menthol-induced [Ca
2+]
i
responses in LNCaP cells, which naturally express TRPM8
(Valero et al., 2011, 2012). We first confirmed TRPM8 expression
and activity in these cells by using siRNAs targeting the
chan-nel (Fig. S2, E and F). Next, we compared [Ca
2+]
i
responses to
200 µM menthol in fluo-4–loaded control LNCaP cells, LNCaP
cells overexpressing either TCAF1 or TCAF2, and LNCaP cells
pretreated with either control siRNA (siLuc), TCAF1 siRNA, or
TCAF2 siRNA (Fig. 6). The siRNA experiments were also
per-formed in human epithelial prostate cells, Ep156T (
Fig. S3
). Our
results revealed that both the amplitude of the response and its
temporal profile depended on the level of TCAF1 and TCAF2
expression. In control (Fig. 6 A) and TCAF1-overexpressing
(Fig. 6 B) LNCaP cells, as well as in LNCaP (Fig. 6 E) and
Ep156T (Fig. S3 A) cells pretreated with siLuc or siTCAF2
(Fig. 6 G and Fig. S3 C), menthol triggered a high-amplitude
[Ca
2+]
i
transient. The magnitude of this oscillatory response was
significantly reduced in cells overexpressing TCAF2 (Fig. 6 C)
and was increased after pretreatment with siTCAF2 (Fig. 6 G
and Fig. S3 C). In LNCaP cells overexpressing TCAF1, an initial
phase of the menthol-induced response was followed by several
long-period [Ca
2+]
i
oscillations of smaller amplitude (Fig. 6 B),
whereas pretreatment with siTCAF1 virtually abolished all the
response in both LNCaP (Fig. 6 F) and Ep156T (Fig. S3 B). As
the temporal pattern of the [Ca
2+]
i
response to TRPM8
activa-tion is complex, to quantify the effects of TCAF overexpression
an empty vector (Fig. 4 C), whereas siRNA to TCAF1
signifi-cantly decreased channel abundance on the plasma membrane
compared with control siRNAs (siLuc; Fig. 4 D).
In terms of channel activity, TCAF1 silencing in these
cells at 37°C induced a decrease in basal TRPM8 activity from
88.2 ± 15.5 to 58.9 ± 5.3 pA/pF (Fig. 4 E). A similar inhibitory
effect was observed on I
TRPM8currents evoked by cold, icilin, and
menthol, which decreased from 158.1 ± 73.7, 111.6 ± 38.5, and
54.9 ± 16.4 pA/pF in control cells (n = 12) to 22.8 ± 13.3, 40.8 ±
10.1, and 32.3 ± 11.1 pA/pF, respectively, in cells transfected
with TCAF1 siRNA (siTCAF1; n = 8). In contrast, TCAF2
si-lencing led to an increase in basal I
TRPM8amplitude from 88.2 ±
15.5 to 187.4 ± 47.9 pA/pF (Fig. 4 F), whereas responses to
cold, icilin, and menthol were increased from 158.1 ± 73.7,
111.6 ± 38.5, and 54.9 ± 16.4 pA/pF in control cells (n = 12)
to 341.3 ± 131.9, 164.2 ± 42.3, and 115.7 ± 62.2 pA/pF,
re-spectively, in cells treated with TCAF2 siRNA (siTCAF2;
n
= 4). A histogram summarizing these results at both +100 and
100 mV is presented in Fig. S2 C, and shows similar effects
of partner proteins silencing at both potentials. The
overexpres-sion of TCAF1 and TCAF2 had an opposite effect to that of
the siRNAs, confirming the activating role of TCAF1 and the
inhibitory role of TCAF2 on TRPM8 activity (n = 5; Fig. 4,
G and H; and Fig. S2 D). These results clearly show that TCAF1
and -2 can modulate TRPM8 basal activity, therefore
suggest-ing a potential role of this interaction in controllsuggest-ing calcium
ho-meostasis. Moreover, TCAF1 and -2 effects on TRPM8 activity
were equally observed for all tested potentials, thus precluding
the existence of a voltage-dependent component to these
inter-actions (Fig. 4 H).
The C-terminal tail of TCAF1 plays a critical role in TRPM8 regulation
TCAF1 and -2 both bind to TRPM8 and augment its targeting to
the plasma membrane, while having different effects on channel
activity. We therefore searched the protein sequences of TCAF1
and TCAF2 for domains that could explain this disparity. A low
homology with the PI3K domain was predicted using the
Con-served Domains software tool from NCBI on the C-terminal
tail of TCAF1. Interestingly this domain is missing from the
TCAF2 sequence, as shown in the diagram in Fig. 5 B.
To validate this putative PI3K domain in TCAF1 and assess
its role in TRPM8 regulation, we first used a pharmacological
approach, namely, a commonly used PI3K inhibitor wortmannin,
at 1 µM. As shown in Fig. 5 A, pretreatment with wortmannin
re-sulted in a massive decrease in I
TRPM8amplitude under resting
conditions as well as during exposure to cold, icilin, or menthol.
Second, we generated a truncated version of TCAF1,
which lacks the C-terminal tail that contains the PI3K
homol-ogy domain (TCAF1
PI3K) and resembles TCAF2. The direct
interaction of TCAF1
PI3Kwith TRPM8 cytosolic tails was
ex-amined by GST pull-down. In vitro-translated [
35S]methionine-labeled TCAF1 and TCAF1
PI3Kboth strongly interacted with
the TRPM8 N-terminal tail (GST-M8N) and to a lesser extent
with the TRPM8 C-terminal tail (GST-M8C; Fig. 5 B). The
functionality of TCAF1
PI3Kwas then assessed by Ca
2+imaging
pretreated with siLuc with that pretreated with either siTCAF1
or siTCAF2. Menthol-induced [Ca
2+]
i
responses were directly
correlated with changes in TCAF1 expression but inversely
correlated with changes in TCAF2 expression, which indicates
and siRNAs, we compared the fluo-4 signal during the first 18
min after menthol application in control LNCaP cells with that
in LNCaP cells overexpressing TCAF1 or TCAF2 (Fig. 6 D),
and the signal in LNCaP (Fig. 6 H) and Ep156T cells (Fig. S3 D)
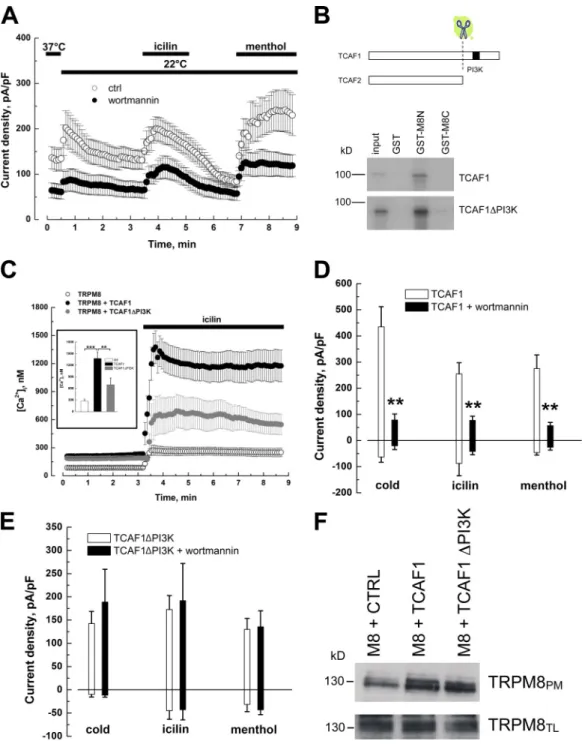
Figure 5. TCAF1 exhibits a PI3K homology domain that is critical for the TCAF1 modulation of TRPM8 activity. (A) Mean time course of cold- (22°C), icilin- (10 µM), and menthol-activated (500 µM) ITRPM8 in LNCaP cells pretreated (closed circles) or not (ctrl, open circles) for 15 min with 1 µM wortmannin. For pretreated cells, experiments were performed in the continuous presence of wortmannin at the same concentration. Currents were monitored at +100 mV, and results are presented as means ± SEM (error bars). (B) GST pull-down assay between [35S]methionine-labeled TCAF1 or TCAF1PI3K protein and GST or GST fused to the TRPM8 N-terminal tail (GST-M8N) or C-terminal tail (GST-M8C). A schematic representation of TCAF1 and TCAF2 protein sequences and the putative PI3K site is shown. (C) Time course of mean intracellular Ca2+ concentration in LNCaP cells transfected with TRPM8 and an empty vector (ctrl, open circles), wild-type TCAF1 (TCAF1, black closed circles), or a truncated TCAF1 lacking the PI3K domain (TCAF1PI3K, gray closed circles). Cells were loaded with Fura 2-AM, exposed to 10 µM icilin, and variations in [Ca2+]i were monitored using an imaging system. Results are presented as means ± SEM (error bars). (inset) Histogram summarizing calcium imaging results (**, P < 0.01; ***, P < 0.001). (D and E) Histograms presenting mean cold- (22°C), icilin- (10 µM), and menthol-activated (500 µM) ITRPM8 in LNCaP cells transiently transfected with TRPM8 and wild-type TCAF1 (D) or TCAF1PI3K (E), and then treated (black columns) or not (white columns) with 1 µM wortmannin. Results at +100 and 100 mV are presented as means ± SEM (error bars; **, P < 0.01). (F) Cell surface biotinylation analysis of cells cotransfected with TRPM8 and the empty vector (CTRL), TCAF1, or TCAF1PI3K. TRPM8 expression was analyzed by immunoblotting the plasma membrane fraction (TRPM8PM) or total cell lysates (TRPM8TL).
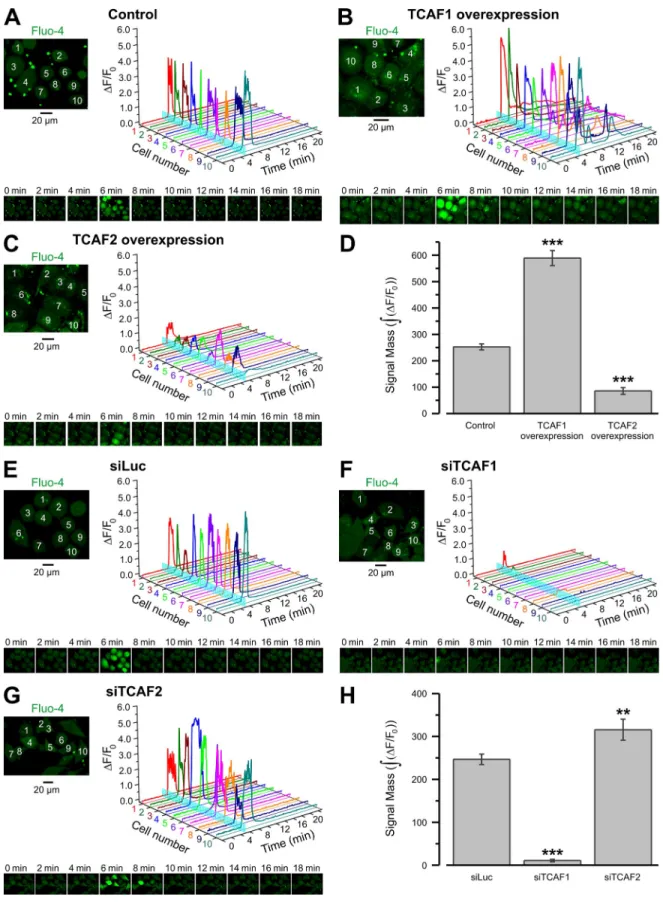
Figure 6. The menthol-induced response of endogenous TRPM8 is modulated by TCAF1 and TCAF2. (A–G) Changes of [Ca2+]i in response to the activation of TRPM8 with 200 µM menthol were monitored using an x-y time-series imaging of fluo-4 fluorescence in control LNCaP cells (A), LNCaP cells overex-pressing TCAF1 (B) or TCAF2 (C), and LNCaP cells pretreated with siLuc (E), siTCAF1 (F), or siTCAF2 (G). Images were acquired at 0.6 Hz from confocal optical slices <4 µm. The fluorescence intensity (F) was normalized to the averaged fluorescence intensity before menthol application (F0). Relative changes in fluorescence intensity (F/F0), averaged within each of 10 cells denoted by the numbers on the images (left), are plotted over time. Menthol application is depicted on the 3D plots by vertical cyan bars. The galleries below the plots demonstrate the images of fluo-4 fluorescence captured at times indicated above the images. Bar diagram plots compare masses of the fluo-4 signal,
∫
(∆F F0),during the first 18 min after menthol application (D) in LNCaP cells overexpressing TCAF1 (n = 48) or TCAF2 (n = 51) versus control LNCaP cells (n = 62), and in LNCaP cells (H) pretreated with siTCAF1 (n = 56) or siTCAF2 (n = 42) versus LNCaP cells pretreated with siLuc (n = 52). Values are expressed as means ± SEM (error bars). ***, P < 0.001; **, P < 0.01.states in the 4c2o model, emphasizing the significance of these
additional kinetic states in activity of TRPM8. In other words,
the binding of TCAF1 to the TRPM8 channel introduces new
kinetic states that are necessary for a satisfactory description
of TRPM8 gating, which implies a direct binding of TCAF1
to TRPM8.
TCAF1 but not TCAF2 shows expression patterns similar to TRPM8 during
carcinogenesis, and slows down cell migration
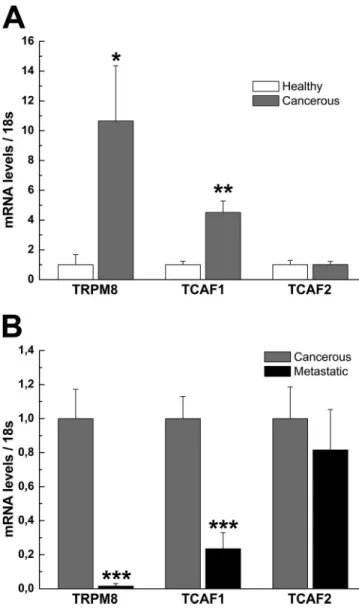
Given the fact that TRPM8 is a marker for prostate cancer, we
investigated by qPCR whether the expression of its interacting
proteins, TCAF1 and TCAF2, was also associated with prostate
cancer development. We initially studied TRPM8, TCAF1, and
TCAF2 expression in healthy and cancerous human prostate
re-section samples. Patients were included in the study when both
tumoral and nontumoral (healthy) tissue could be obtained from
the same individual. TRPM8 and TCAF1 expression were
sig-nificantly increased in cancerous samples when compared with
healthy ones (10 and 5 times, respectively; n = 7–10 for each
condition, P < 0.05), whereas no difference was observed for
the TCAF2 transcript (Fig. 8 A).
We then assessed the variation in expression of these
tran-scripts between localized prostate cancer and metastasis to the
bone marrow of patients previously subjected to androgen
abla-tion therapy. qPCR analysis showed a clear decrease in both
TRPM8 and TCAF1 expression in metastatic samples in
com-parison with localized prostate cancer (n = 7–10 for each
con-dition, P < 0.01). TCAF2 expression remained unchanged, as
before (Fig. 8 B).
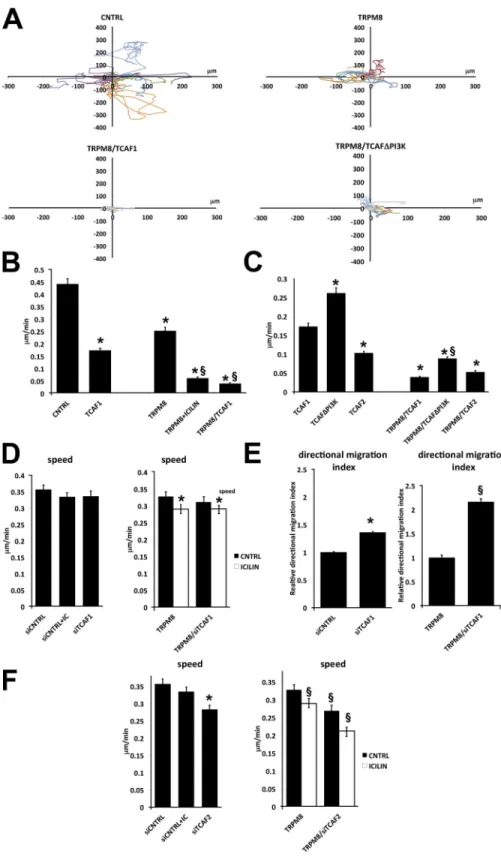
To verify that the similar expression patterns of TRPM8
and TCAF1 during carcinogenesis were also important at the
functional level, we investigated the role of TCAF1 in prostate
cell migration by performing time-lapse microscopy
experi-ments on either PC3 or LNCaP prostate cancer cells (Fig. 9).
TRPM8 overexpression significantly decreases the cell
migration speed, and this effect is exacerbated in the presence
of icilin stimulation (Fig. 9, A and B), in accordance with our
previous results on wound healing and transwell assays (Gkika
et al., 2010). Moreover, TCAF1 overexpression significantly
decreased the cell migration speed (Fig. 9, A and B) even in the
absence of TRPM8 (Fig. 9 B). However, when overexpressed
together with TRPM8, we observed a further significant
de-crease in the speed, which indicates that the TCAF1 effect is, at
least partially, mediated by TRPM8 (Fig. 9, B and C). To test
whether the inhibition of cell migration was due to the PI3K
domain of TCAF1, we performed cell migration assay in cells
overexpressing TCAF1
PI3K(Fig. 9, A and C). We indeed
ob-served a significant increase in the migration speed of cells
transfected with TCAF1
PI3Kversus TCAF1-transfected cells
(Fig. 9, A and C); this effect is further increased in the presence
of TRPM8 (Fig. 9 C). These results are in agreement with
mod-ulation of TRPM8-mediated current by PI3K domain of TCAF1
(Fig. 5, D and E). Although TCAF2 inhibits the migration speed
in the absence of TRPM8, it significantly increases the speed
when TRPM8 is expressed (Fig. 9 C).
that TRPM8 channel opening is facilitated by TCAF1 and
sup-pressed by TCAF2.
TCAF1 binding introduces new kinetic states to TRPM8 single channel activity
Next, we checked for any potential effect of TCAF1/TCAF2 on
TRPM8 activity at the single channel level. These experiments
were performed in HEK 293 cells expressing TRPM8 under
the control of a tetracycline-inducible promoter (HEK-293
M8i;
Thebault et al., 2005) in order to limit the contamination of
our recordings by the activity of other channels. Control
HEK-293
M8icells as well as cells transfected with TCAF1 or TCAF2
plasmids were subjected to a short tetracycline induction as
de-scribed. Then, TRPM8 activity was measured in cell-attached
configuration by first recording activity at room temperature
followed by the application of 100 µM menthol (see
Fig. S4
for sample traces). While comparing activity in control and
TCAF1-transfected cells, two types of activity became
appar-ent (Fig. 7 A). The first type, characterized by short, separate
openings, was most common to control cells (19 control and 4
TCAF1-bound traces), whereas the second type exhibited the
clustering of openings without any apparent increase in opening
duration and was prevalent in TCAF1-transfected cells (5
con-trol and 29 TCAF1-bound traces). In contrast, cells transfected
with TCAF2 and induced according to an identical protocol
ex-hibited virtually no TRPM8 activity (only 4 out of 31 traces
exhibited TRPM8 opening), leading us to conclude that TCAF2
silences the TRPM8 channel (unpublished data).
To further study how TCAF1 binding modifies TRPM8
gating properties, the acquired traces were scrutinized for the
appearance of multiple conductance levels, and those containing
single-channel activity (four control and three TCAF1-bound)
were individually analyzed, as described previously (Qin and
Li, 2004; Fernández et al., 2011). Fig. 7 (B–D) summarizes
dwell-time distributions, kinetic rates, and energy landscapes
representing typical control and TCAF1-bound TRPM8 activity
at room temperature and after stimulation by menthol.
Interest-ingly, stimulation of TRPM8 activity by menthol only led to
changes in the energy of the closed states, correspondingly
in-creasing the frequency of channel openings while preserving the
overall model. However, the effect of TCAF1 was qualitatively
different. Although the analysis of control activity showed that
the gating of TRPM8 alone could be reliably described by a
rela-tively simple model, containing three closed and one open kinetic
states (the 3c1o model; two upper panels on Fig. 7, C and D),
this was not the case for the TCAF1-bound activity, suitable
representation of which required a more complex model with
four closed and two open states (the 4c2o model; two lower
panels on Fig. 7, C and D).
Fig. S5
compares the fits of the
TRPM8 activity by the 4c2o and 3c1o kinetic models.
Analy-sis of the activity of TRPM8 alone (Fig. S5, A and C) shows
that both models yield identical log likelihood with additional
states of the 4c2o model exhibiting virtually zero occupancy,
which validates the simpler 3c1o model. On the contrary,
analysis of the activity of TRPM8 interacting with TCAF1
(Fig. S5, B and D) shows significantly larger changes in log
likelihood as well as a nontrivial occupancy of the additional
acting on the directional persistence index (Fig. 9 E) and not on
the speed (Fig. 9 D). The effect on directional migration index
of siTCAF1 is exacerbated in the presence of TRPM8 (Fig. 9 E).
Finally, we studied the effect of native TCAFs on cell
migration with an siRNA approach. As expected, TCAF1
down-regulation increases migration, which interestingly occurs by
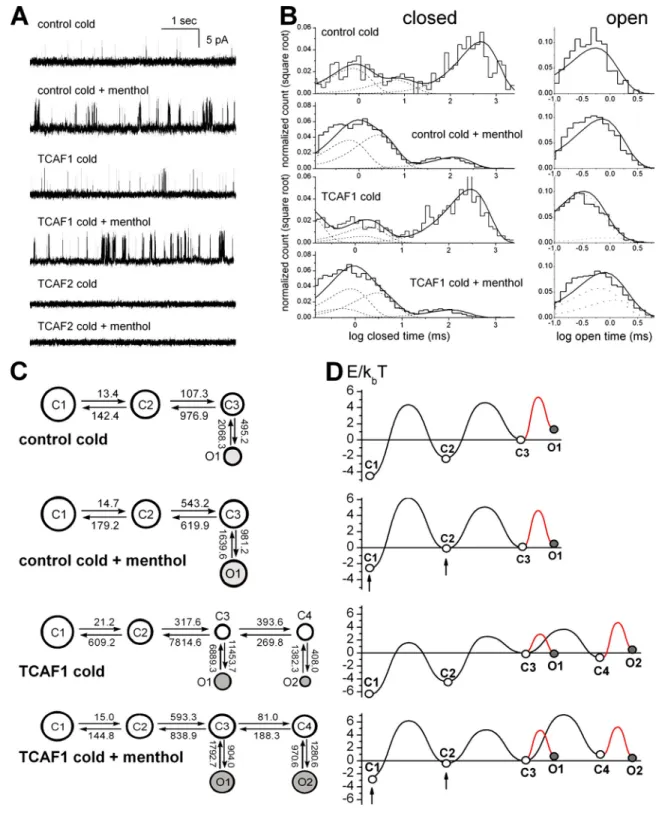
Figure 7. TCAF1 interaction with TRPM8 introduces new kinetic states. (A) Representative trace fragments of control and TCAF1-bound TRPM8 activity stimulated by cold (T = 20°C, controlled by room thermostat) or cold + 100 µM menthol, as indicated. (B) Representative distributions of closed (left) and open (Chetrite et al., 2000) dwell times in the traces of control and TCAF1-bound TRPM8 activity stimulated as indicated. The histogram shows the distribution of dwell times. The thick continuous line represents the cumulative best fit corresponding to the kinetic model used (C) and broken lines rep-resent individual components of the fit. (C) Kinetic models providing the best fit to the control and TCAF1-bound TRPM8 activity. The area of each circle is proportional to the log of total time spent the corresponding state. Kinetic rates are indicated as numbers associated with the corresponding arrows. (D) Energy landscapes calculated from the corresponding kinetic models. Arrows point to significantly shifted energies in corresponding states caused by menthol stimulation. Note that contrary to the effects of different modes of TRPM8 stimulation (shifts in state energies), the interaction with TCAF1 leads to the appearance of new kinetic states.
as well as electrophysiological measurements that the TCAFs
interact directly with TRPM8, exerting opposing effects on
channel activity. We have subsequently unraveled the molecular
mechanism of TCAF action on TRPM8 activity using directed
mutagenesis, biochemical assays, and single-channel analysis,
demonstrating: (1) a domain responsible for their distinct channel
regulation activities, (2) the effect of the TCAFs on channel plasma
membrane trafficking, and (3) the qualitative effect on TRPM8
activity via the introduction of new kinetic states during gating.
At the cellular level, the functional TCAF1–TRPM8 interaction
leads to the inhibition of cell speed, which is also supported by
the loss of expression of these proteins in human metastatic
speci-mens. Indeed these two proteins are mainly expressed in the
pros-tate, as demonstrated by the qPCR screening of human tissues.
Addressing the molecular mechanisms responsible for the
regulation of TRPM8 activity and expression by the TCAFs, we
have shown that the TCAFs interact mainly with the TRPM8
N-terminal tail. Our data imply that both proteins are critical for
TRPM8 function because their silencing prevents the channel’s
insertion into the plasma membrane. GST pull-down
experi-ments with in vitro translated TCAFs strongly point to the
di-rect binding of TCAFs to TRPM8, which is further supported
by the introduction of new kinetic states to TRPM8 single-channel
kinetics in the presence of the TCAF1 protein, whereas TCAF2
completely silences the channel while retaining it in plasma
membrane. Interestingly, this situation closely resembles the
role that subunits play in regulating T-type calcium channels
through the direct interaction of involved proteins (Gerster
et al., 1999). To understand the opposing modulatory effects of
TCAF1 and TCAF2, one has to look at sequence differences
between the proteins, such as the loss of the C-terminal
extrem-ity in TCAF2. However, the removal of this region in TCAF1
(TCAF1
PI3K) did not completely mimic the behavior of TCAF2,
and although TCAF1
PI3Koverexpression indeed leads to a
de-crease in I
TRPM8amplitude when compared with TCAF1, the
ex-tent of this decrease is significantly lower than that observed
with TCAF2 overexpression. The presence in this region of a
PI3K homology domain coupled with our observation that (1) a
PI3K inhibitor (wortmannin) inhibits TRPM8 activity and that
(2) this sensitivity to wortmannin is abolished in cells
overex-pressing TCAF1
PI3Kstrongly suggest that the regulatory role of
the TCAFs also involves phosphorylation. In this model, both
TCAF1 and TCAF2 proteins bind to TRPM8, affecting its
ex-pression on the plasma membrane. The presence of a functional
PI3K homology domain, however, is required to make the
chan-nel fully active. Moreover this domain is also critical for cell
motility because TCAF1
PI3Ktransfection partially reverts the
inhibitory effect exerted by TCAF1. However it should be noted
that because the TCAF1
PI3Kmutant implies the deletion of
TCAF1 C terminus, the loss of function may not be due only to
the disruption of the PI3K-specific enzymatic activity. More
ex-periments are thus needed to characterize the respective roles of
TCAF1 functional enzymatic domain and C terminus.
Our phylogenetic analysis revealed that human TCAF1
and -2 are homologues of rodent TCAF3 (EAPA2) and that
these three proteins form a new protein family originating from
two duplication events. TCAF3 was identified in 2006 by mass
However, we clearly show that TCAF2 has a strong
promigra-tory effect, which is more pronounced during TRPM8
activa-tion, as observed by the strong inhibition of cell migration in the
presence of siTCAF2 and icilin (Fig. 9 F).
Discussion
Ion channels are known to have protein partners that regulate
channel localization or gating, leading to important
physiologi-cal consequences. In some of the better known cases, such as
the T-type calcium channels, these proteins are even
acknowl-edged as subunits of the involved ion channel (Gerster et al.,
1999). Here, we present a family of proteins, the TCAFs, which
regulate the trafficking as well as gating of TRPM8, the ion
channel that is known to serve as a thermal sensor in peripheral
neurons and to play an important role in prostate cancer. We
have demonstrated by means of cellular and molecular biology
Figure 8. TCAF expression profile in prostate cancer. (A and B) Analysis of TRPM8, TCAF1, and TCAF2 mRNA expression levels by qPCR in healthy and cancerous human prostate samples (A), as well as in localized and metastatic human prostate cancer specimens (B). Values are calculated relative to 18S rRNA expression and presented as means ± SEM (error bars; n = 7–10; *, P < 0.05; **, P < 0.01; ***, P < 0.001).
different regulatory effects on TRPM8. In this regard, the relative
abundance of TCAFs and their competition in binding TRPM8
seems to be critical in the physiological regulation of the
chan-nel activity. This is further supported by the differences in TCAF’s
effect on single channel activity (the addition of one open state
for TCAF1), while their binding to the channel is similar, as
shown in the GST pull-down and coimmunoprecipitation assays.
Moreover, the expression of TCAF1 is universally and closely
spectrometric analysis as a new prostate-specific protein
regu-lated by androgens in mice (Fujimoto et al., 2006). At the time,
the function of TCAF3 was unknown and no homologues had
been identified in humans. Our discovery of the TCAF–TRPM8
interaction allows us to assign a role to this important family of
proteins, often coexpressed with the TRPM8 channel.
Interest-ingly, although TCAF1 and -2 share a common phylogenetic
ori-gin and exhibit a high degree of homology, they exert completely
Figure 9. TCAF functional role in prostate cancer cell migration. (A) Representative mi-gration plots of control (top left) and TRPM8-overexpressing cells (top right) or TRPM8 cotransfected with wild-type TCAF1 (bottom left) or truncated TCAF1 lacking the PI3K domain (TCAF1PI3K, bottom right). Each line represents the migration of one cell within a 10-h period. The data shown are from a single representative experiment out of three repeats. For the experiment shown: CNTRL
n = 28, TRPM8 n = 58, TRPM8/TCAF1 n =
69, TRPM8/TCAF1PI3K n = 98. (B and C) Bar graphs showing the quantification of cell speed in control nontransfected prostate can-cer cells (CNTRL), TRPM8-overexpressing cells (TRPM8), TCAF1-overexpressing cells (TCAF1), TRPM8- and TCAF1-overexpressing cells (TRPM8/TCAF1), and TRPM8 and TCAF1 lacking the PI3K domain (TCAF1PI3K) in the presence or absence of 10 µM icilin. (D–F) Bar graphs showing the quantification of cell speed (D) and the migratory persistence index (E, cal-culated as indicated in the online materials) in control cells and TRPM8-overexpressing cells in which TCAF1 or TCAF2 are down-regulated (TRPM8/siTCAF1), in the presence or absence of 10 µM icilin (F). Each graph represents the quantification of pooled independent ex-periments (at least three exex-periments for each experimental condition). For each experiment, at least 60 cells were followed per condition (*, P < 0.05 relative to CNTRL; § relative to TRPM8). Data are expressed as means ± SEM (error bars).
alignment. A data matrix containing 2,790 bp was further used for phylo-genetic analyses. Any sequence shorter than half the final matrix length was removed, yielding a total of 21 sequences (NM_203396, NM_001009534, BC000609, XM_519454, NM_001132598, NM_029930, XM_342675, XM_002711950, XM_843498, NM_001099054, NM_001130025, XM_ 519453, XM_539847, NM_001101924, XM_001490518, NM_ 146174, XM_001057103, XM_002190925, NM_001094696, NM_001089327, and NM_001089327). Phylogenetic reconstructions were performed with the maximum likelihood method (ML) using PhyML 3.0 (Guindon and Gascuel, 2003), and by Bayesian analyses using MrBAYES, version 3.1.2 (Huelsenbeck and Ronquist, 2001). The best-fit model under the ML criterion was selected from the “Akaike Criterion” out-put of MODELTEST, version 3.7 (Posada and Crandall, 1998). For the ML analyses, node stability was estimated by 100 nonparametric bootstrap repli-cates (Felsenstein, 1988). For the Bayesian analyses, the dataset was di-vided into three partitions according to codon positions. MODELTEST version 3.7 was used to calculate the best-fit model of sequence evolution for each partition. Two runs of four Markov chains were calculated simulta-neously for 4,000,000 generations with equal initial probabilities for all trees and starting with a random tree. Tree sampling frequency was each 100 generations and the consensus tree with posterior probabilities was calculated after removal of the first 25% of the total number of trees gener-ated, corresponding to 10,000 trees. The mean standard deviation of split frequencies between the two independent runs was <0.01.
qPCR
qPCR of mRNA transcripts was done using MESA GREEN qPCR MasterMix Plus for the SYBR Assay (Eurogentec) on the CFX96 Real-Time PCR Detec-tion System (Bio-Rad Laboratories) and the LightCycler System (Roche). The sequences of the primers were: for TRPM8, 5-CGGTCATCTACGAGCC-CTAC-3 and 5-CACACACAGTGGCTTGGACT-3; for TCAF1, 5-TTG-CCCACAGAAAATGTTGA-3 and 5-CAGATAGGCCAGGCTGGTAG-3; for TCAF2, 5-ACCACGAGAATGGGAACTTG-3 and 5-GAGCCTGTG-CAGGGATATGT-3; for 18S rRNA, 5-CAGCTTCCGGGAAACCAAA-GTC-3 and 5-AATTAAGCCGCAGGCTCCACTC-3; for actin, 5-TTG-CTGATCCACATCTGCTG-3 and 5-GACAGGATGCAGAAGGAGAT-3. -Actin mRNA and 18S rRNA were used as endogenous controls to nor-malize variations in RNA extraction, the degree of RNA degradation, and the variability of reverse transcription efficiency. To quantify the results, we used the comparative threshold cycle method described by Livak and Schmittgen (2001).
For regular PCR, the following primers were used: for actin, 5-CAGAGCAAGAGAGGCATCCT-3 and 5-GTTGAAGGTCTCAAAC-ATGATC-3; for TCAF1, 5-ATGGCGACTCCCTCTGCTGC-3, 5-CCC-AATCCCAGGCTTGTCCT-3, 5-CTACTGCTGCAAGGCGTACA-3, and 5-CCAGACCCTCGTAGCATCTT-3.
Cancer tissue sampling
Prostate tissue samples (prostate adenocarcinoma) were obtained from 15 patients with a mean age of 62.4 yr (ranging from 51 to 70) who under-went radical prostatectomy between January 2004 and June 2008 at the Department of Urology at the Lyon-Sud Hospital Centre. All fragments were snap-frozen and stored in liquid nitrogen until analysis. To ascertain whether the tissue was malignant or nontumoral and to confirm the Glea-son score, a histological analysis of frozen sections of each sample was performed by the same pathologist before RNA extraction. Fragments fully made up of tumoral tissue were selected and classified as “tumoral,” whereas samples containing no tumoral tissue were selected and classified as “nontumoral.” Fragments with a mix of normal and tumoral tissue were excluded from the study. Patients were included in the study when both a “tumoral” sample and a “nontumoral” sample could be obtained from the same individual.
In addition, we used nine samples from both localized and meta-static prostate cancer obtained after informed consent from patients with localized (T2a-b) PCa for whom a prostatectomy has been scheduled, and patients with metastatic PCa (M1), which progressed on androgen abla-tion therapy, were included in a clinical research program (Protocol ID 2897) sponsored by the Hôpitaux Universitaires de Strasbourg. A total volume of 3 ml of bone marrow were aspirated at a scintigraphic-indicated metastatic site. Microscopic observations were made from an aliquot of each bone marrow aspirate to confirm or rule out the presence of meta-static PCa cells. Total RNAs were extracted from small pieces of localized tumor by the use of the RNeasy midi kit (QIAGEN) and from bone marrow aspirates by the use of the Qiamp RNA blood kit (QIAGEN) according to the manufacturer’s instructions.
linked to TRPM8 expression, whereas the expression of TCAF2
is mostly independent and does not exhibit large variations.
Al-though coupling with TCAF2 completely silences TRPM8
ac-tivity, its physiological role is not clear in nonoverexpressing
systems. We speculate that this might be due to the loss of the
C-terminal domain in the human TCAF2. This result may be
different for other mammalian TCAF2s, as this domain is still
present in the genes we used for the phylogenetic analysis.
The highest expression of TRPM8 is in the prostate, where it
is suggested to play a role in carcinogenesis (Thebault et al., 2005;
Bidaux et al., 2007; Sabnis et al., 2008; Wondergem et al., 2008).
Prostate carcinogenesis is commonly associated with major
altera-tions in TRPM8 expression and its signaling pathway (Bavencoffe
et al., 2011; Gkika and Prevarskaya, 2011; Prevarskaya et al.,
2011; Shapovalov et al., 2013b). In support of this hypothesis,
our data reveal that TRPM8 and TCAF1 proteins show similar
expression patterns in all tissues studied. Specifically, TCAF1
expression levels increase in cancerous human prostate tissue
and drop in metastatic tissue, mirroring TRPM8 levels.
How-ever, the expression levels of TCAF2 remain unchanged, which
suggests the differential regulation of the two transcripts and
reflects their divergence at the functional level. These
observa-tions mark TCAF1 as a good candidate for inclusion in the list
of well-known prognostic markers such as TRPM8, prostein,
and the prostate-specific antigen (PSA), which are also
deregu-lated in localized primary prostate cancer, whereas their
overex-pression is lost again at advanced tumor stages (Schmidt et al.,
2006). Moreover, the increased TRPM8 activity and expression
linked to the presence of TCAF1 also affects cell migration, as
shown by our time lapse video microscopy experiments, and which
is in accordance with previous studies linking the overactivity of
TRPM8 protein with the reduced motility of prostate cancer cells
(Gkika et al., 2010). More specifically, TCAF1 exerts an
antimi-gratory effect on prostate cancer cells by acting on the cell
migra-tion persistence, thus confirming the role of TCAF1 as a TRPM8
activator. However, the complexity of interactions described and
the results of our initial GST pull-down, coimmunoprecipitations,
and migration assays suggest that TCAFs are partner proteins for
other ion channels, such as TRPV6 and the short isoform of
TRPM2, which clearly indicates the need for further studies.
Finally, although TCAFs are strongly expressed in the
pros-tate, we show that they are also detected in other tissues,
includ-ing the brain. It is therefore possible that TCAFs are not merely
limited to the role of partner proteins in prostate cells, but are
also required and can be therapeutically targeted in other tissues
for the stabilization of the expression and modulation of the
ac-tivity of this channel. For example, TCAFs and their associated
molecular pathways could be targets for pain management,
ac-cording to several recent studies on TRPM8 and allodynia (Chung
et al., 2011; Descoeur et al., 2011; Su et al., 2011; Kawashiri
et al., 2012; Shapovalov et al., 2013a).
Materials and methods
Phylogenetic analysis
For the three genes TCAF1, TCAF2, and TCAF3, homologous sequences were downloaded from GenBank. Sequences were aligned using Seaview version 4.2.6 (Gouy et al., 2010) and manually adjusted for amino acid
transformed with the pGEX6P-2 constructs and cultured in 2XTY medium containing ampicillin (100 µg/ml) at 37°C until the OD reached 0.4–0.6. IPTG was then added to a final concentration of 0.2 mM to induce expres-sion at 30°C for 4 h. The bacteria were pelleted and resuspended in STE buffer I (10 mM Tris-HCl,150 mM NaCl, and 1 mM EDTA, pH 8.0), and the cells were broken by lysozyme (10 mg/ml) incubation. After adequate sonication, the broken cells were pelleted at 13,000 rpm for 30 min at 4°C, and the supernatant was collected for purification. Because pGEX-6P-2 contains the coding region for GST, we used glutathione Sepharose 4B beads (GE Healthcare) to purify the TRPM8 N and C tails.
TCAF1, TCAF2, and TCAF1PI3K proteins were labeled with [35S] methionine using a reticulocyte lysate system as per the manufacturer’s in-structions (Promega), added to purified GST fusion proteins, and immobi-lized on glutathione Sepharose 4B beads in PBS containing 1% vol/vol Triton X-100. After a 2-h incubation at room temperature, the beads were washed extensively and bound proteins were eluted with SDS-PAGE load-ing buffer, separated on 10% wt/vol SDS-PAGE gels, and visualized by autoradiography.
Preparation of prostate lysates, pull-down assay, and Fourier transform mass spectrometric analysis
The prostate was isolated from two 12-wk-old C57BL/6 male mice, which were sacrificed under 1.5% vol/vol isoflurane anesthesia (Nicholas Pira-mal Limited). The aniPira-mal ethics board of the Radboud University Nijmegen approved all animal experimental procedures.
The two prostates were homogenized in homogenization buffer A (HbA; 20 mmol/liter Tris/HCl, pH 7.4, 5 mmol/liter MgCl, 5 mmol/liter NaH2PO4, 1 mmol/liter EDTA, 80 mmol/liter sucrose, 1 mmol/liter PMSF, and 5 g/ml leupeptin and pepstatin). The protein concentration of the ho-mogenates was determined with the Bio-Rad protein assay (Bio-Rad Labo-ratories). The lysates were subjected to GST pull-down with theTRPM8 N- and C-terminal tail GST fusion proteins while GST alone and another TRP chan-nel (TRPV6 C-tail) were used as binding controls (as described in the GST pull-down section).
GST-precipitated proteins were subjected to Fourier transform mass spectrometry (FT-MS) in the Radboud Proteomics Centre as described previ-ously (Vogel et al., 2007). In brief, proteins were separated on a conven-tional 10% SDS-PAGE gel, then the gel was cut into eight slices for digestion by trypsin (two slices per lane, one for high molecular weight and one for low: S1 and S2 for GST, S3 and S4 for GST-TRPV6 C tail, S5 and S6 for GST-TRPM8 N tail, and S7 and S8 for GST-TRPM8 C tail). Peptide identifi-cation experiments were performed using a nano-HPLC 1100 nanoflow system (Agilent Technologies) connected online to a linear quadrupole ion trap-Fourier transform mass spectrometer (LTQ-FT; Thermo Fisher Scientific). Peptides and proteins were identified using the Mascot (Matrix Science) algorithm to search a local version of the NCBInr database (http://www .ncbi.nlm.nih.gov). First-ranked peptides were parsed from the Mascot da-tabase search HTML files with MSQuant (http://msquant.sourceforge.net) to generate unique first-ranked peptide lists. The full list of interacting pep-tides can be found in Table S1 and the summary of the number of inter-acting peptides in Table S2.
Cell culture and transfection
HEK 293 and lymph node carcinoma of prostate (LNCaP) C4-2 cells (pro-vided by F. Viana, Instituto de Neurociencias de Alicante, Universidad Miguel Hernandez, CSIC, Alicante, Spain; and L.A. Pardo, Max-Planck-Institute of Experimental Medicine, Göttingen, Germany) were grown in DMEM and RPMI 1684 (Invitrogen), respectively, supplemented with 10% fetal calf serum (Poly-Labo; Seromed), l-glutamine (5 mM; Sigma-Aldrich), and kanamycin (100 mg/ml; Sigma-Aldrich). Human epithelial prostate cells, Ep156T, were a gift of V. Rotter (Weizmann Institute of Science, Rehovot, Israel) and were grown in MCDB 153 modified by Biological Industries as described previously (Kogan et al., 2006).
Cells were transfected with 2 µg of each construct or 50 nM of siRNA and 0.2 µg of pmax GFP using either Nucleofector (Amaxa) or Fu-GENE HD reagent (Roche) and HiPerFect Transfection Reagent (QIAGEN). Control experiments were performed by transfecting the empty vector or siRNA to Luciferase (siLuc).
Cells were used for patch-clamp experiments 24 h after nucleofec-tion and for cell surface biotinylanucleofec-tion 48 h after transfecnucleofec-tion.
Immunoprecipitation and immunoblotting
Cells were cotransfected with a his-tagged hTRPM8pcDNA4 plasmid and human influenza agglutinin (HA)-tagged TCAF1 or myc-tagged TCAF2, washed twice with PBS, and incubated for 60 min on ice in lysis buffer (1% The ethics committee of the faculty of medicine and the state medical
board agreed to these investigations, and informed consent was obtained from all patients.
Cloning and siRNA
The coding sequence of the N-terminal tail of TRPM8 (690 aa, S2-K691) was amplified from the hTRPM8pcDNA4 plasmid (Thebault et al., 2005) and cloned into the pGEX6p-2 vector (tac promoter) for chemically in-ducible, high-level expression of GST-tagged recombinant proteins (GE Healthcare) as a BamHI–XhoI fragment using the primers 5-CGGGAT-CCTCCTTTCGGGCAGCCAG-3 and 5-CCGCTCGAGTCACTTGGTG-TCTCGGGAAATC-3. Similarly, the C-terminal tail of TRPM8 (124 aa, G980-K1104) was cloned as a BamHI–XhoI fragment into the tac promoter pGEX6p-2 vector using the primers 5-CGGGATCCGGCTACACGGT-GGGCAC-3 and 5-CCGCTCGAGTCACACGAGTTTGATTTTATTAGC-AATC-3. The TCAF1 and TCAF2 genes were cloned in the pGEM-T Easy vector (T7 and SP6 RNA polymerase promoter; Promega) from normal human prostate poly(A)+ RNA (Takara Bio Inc.) using the following primers: for TCAF1, 5-ATGGCGACTCCCTCTGCTGC-3 and 5-TCAGTGGGGCA-TCTGTGTGAGG-3; for TCAF2, 5-ATGGCGACCATTGCTGCTGC-3 and 5-TCATCCCCTTCTCCCAGAATTTCTGC-3. TCAF1 and TCAF2 were both subcloned as EcoRI fragments into the pCMV-TnT vector (CMV promotor; Promega), TCAF1 as a XhoI fragment in the pCMV-HA vector (CMV promo-tor; Takara Bio Inc.), and TCAF2 as an EcoRI fragment in the pCMV-myc vector (CMV promotor; Takara Bio Inc.).
For the TCAF1PI3K mutant, a stop codon was introduced into the pCMV-TNT-TCAF1 construct by the substitution C2162G using in vitro mutagenesis (QuikChange Site-directed Mutagenesis kit; Agilent Tech-nologies). All long PCRs were performed with the High Fidelity Phusion DNA Polymerase (Finnzymes) and all constructs were verified by se-quence analysis.
For the fluorescent chimera, mTurquoise2 and SYFP2 were cloned in a home-made vector derived from pEGFP-N1 (CMV promotor; Takara Bio Inc.) in which we substituted the multicloning site with a homemade coun-terpart that accept 5 cloning of DNA with NheI and AgeI and 3 cloning of DNA with Sac II and Not I. The sense linker sequence was: 5-GCTAGCATTGAACCGGTGGAGTAGGCgCCGGtGGAGGAGGAGG- GTtACCTGTTGTTGGAGGAGTTGTTGGAGGAGGAGTTGTTGGT- GGTGTTGTTGGTGTTGGGTtACCTGGTGGCgCCGGtGGTGTTGGCCG-CGGATTATGCGGCCGC-3. This vector was design to normalize the size and amino acid sequence of the linker between the protein of interest and the fluorescent protein. Labels given to these vectors are intuitive: X-pSYFP2-N means that SYFP2 consists of the X-pSYFP2-N terminal part of the chimera while X-pmTurquoise2-C means that mTurquoise2 is located at the C terminus of the chimera. TRPM8-pmTurquoise2-C, TCAF1-pSYFP2-N, TCAF1-pSYFP2-C, TCAF2-pSYFP2-N, and TCAF2-pSYFP2-C were constructed as described. T.W.J. Gadella (Swammerdam Institute for Life Sciences, van Leeuwenhoek Centre for Advanced Microscopy, University of Amsterdam, Amsterdam, Netherlands) provided the riginal pmTurquoise2-N1, pmTurquoise2-C1, and pSYFP2-C1 vectors. Before the clone of TCAF1 and -2 in the recipient vector, the AgeI site was suppressed by single point mutation using in vitro mutagenesis (QuikChange Site-directed Mutagenesis kit) and checked by sequencing. Fragments were amplified by the mean of PCR with the follow-ing couples of primers: for TRPM8, 5-GATCCCGCGGTTCCTTTCGGG- CAGCCAGG-3/5-AGTCGCGGCCGCTCAATGGTGATGGTGATGATG-ACCGG-3; for TCAF1, 5-GATCGCTAGCCGCCACCATGGCGACTC-CCTCTGCTG-3/5-GATCACCGGTGTGGGGCATCTGTGTGA-3 and 5-GATCCCGCGGTGCGACTCCCTCTGCTGC-3/5-AGTCGCGGCCG-CTCAGTGGGGCATCTGTGTGAGGA-3; for TCAF2, 5-GATCGCTAGC- CGCCACCATGGCGACCATTGCTGC-3/5-GATCACCGGTTCCCCTT-CTCCCAGAATTTCT-3 and 5-GATCCCGCGGTGCGACCATTGCTGCT-GCT-3/5-AGTCGCGGCCGCTCATCCCCTTCTCCCAGAATTTCTGC-3. After a 0.8%-agarose gel purification (Wizard SV gel and PCR Clean-Up System; Promega), PCR products and recipient vectors were digested with either NheI + AgeI or SacII + NotI at 37°C overnight. After DNA purifica-tion, PCR products and vectors were ligated overnight and transformed in DH5 chemo-competent bacteria (NEB). Final plasmids were extracted and sequenced before performing the experiments.
siRNAs were generated against the human sequences 5-TTATTG-GAGAGGCTTCATT-3 (siTCAF1; Eurogentec), 5-GGCTTCCCTGGTAACA-TCATCCTCA-3 (siTCAF2; Invitrogen), and the luciferase 5-CTTACGCT-GAGTACTTCGA-3 (siLuc; Eurogentec).
GST fusion proteins and pull-down assay
TRPM8 N- and C-terminal tail GST fusion proteins were produced and purified as per the manufacturer’s instructions. In brief, BL-21 cells were
![Figure 3. TCAF1 and TCAF2 interact and colocalize with TRPM8. (A) GST pull-down assay using [ 35 S]methionine-labeled TCAF1 or TCAF2 protein and GST or GST fused to the TRPM8 N-terminal tail (GST-M8N) or C-terminal tail (GST-M8C)](https://thumb-eu.123doks.com/thumbv2/123doknet/13627918.426211/6.918.111.781.87.909/figure-interact-colocalize-methionine-labeled-protein-terminal-terminal.webp)