HAL Id: hal-02621308
https://hal.inrae.fr/hal-02621308
Submitted on 26 May 2020
HAL is a multi-disciplinary open access
archive for the deposit and dissemination of sci-entific research documents, whether they are pub-lished or not. The documents may come from teaching and research institutions in France or abroad, or from public or private research centers.
L’archive ouverte pluridisciplinaire HAL, est destinée au dépôt et à la diffusion de documents scientifiques de niveau recherche, publiés ou non, émanant des établissements d’enseignement et de recherche français ou étrangers, des laboratoires publics ou privés.
How to optimize the precision of allele and haplotype
frequency estimates using pooled-sequencing data.
Nicolas Rode, Yan Holtz, Karine Loridon, Sylvain Santoni, Joelle Ronfort,
Laurène Gay
To cite this version:
Nicolas Rode, Yan Holtz, Karine Loridon, Sylvain Santoni, Joelle Ronfort, et al.. How to optimize the precision of allele and haplotype frequency estimates using pooled-sequencing data.. Molecular Ecology Resources, Wiley/Blackwell, 2018, 18 (2), pp.194-203. �10.1111/1755-0998.12723�. �hal-02621308�
Version postprint
Accepted
Article
This article has been accepted for publication and undergone full peer review but has not been through the copyediting, typesetting, pagination and proofreading process, which may
DR. NICOLAS O. RODE (Orcid ID : 0000-0002-1121-4202) Article type : Resource Article
How to optimize the precision of allele and haplotype frequency
estimates using pooled-sequencing data
Nicolas O. Rode*†, Yan Holtz*
, Karine Loridon*, Sylvain Santoni*, Joëlle Ronfort* & Laurène Gay*
* INRA, UMR AGAP, F-34060 Montpellier, France
† Current address: CBGP, INRA, CIRAD, IRD, Montpellier SupAgro, Univ. Montpellier,
Montpellier, France
Correspondence: Nicolas O. Rode; Fax: +33 4 99 62 33 45; E-mail:
Running title: Frequency estimation using pool sequencing
Keywords: Allele frequency estimation, haplotype frequency estimation, population
genomics, coverage depth, fitness, experimental evolution
Abstract:
Sequencing pools of individuals rather than individuals separately reduces the costs of estimating allele frequencies at many loci in many populations. Theoretical and empirical studies show that pool-sequencing a limited number of individuals (typically fewer than 50) provides reliable allele frequency estimates, provided that the DNA pooling and DNA sequencing steps are carefully controlled. Unequal contributions of different individuals to
Version postprint
Accepted
Article
the DNA pool and the mean and variance in sequencing depth both can affect the standard error of allele frequency estimates. To our knowledge, no study separately investigated the effect of these two factors on allele frequency estimates; so that there is currently no method to a priori estimate the relative importance of unequal individual DNA contributions independently of sequencing depth. We develop a new analytical model for allele frequency estimation that explicitly distinguishes these two effects. Our model shows that the DNA pooling variance in a pool-sequencing experiment depends solely on two factors: the number of individuals within the pool and the coefficient of variation of individual DNA contributions to the pool. We present a new method to experimentally estimate this coefficient of variation when planning a pool-sequencing design where samples are either pooled before or after DNA extraction. Using this analytical and experimental framework, we provide guidelines to optimize the design of pool-sequencing experiments. Finally, we sequence replicated pools of inbred lines of the plant Medicago truncatula and show that the predictions from our model generally hold true when estimating the frequency of known multi-locus haplotypes using pool-sequencing.
Introduction
Population genetic studies often require sequencing a large number of individuals at many loci. Over the last decade, individual-based genotyping using next-generation sequencing technologies (NGS) have revolutionized the field. However, the cost of sequencing whole genomes of many individuals in many populations with high coverage remains prohibitive. Sequencing pools of individuals (pool-seq) allows reducing both library preparation and sequencing costs. Pool-seq is obviously preferred to individual-based sequencing when the original sample is naturally pooled or when the amount of DNA recovered per individual is too low for individual sequencing (e.g. typically in microbes). It can also be combined with
Version postprint
Accepted
Article
RAD- or exome sequencing, when the cost of whole genome sequencing remains prohibitive (e.g. in organisms with large genome sizes, Schlötterer et al. 2014).
When using pool-seq data, estimates of the frequency of a focal allele in a population (hereafter ) are affected by three main sources of variation. First, sampling variance stems from both sampling a limited number of individuals and from the actual frequency of the focal allele in the population (Gautier et al. 2013a). Second, DNA pooling variance arises through unequal individual contributions to the DNA pool. When samples are pooled before DNA extraction, variation in DNA yield across individual samples can result in unequal individual DNA contributions. Such variation in DNA yield can arise from phenotypic variation in body size (e.g. if whole individuals are directly pooled) or whenever individual samples with similar mass differ in their DNA content (e.g. if samples from different developmental stages are pooled). Alternatively, when samples are pooled after DNA extraction, DNA quantification and pipetting errors across samples can result in unequal individual contributions to the DNA pool. Third, sequencing variance comprises the variability introduced during the library preparation (e.g. through the use of PCR to increase DNA quantity) and during sequencing itself (e.g. through stochastic changes in sequencing depth).
These three sources of variation should not bias allele frequency estimates ( ), unless a certain genotype is more likely to be sampled, to yield more DNA, or to produce more sequencing reads compared to other genotypes in the population. However, they can greatly decrease the precision and increase the standard error of allele frequency estimates. A sound pool-seq design should seek to minimize the bias and maximize the precision of allele frequency estimates. The impact of sampling and sequencing variances on the precision of allele frequency estimates ( ) has been quantified in several theoretical studies (e.g. Futschik & Schlötterer 2010; Gautier et al. 2013a; Lynch et al. 2014). Yet, only Gautier et al.
Version postprint
Accepted
Article
(2013a) investigated the impact of DNA pooling variance on . They define the effective sample size of a DNA pool, , which represents the number of individuals with equal contributions in an idealized pool that would show the same amount of variance in allele frequency estimates. They propose a Bayesian model to estimate a posteriori, based on the results of previous pool-seq experiments. This retrospective estimation limits the usage of their method for the prospective design of pool-seq experiments. In addition, their estimation of the effective pool size, , does not explicitly distinguish DNA pooling variance from DNA sequencing variance. The empirical estimates of are therefore systematically biased downward, as they vary positively with sequencing depth (Gautier, pers. com.).
For a given sequencing cost, Gautier et al. (2013a) show that even with large unequal individual DNA contributions (based on their underestimated ), sequencing pools of 100 individuals provides allele frequency estimates as or more accurate than sequencing individually barcoded samples. Molecular ecologists have frequently considered 50-100 individuals as the lower limit to decide on whether using pool or individual sequencing, following recommendations of Schlötterer et al. (2014). However, this limit appears to be overly conservative. Whenever the number of samples is a limiting factor (e.g. when working with rare or endangered species), pooling fewer than 50 individuals can still result in reliable allele frequency estimates, provided that DNA pooling and sequencing variances are carefully accounted for. For example, Gautier et al. (2013a) showed that allele frequency estimates when pool-sequencing 30 individuals or when sequencing 20 individuals separately were highly correlated with each other (with correlation coefficients ranging from 0.93 to 0.99 depending on SNP coverage depth). This contradicts the general consensus of pooling always more than 50-100 individuals. However, whether 30 individuals is adequate or 50-100 individuals is necessary is not yet clear, as none of the current models for the precision of allele frequency estimations explicitly separates DNA pooling and DNA sequencing
Version postprint
Accepted
Article
variances. Hence, making informed decisions regarding the choice of individual- vs. pool-sequencing remains difficult.
In this study, we derive a new analytical model for the precision of allele frequency estimates based on pool-sequencing data. Our model accounts for the respective effects of the three main sources of variation on (sampling, DNA pooling and sequencing variances). Contrary to previous models, this model can estimate the precision of allele frequency estimates of a planned pool-seq experiment a priori, without performing an expensive and time-consuming preliminary pool-seq experiment. Our model also allows a comparison of the accuracy of different experimental designs (e.g using individual vs. pool-sequencing). Capitalizing on our modeling framework, we synthesize and improve the recommendations scattered across different studies regarding the preparation of pool-seq experiments (e.g. Gautier et al 2013, Schötterer et al 2014). In particular, we correct the equation for the effective pool size (Gautier et al 2013). We also provide a new method to experimentally estimate the coefficients of variation of DNA yield and the coefficient of variation of DNA quantification and pipetting. We thus provide additional recommendations regarding the pooling of individuals before or after DNA extraction. Finally, we show that our general recommendations hold true when estimating the frequency of multi-locus haplotypes based on the sequencing of replicated pools of the plant Medicago truncatula.
Materials and Methods
We consider a haploid population, from which individuals are independently sampled. We present analytical expressions for the expectation and variance of , the frequency of a focal allele in the population, at each step of a typical sequencing experiment: individual sampling (step 1), DNA pooling (step 2) and pool sequencing (step 3).
Version postprint
Accepted
Article
Step 1: Individual sampling
We define the sampling variance as . The number of individuals with the focal allele among a total of (haploid) individuals independently sampled from the population follows a binomial distribution. Hence, the frequency of the focal allele is characterized by the expectation and the variance (Casella & Berger 2002,
p. 332).
Steps 1-2: Individual sampling and DNA pooling
We define the sampling variance and the variance due to unequal individual contributions to the DNA pool as . For a given experiment, individuals can be pooled before or
after DNA extraction and this will affect the expectation and variance of individual contributions to the DNA pool. When pooling individuals before DNA extraction, for each individual, a certain amount of material (e.g. tissue, whole individual, etc) is added to the pool. Each individual contributes an unknown amount of DNA ( ) with some variance ( ). This variance in DNA yield can be due to differences in DNA accessibility or DNA content across individuals (e.g. if grinding is less efficient for individuals with thicker cell walls). When pooling individuals after DNA extraction, DNA from each individual is extracted separately and quantified so that a predefined amount of DNA ( ) is added to the DNA pool with some variance ( ) that depends both on the variance in DNA quantification and pipetting. When pooling individuals after DNA extraction, the expectation depends on individual DNA concentration ( ) and on the pipetted volume ( ) so that:
, (1)
and the variance depends on the same parameters and on the variation in individual DNA concentration ( ) and volume ( ) as follows:
Version postprint
Accepted
Article
(2)
Note that it is possible to compare the coefficients of variation (defined as ) when pooling individuals before or after DNA extraction (hereafter and ) to decide
whether to pool individuals before or after DNA extraction (see below for the experimental method regarding this comparison).
Steps 1-3: Individual sampling, DNA pooling and pool sequencing
includes the sampling variance, the variance due to unequal individual
contributions to the DNA pool and the sequencing variance. We assume that sequencing depth is the only factor affecting individual frequency within the pool of reads and thus ignore potential other factors such as library preparation or sequencing errors. Kofler et al. (2016) have shown that library preparation explains less than 1% of the variation in allele frequency estimates. Following previous studies (Robinson & Smyth 2008; Gautier et al. 2013a), we assume that increasing the average sequencing depth increases the variance in sequencing depth. Hence, we assume a count distribution for the total number of reads observed at a given genomic position. Accordingly, the sequencing depth of the pool can either be a Poisson distribution of parameter or a negative binomial distribution of parameter and (Hilbe 2011, p. 3). corresponds to the expectation of the number of reads, whereas is the overdispersion (i.e. we assume , where
represents the variance in read counts). When tends toward 0, the negative binomial converges toward a Poisson distribution of parameter . Gautier et al. (2013a) used an alternative parameterization for the negative binomial ( , where is the
multiplicative overdispersion). As the variance in sequencing depth often increases quadratically with the mean sequencing depth (e.g. Fig. 1a, Anders & Huber 2010), estimates
Version postprint
Accepted
Article
of are likely to vary greatly between pool-seq experiments differing in sequencing depth. In contrast, estimates of should mostly be independent of sequencing depth and should therefore be more consistent across pool-seq experiments. Without loss of generality, we will only use the negative binomial distribution in the following formulae (as corresponds to the Poisson assumption). We derived the analytical expression for the expected variance when performing a pool-seq experiment, . We computed the square root of the ratio of and the variance expected when performing individual sequencing of 20
diploid organisms, (based on Eq. 2 in Gautier et al. 2013a). We compared the relative importance of each parameter, using a range of values relevant to pool-seq experiments ( : 20%, 50% and 100%; : 50X, 100X and 200X and : 0.2, 0.5 and 1). The web implementation of our model, created in R using a shiny web framework (Chang et al. 2015), is available at http://www.agap-sunshine.inra.fr/unics/. It should help molecular ecologists to evaluate the precision of allele frequency estimates in their pool-seq experiments and possibly improve their experimental design.
Experimental estimations of and
We developed a new method to experimentally estimate the coefficients of variation of DNA yield ( ) and the coefficient of variation of DNA quantification and pipetting ( ). We sampled an equal amount of young leaves from each of 28 plants of the model
legume Medicago truncatula. When DNA yield is strongly correlated to tissue mass, individual DNA contributions can be standardized by weighing each sample individually. When this correlation is weak or absent, such standardization is time consuming and estimating the amount of tissue of each sample by eye appears preferable. To test for a correlation between tissue mass and DNA yield, we sampled approximately equal amounts of young leaves (as judged by eye) and weighed each of the 28 samples individually on an
Version postprint
Accepted
Article
AE260 DR microbalance (Mettler-Toledo, Columbus, Ohio, USA). Thus, we retrospectively tested for the existence of a correlation between tissue mass and DNA yield. DNA from each sample was extracted following the protocol detailed in Loridon et al. (2013) (Supporting Information S2). DNA concentration was estimated using either the Quant-iT PicoGreen dsDNA Assay Kit (Thermo Fisher Scientific, Waltham, Massachusetts, USA), following the supplier’s indications or using Hoechst (bis-benzimide) spectrofluorometry. We used independent samples (hereafter technical replicates) from each of the 28 DNA extracts and estimated the DNA concentration of each technical replicate four times (hereafter reading replicates), resulting in a total of 560 observations for Picrogreen quantification (28 plants DNA extracts x 5 technical replicates x 4 reading replicates) and 448 observations for Hoechst quantification (28 plants DNA extracts x 4 technical replicates x 4 reading replicates). We partitioned the variance in DNA concentration using a linear mixed model in the lme4 package (Bates et al. 2015) in R (R 3.3.1, http://www.r-project.org/, R Development Core Team 2013). The DNA concentration of the kth
reading replicate of the jth technical
replicate of the ith sample was estimated as:
, (3)
where (the average DNA concentration across samples) and (mass of the ith sample) are fixed effects and sample, replicate and the error are random effects.
We estimated the variance in DNA yield across samples ( ), across technical replicates ( ) and across reading replicates (residual variance ). was estimated as:
(4)
To experimentally estimate , we quantified the pipetting variance ( ) using six
Version postprint
Accepted
Article
Finland, see Supporting Information S2). The variance in DNA quantification ( ) was computed as . was estimated as:
(5)
where = 5 µl (set by the experimenter). We used parametric bootstrapping with 1000
replicates to estimate the 95% confidence interval of each fixed or random effect, as well as and (percentile bootstrap method, Davison & Hinkley 1997; Bates et al. 2015; Canty & Ripley 2016). Briefly, for each bootstrap replicate, was estimated
using the bootstrap values of and , while was estimated by combining the bootstrap values of , and according to Eq. 5. Variance estimates are inversely proportional to the number of replicates used to estimate them (Casella & Berger 2002, p. 331). When the heterogeneity in DNA yield is the same within and among individuals (i.e. when DNA yields of different leaves from the same individual are not correlated), using samples per individual decreases the variance to
. We investigated the effect of increasing on using a range of
parameters (i.e. ranging from 1 to 10 leaf samples per individual). We similarly
investigated the effect of , the number of pipetting replicates (using
with
ranging from 1 to 10), and the volume pipetted on (with ranging
from 0.1 to 10µl). Finally, we examined how increasing the number of technical replicates (using
with ranging from 1 to 10) and reading replicates (using with
ranging from 1 to 10) decreases .
Version postprint
Accepted
Article
Most experimental pool-seq studies have evaluated the reliability of allele frequency estimations, but never considered haplotype frequency estimations (e.g. Gautier et al. 2013a; Rellstab et al. 2013). To fill this gap, we tested whether the relationship between
and unequal individual DNA contributions or sequencing depth predicted by our single-locus model holds true when estimating haplotype frequencies using pool-seq. We extracted DNA from pools of leaves of several inbred lines of the selfing plant Medicago truncatula. We performed replicated sequencing of these DNA pools and estimated the frequency of each original haplotype using the software Harp (Kessner et al. 2013). We estimated the effect of unequal individual DNA contributions, sequencing depth and the number of loci sequenced on after controlling for sampling variance. Details regarding the methods and
results are presented in Supporting Information S3.
Results
Details of analytical derivations of the following formulae are available in Supporting Information S1 (Table S1). Simulations show that the predictions of our analytical model are valid over most of the range of the different parameters tested (Figures S1-S4). The sampling variance (for Step 1) is presented in the Materials and Methods section.
Version postprint
Accepted
Article
Steps 1-2: Individual sampling and DNA pooling
The expectation and variance of the frequency, , of a focal allele in a sample of individuals due to both sampling variance (Step 1) and DNA pooling (Step 2) can be written as:
(6)
(7)
where represents the coefficient of variation of the DNA amount of each individual.
Steps 1-3: Individual sampling, DNA pooling and pool sequencing
Taking into account the variance due to the sequencing process (Step 3), the expectation and variance of the estimator becomes:
(8) , (9)
where represents the average sequencing depth and represents the overdispersion in sequencing depth (see methods for details). This formula is valid for both haploid organisms and completely inbred lines or diploid outcrossing organisms, when substituting for .
Relative importance of DNA pooling variance and sequencing variance
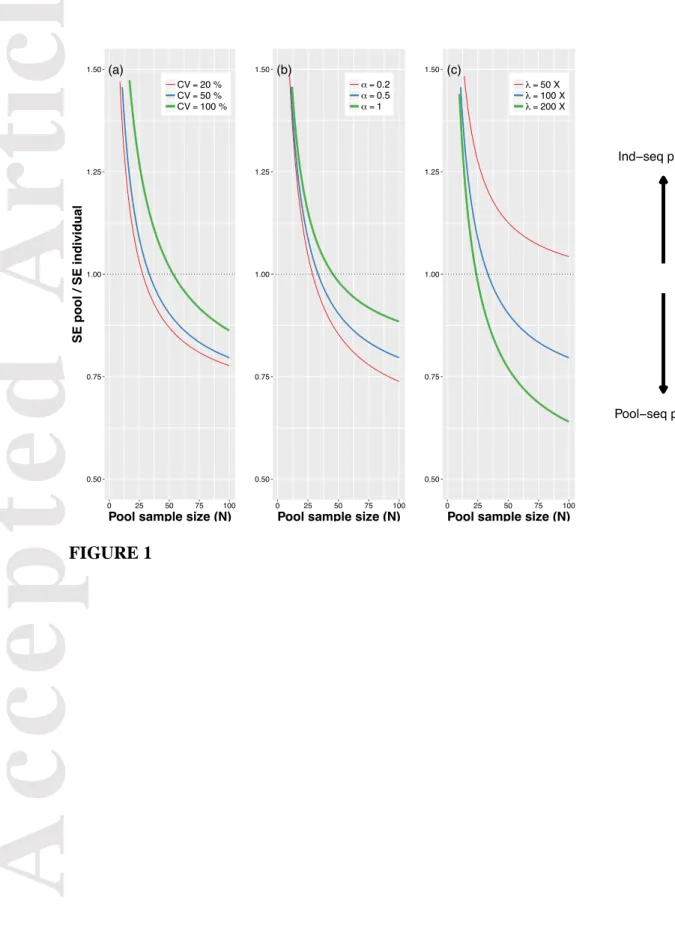
Equation 9 shows that unequal individual contributions and the overdispersion in sequencing depth both have a relatively small effect on the variance of allele frequency estimates compared to the average sequencing depth (Figure 1). Pool-sequencing more than 40 diploid individuals, rather than sequencing 20 diploid individuals separately provides more accurate allele frequency estimates under a wide range of experimental conditions (typically with
Version postprint
Accepted
Article
and X). In addition, it is worth noting that decreasing unequal contributions (e.g. from to ) has a larger effect for small sample sizes compared to large sample sizes (Figure 1).
Comparison with previous models
Equation 9 is equivalent to Eq. 4 in Gautier et al. (2013a), when individual contributions to the DNA pool are equal (i.e. ) and when there is a linear relationship between their parameter of overdispersion in sequencing depth, , and the average sequencing depth (i.e. ). Contrary to Gautier et al. (2013a), our parameter for the overdispersion in sequencing depth, , is independent from . Whenever sequencing depth is variable across pool-seq experiments, our parameterization is therefore better at predicting the precision of allele frequency estimates of future pool-seq experiments (see Supporting Information S3).
Gautier et al. (2013a) define the effective sample size of a DNA pool, , which represents the number of individuals with equal contributions in an idealized pool that would show the same amount of variance in allele frequency. They also define the experimental error rate, , which quantifies the amount of unequal individual contribution within the DNA pool such as: . Based on Eq. 9 and assuming that all sequencing variance is due to the variance in sequencing depth (i.e. considering that library preparation does not affect the proportion of each individual within the pool), we show that:
(10)
and (see Supporting Information S1 for computational details). This shows that and are independent from the mean and variance in sequencing depth.
Version postprint
Accepted
Article
According to the hierarchical model of Gautier et al. (2013a), the allele frequency at the ith locus of the jth replicate, pij, follows a truncated Gaussian distribution (Eq. 8):
.
Our model allows correcting the formula for , such that:
,
where , and are respectively the effective pool size, the average sequencing depth of replicate j and the coefficient of variation in individual contributions to the DNA pool. For diploid organisms, has to be substituted by 2 .
Experimental estimations of and
Although there was a two-fold variation in mass across our samples, we did not detect any positive relationship between leaf tissue mass and DNA yield (Hoechst quantification: R= -0.0969, 0.1878; -0.0043; ; PicoGreen quantification: R= 0.0821; 95%CI:-0.0007, 0.1639; , Figure S5). The negative correlation detected with Hoechst quantification is likely to be spurious, as suggested by the near zero correlation and the high p-value. The coefficient of variation of individual contributions to the DNA pool was smaller when pooling samples before than after DNA extraction for Hoechst quantification ( = 26.8%, = 29.3%, Table 1), but not for PicoGreen quantification ( = 24.0%,
= 21.1%, Table 1). However, the 95% confidence intervals of the different estimates
largely overlapped, indicating no significant differences between the different DNA extraction and quantification protocols tested. Increasing the number of replicates helps reduce variances (e.g. DNA yield, DNA quantification or pipetting variances). For example,
using three DNA quantification replicates results in a variance of .
Version postprint
Accepted
Article
and decreases to 7.6% when using PicoGreen quantification with three technical
replicates per individual and three reading replicates per technical replicate (Figure 3a). In contrast, increasing the volume pipetted or the number of pipetting replicates only has a negligible effect on (Figure 3b).
Discussion
In this study, we derive a new analytical model for the estimation of the effective pool size of pool-seq experiments. The parameters from our model can be computed without performing a preliminary pool-seq experiment. We provide a theoretical framework and a web application (available at http://www.agap-sunshine.inra.fr/unics/) to quantify the precision of allele frequency estimates in a future pool-seq experiment in a cost and time-effective manner. Our theoretical and experimental framework comprises a variety of experimental designs (e.g. pool-sequencing a small or a large number of individuals with a high or low coverage, pooling individuals before or after DNA extractions, etc.). In Supporting Information S3, we experimentally demonstrate that pool-seq can be used to reliably estimate the frequencies of known haplotypes within a DNA pool. We also discuss the specificities of multi-locus haplotype frequency estimations using pool-seq.
Comparison with previous models
In line with previous models, our model accounts for both sampling and sequencing variances and predicts that the precision of frequency estimations increases with the number of individuals sampled and with the average sequencing depth (Futschik & Schlötterer 2010; Gautier et al. 2013a; Lynch et al. 2014). Contrary to other models, it explicitly distinguishes the variance due to unequal individual DNA contributions from the sequencing variance (Step 2 vs. Step 3). Gautier et al. (2013a) built a Bayesian hierarchical model to estimate a
Version postprint
Accepted
Article
posteriori the effective pool size of pool-seq experiment data ( ) and plug the estimates into their PIFs software to design future pool-seq experiments. Our model highlights that their Bayesian model confounds unequal individual DNA contributions (i.e. their experimental error rate, ) with sequencing depth. Our correction for their Eq. 8 improves the estimation of and allows an accurate estimation of based on pool-seq experiment data. We also provide a method to empirically determine without having to perform a preliminary pool-seq experiment. We obviously expect that estimates based on previous pool-pool-seq data will provide better predictions for the precision of allele frequency estimates, provided that the experimental conditions remain unchanged. Finally, we developed the UNICS shiny web application to help design pool-seq experiments and improve the precision of allele frequency estimates. For instance, given a sequencing cost, this application can help compare the precision of allele frequency estimates for individual- vs. pool-sequencing. It should be particularly useful for experimental biologists, particularly those aiming at pool-sequencing a limited number of individuals.
Although experimental conditions are likely to vary across study systems, samples, laboratory and sequencing conditions (e.g. library preparation, sequencing depth, platform or chemistry), we make several general recommendations.
How to optimize a pool-seq experiment? Step 1: Individual sampling step
The actual frequency of an allele in the population, , impacts the precision of haplotype frequency estimation (Figure S1 and S2). The precision is thus expected to be lower in pools with balanced allele frequencies (i.e. with ) compared to pools with unbalanced frequencies (see Figure 4 in Kessner et al. 2013). In most experiments, this frequency cannot be controlled for. In contrast, whenever possible, increasing the number of individuals sampled, , is paramount. It reduces not only the sampling variance, but also the DNA
Version postprint
Accepted
Article
pooling and sequencing variances (see Eq. 9). Depending on the sequencing depth and on the amount of unequal individual contributions, pool-sequencing more than 40 diploid individuals can results in allele frequency estimates that are as or more reliable than sequencing 20 diploid individuals separately (Figure 1).
How to optimize a pool-seq experiment? Step 2: DNA pooling step
Our model shows that the coefficient of variation of the amount of DNA of each individual, , has a low impact on the variance of the estimator compared to the average sequencing depth and the overdispersion in sequencing depth. Yet, the results of our pool-seq experiment illustrate that unequal individual contributions can greatly decrease the precision of frequency estimations, even if this impact is likely overestimated due to our experimental design (as we used leaves from a single individual per haplotype for pool-sequencing, see Supporting Information S3). We provide simple recommendations to keep as small as possible. Importantly, the choice of pooling samples before or after DNA extraction crucially depends on the number of individuals that can be pooled with one method or the other and the associated DNA extraction costs. The optimal choice is likely to vary across study systems and laboratory facilities. For example, pooling samples before rather than after DNA extraction might provide more reliable allele frequency estimates if it allows pooling more individuals or if the variance in DNA yield across individuals is low compared to the variance in DNA quantification ( ).
Our results suggest that decreasing (i.e. when pooling individuals before DNA extraction) might prove technically more challenging than decreasing (i.e.
when pooling individuals after DNA extraction). Although we used young leaves with a similar physiological state, we observed a large variance in DNA yield across individuals that resulted in the lack of a positive correlation between DNA yield and leaf mass (Figure S5).
Version postprint
Accepted
Article
Decreasing the between-individual DNA yield variance can help reducing . If whole
individuals are pooled, we recommend using individuals of the same age that are more likely to have similar DNA content. Otherwise, we recommend choosing tissues or organs with similar developmental stages and with the lowest variance in DNA yield across individuals. Beside variation in DNA concentration among individuals, variation in DNA yield can arise through variation in extraction efficiency among individuals. Homogenization of ground tissue for all individuals together through simultaneous grinding can also minimize the variance in DNA yield across individuals. Note that the variance in DNA yield used for our experimental estimation of accounts for both the variances in DNA concentration and in extraction efficiency. Increasing the number of samples (e.g. sampling several leaves) per individual can help further reduce . However, this strategy will not reduce the
variance in DNA yield whenever the heterogeneity in DNA yield between samples within individuals is small compared to the heterogeneity in DNA yield between individuals (i.e. when the DNA yields of samples from the same individual are correlated due to developmental or physiological differences across individuals). Similarly, DNA yields of samples from different individuals of the same genotype could be correlated. This is especially likely when working with field samples, for which controlling for the physiological state of tissues might be more challenging. For example, when whole individuals are pooled, individuals with a given genotype could emerge earlier, be on average larger and have a higher DNA yield per individual compared to other genotypes that emerge later in the season. Although more time-consuming and more costly, we recommend pooling samples after DNA extraction under such circumstances. Our results show that increasing the number of technical and reading replicates can help reducing . In contrast, increasing
Version postprint
Accepted
Article
Using our new experimental method, molecular ecologists can compute the expected
or .
How to optimize a pool-seq experiment? Step 3: Pool sequencing step
Our model shows that the overdispersion in sequencing depth ( ) has a low impact on allele frequency estimation compared to the average sequencing depth (when , ~ in Eq. 9). As cannot be controlled for, we recommend using a range of values from 0.1 to 1 (i.e. around the average estimated in our pool-seq experiment, , Supporting Information S3) to compute the expected precision of frequency estimations of future pool-seq experiments (http://www.agap-sunshine.inra.fr/unics/). In contrast, the average sequencing depth can be controlled for and its optimization is critical for accurate allele frequency estimations (Figure 1). In particular, increasing sequencing depth helps raising the precision of the frequency estimates of rare variants. When sequencing depth is higher than or equal to the number of individuals sampled, , the variance of the allele frequency estimate, , reaches a lower bound equal to the DNA pooling variance presented in Eq. 7 (ignoring interactions of order ). There is also a necessary tradeoff between the number of loci sequenced and their average sequencing depth. We recommend adjusting the sequencing design according to the information available in the study system. For example, when using RAD-sequencing on an organism where a reference genome is available, the number of fragments sequenced can be computed a priori for any restriction enzyme. When polymorphism data are available, sequence capture can be used to specifically target known polymorphic loci and increase their sequencing depth (see Mertes et al. 2011 for a review). The expected sequencing depth can be computed based on sequencing productivity (e.g. which is higher for Illumina than for PacBio sequencing) and on the expected number of loci
Version postprint
Accepted
Article
sequenced (e.g. high for whole genome sequencing or more limited for sequence capture or RAD-sequencing).
Our model does not account for PCR duplicates or allele dropout that are likely to increase the level of unequal individual contributions to the final pool of reads. Whenever the DNA sequencing protocol includes a step of random DNA fragmentation (e.g. RAD-seq, Nextera kit, etc.), removing PCR duplicates will decrease and increase resulting in an increased precision of allele frequency estimates (Gautier et al. 2013a). We recommend using library preparation protocols that allow removing PCR duplicates or that limit the number of PCR cycles (Aird et al. 2011). Allele dropout can occur whenever the DNA sequencing protocol includes a step of DNA fragmentation using restriction enzymes (e.g. Genotyping-by-Sequencing, RAD-seq, etc.). A potential solution is to identify and filter out SNP positions with allele dropout using information on read coverage depth or from previous individual-based sequencing experiments (Gautier et al. 2013b). Our model does not account either for sequencing errors, which can have a strong impact on allele frequency estimation of low frequency variants (Kessner et al. 2013; Lynch et al. 2014). When the positions of polymorphic sites are known, base quality score recalibration (e.g. using GATK BQSR, Auwera et al. 2013) can help improving the accuracy of allele frequency estimates.
In conclusion, by explicitly distinguishing DNA pooling and sequencing variance, the model we developed shows that the effective pool size is independent of sequencing depth, which was not apparent in the original parametrization used by Gautier et al. (2013a). Hence, our model corrects Eq. 8 of their Bayesian model, to properly estimate the effective pool size based on pool-sequencing data. We also propose a new experimental method to estimate a priori the expected level of unequal individual contributions to the DNA pool when pooling individuals either before or after DNA extractions. This method saves the time and money of pilot pool-seq experiments required by the method of Gautier et al. (2013a). We also
Version postprint
Accepted
Article
demonstrate experimentally that pool-seq can provide reliable estimates of the frequency of known haplotypes within a DNA pool. Our web app (http://www.agap-sunshine.inra.fr/unics/) should help experimental biologists improve the design of their future pool-seq experiments.
Acknowledgments
We thank Mathieu Gautier for helpful discussions regarding his statistical model as well as Ruth Hufbauer and Arnaud Estoup for their comments on a previous version on the manuscript. We are also grateful to Darren Kessner, John Novembre, Timothée Flutre and Gautier Sarah for their help with bioinformatics analyses. Analyses were performed on the CIRAD - UMR AGAP HPC Data Center of the South Green Bioinformatics platform (http://www.southgreen.fr/). Funding was provided by the Agence National de la Recherche (ANR SEAD - ANR-13-ADAP-0011) and the Marie Skłodowska-Curie/AgreenSkills Program (NOR).
References
Aird D, Ross MG, Chen W-S et al. (2011) Analyzing and minimizing PCR amplification bias in Illumina sequencing libraries. Genome Biology, 12, R18.
Anders S, Huber W (2010) Differential expression analysis for sequence count data. Genome Biology, 11, R106.
Auwera GA, Carneiro MO, Hartl C et al. (2013) From FastQ data to high‐confidence variant calls: the genome analysis toolkit best practices pipeline. Current protocols in
bioinformatics, 10–11.
Bates D, Mächler M, Bolker B, Walker S (2015) Fitting Linear Mixed-Effects Models Using lme4. Journal of Statistical Software, 67.
Version postprint
Accepted
Article
Canty A, Ripley B (2016) Package “boot”: Bootstrap R (S-Plus) Functions. , version 1.3-18. Casella G, Berger RL (2002) Statistical inference. Duxbury Pacific Grove, CA.
Chang W, Cheng J, Allaire J, Xie Y, McPherson J (2015) Shiny: web application framework for R. R package version 0.11, 1.
Davison AC, Hinkley DV (1997) Bootstrap methods and their application. Cambridge university press, Cambridge.
Futschik A, Schlötterer C (2010) The next generation of molecular markers from massively parallel sequencing of pooled DNA samples. Genetics, 186, 207–218.
Gautier M, Foucaud J, Gharbi K et al. (2013a) Estimation of population allele frequencies from next‐generation sequencing data: pool‐versus individual‐based genotyping. Molecular Ecology, 22, 3766–3779.
Gautier M, Gharbi K, Cezard T et al. (2013b) The effect of RAD allele dropout on the estimation of genetic variation within and between populations. Molecular Ecology, 22, 3165–3178.
Hilbe JM (2011) Negative binomial regression. Cambridge University Press.
Kessner D, Turner TL, Novembre J (2013) Maximum likelihood estimation of frequencies of known haplotypes from pooled sequence data. Molecular biology and evolution, 30, 1145–1158.
Kofler R, Nolte V, Schlötterer C (2016) The impact of library preparation protocols on the consistency of allele frequency estimates in Pool‐Seq data. Molecular ecology
resources, 16, 118–122.
Loridon K, Burgarella C, Chantret N et al. (2013) Single‐nucleotide polymorphism discovery and diversity in the model legume Medicago truncatula. Molecular ecology resources,
13, 84–95.
Version postprint
Accepted
Article
pooled-sequencing data. Genome biology and evolution, 6, 1210–1218.
Mertes F, ElSharawy A, Sauer S et al. (2011) Targeted enrichment of genomic DNA regions for next-generation sequencing. Briefings in functional genomics, elr033.
R Development Core Team R (2013) R: A Language and Environment for Statistical
Computing (RDC Team, Ed,). R Foundation for Statistical Computing, Vienna, Austria. Rellstab C, Zoller S, Tedder A, Gugerli F, Fischer MC (2013) Validation of SNP Allele
Frequencies Determined by Pooled Next-Generation Sequencing in Natural Populations of a Non-Model Plant Species. PLoS ONE, 8, e80422.
Robinson MD, Smyth GK (2008) Small-sample estimation of negative binomial dispersion, with applications to SAGE data. Biostatistics, 9.
Schlötterer C, Tobler R, Kofler R, Nolte V (2014) Sequencing pools of individuals [mdash] mining genome-wide polymorphism data without big funding. Nature Reviews Genetics,
15, 749–763.
Author Contributions
N.O.R. derived the analytical formulae. Y.H. and N.O.R. developed the shiny application. K.L., S.S., J.R. and L.G. conceived and designed the pool-seq experiment. K.L. conducted the DNA concentration estimations and pool-seq experiment. N.O.R. and L.G. analyzed the data and wrote the manuscript together with Y.H., K.L., S.S. and J.R. All authors discussed the results, read and approved the final manuscript.
Data Accessibility
(i) The code used to verify the analytical derivations with R simulations and the data and script used to experimentally estimate and are available from Dryad Digital Repository (http://dx.doi.org/10.5061/dryad.cr65v).
Version postprint
Accepted
Article
(ii) The web app of our model is available at: http://www.agap-sunshine.inra.fr/unics/. (iii) DNA sequences (in FASTQ format, after removal of adaptors) for each of the 11 accessions and 8 pool replicates are deposited in the European Nucleotide Archive (http://www.ebi.ac.uk/ena/data/view/PRJEB22590).
(iv) The VCF files of the 11 accessions, the concatenated reference genome and the BAM and DGRP files used for the Harp analyses are available from Dryad Digital Repository (http://dx.doi.org/10.5061/dryad.cr65v). The pipeline used for variant calling and for Harp analyses is available on github (https://github.com/nrode/src).
Supporting information
Additional supporting information may be found in the online version of this article. Supporting Information S1: Development of analytical expressions for the expectation and variance of the frequency of a focal haplotype in a pool of individuals
Table S1 List of the parameters used for the analytical derivations. Fig. S1 Effect of sample size and sequencing depth on . Fig. S2 Effect of sample size and sequencing depth on .
Fig. S3 Effect of dispersion in sequencing depth on .
Fig. S4 Effect of dispersion in sequencing depth on .
Supporting Information S2: Empirical estimations of and Fig. S5 Relationship between leaf tissue mass and DNA yield.
Supporting Information S3: Effects of average sequencing depth and overdispersion in sequencing depth on haplotype frequency estimates
Table S2 List of the accessions used for individual sequencing and for the sequencing of pools with either eight (Pool8) or three accessions (Pool3).
Version postprint
Accepted
Article
SNPs necessary to estimate haplotype frequency accurately under different virtual experimental evolution designs.
Table S4 Estimation of the mean sequencing depth , the dispersion in sequencing depth ( ) and the percentage of the sum of squared errors (SSE) explained by the total bias due to unequal individual contributions to the DNA pool.
Fig. S6 Correlation between the expected frequency of each haplotype based on weight and the observed frequency based on Harp estimations.
Fig. S7 Correlation between the observed average sequencing depth ( ) and the observed dispersion in sequencing depth as defined in our model ( ) or in the model of Gautier et al. (2013a) ( ) estimated across the SNPs loci for each of the eight sequencing replicates. Fig. S8 Correlation between total sequencing variance and (A) average sequencing depth ( ) or (B) dispersion in sequencing depth ( ).
Fig. S9 Correlation between total sequencing variance and dispersion in sequencing depth as defined in Gautier et al.'s (2013a) model ( ).
Fig. S10 Correlation between the total sequencing variance and the sum of the squared standard error estimated by Harp.
Fig. S11 Power to discriminate the different haplotypes as a function of the number of SNPs known in the reference.
Fig. S12 Effect of the number of known SNPs on total sequencing variance during four virtual experimental evolution experiments using Genotyping-by-Sequencing (ECOT22I-digested DNA pools).
Fig. S13 Effect of the number of known SNPs on total sequencing variance during four virtual experimental evolution experiments using Genotyping-by-Sequencing (ApeKI-digested DNA pools).
Version postprint
Accepted
Article
TABLE 1 Estimation of the coefficient of variation of the DNA amount of an individual
when pooling samples either before ( ) or after ( ) DNA extraction using Hoechst spectrofluorometry and PicoGreen DNA quantification.
Quantification method (95% CI) (95% CI)
Hoechst spectrofluorometry (bis-benzimide spectrofluorometry) 26.8% (18.3%-37.0%) 29.3% (21.1%-42.2%) PicoGreen 24.0% (17.0%-31.0%) 21.1% (18.8%-24.0%) Figure legends:
FIGURE 1 Effects of the size of the diploid individuals pool on the ratio of the standard
errors of allele frequency estimates when sequencing a pool of individuals ( )
and of the standard errors of allele frequency estimates when separately sequencing 20 barcoded diploid individuals with a sequencing depth of 5 X ( ). (a) Effect of unequal individual contributions, ( 100 X and 0.5). (b) Effect of the overdispersion in sequencing depth, ( 50% and 100 X). (c) Effect of the average sequencing depth, ( 50% and 0.5). When the ratio is above one, sequencing 20 barcoded diploid individuals (ind-seq) is preferable. When the ratio is below one, sequencing pools of diploid individuals is preferable.
FIGURE 2 Effect of the number of independent samples from the same individual on
Version postprint
Accepted
Article
FIGURE 3 Empirical estimations of using PicoGreen DNA quantification. (a) Effect
of the number of technical and reading replicates on . (b) Effect of pipetted volume and the number of pipetting replicates on .
Version postprint
Accepted
Article
Version postprint